Article

Quantitative Identification of Rural Functions Based on Big Data: A Case Study of Dujiangyan Irrigation District in Chengdu

College of Landscape Architecture, Sichuan Agricultural University, Chengdu 611130, China
*
Author to whom correspondence should be addressed.
Submission received: 10 February 2022 / Revised: 25 February 2022 / Accepted: 2 March 2022 / Published: 5 March 2022
(This article belongs to the Special Issue Land Use Optimisation)

Abstract

:
Urbanization increases the scales of urban spaces and the sizes of their populations, causing the functions in cities and towns to be in short supply. This study carries out functional space identification on the Dujiangyan elite irrigation area based on remote sensing data and point of interest (POI) data from Open Street Map (OSM), enabling the use of POI data to analyze rural functional spaces. Research and development and big data can greatly improve the accuracy of spatial function recognition, but research on rural spaces has limitations regarding the amount of available data. The Dujiangyan Irrigation District has low spatial aggregation levels for functions, scattered functions and linear distributions along roads. The mixing degrees of regional functions are low, the connections between functional elements are insufficient, and the comprehensive functional quality is low. The features of various functional elements in the region are significant, mostly in the discrete distribution mode, and functional compounding has become a trend. Therefore, it is necessary to integrate spatial resources and improve the centrality of cities and towns to realize the optimal allocation of resources and enable the development of surrounding cities and towns.

1. Introduction

With the acceleration of China’s urbanization process, the extensive development mode has made the increased the scales of urban spaces in rural areas and the population flows from rural areas to cities and towns, and a series of problems, such as housing shortages, the lack of public service resources and the insufficient supply of commercial facilities, have gradually appeared [1]. In this context, China proposed the concept of “a quarter-hour convenient life circle” to improve the convenience of life. A spatial function is the external expression of the internal resource elements and organizational structure of the associated space. As an auxiliary planning tool, spatial functional area identification can provide help regarding the rational allocation of resources and the optimization of the structures in urban and rural spaces; it can also provide data support for spatial planning [2,3].
At present, the research on functional space identification is relatively mature in the field of urban and rural planning, and the associated application scenarios are also more extensive. Through the construction of a spatial functional system, some scholars state that spatial functional transformation is driven by the transformation of residents’ needs during the process of social development and believe that the integration of rural spatial functions is achieved through increased urbanization [4,5]. Willemeny and Marque et al. divided rural space functions into five categories based on the type of utilized, including production and living space; they explained the relationship between each spatial function and ecosystem services and applied this approach to research on spatial function division in Germany and the Netherlands [6,7]. In the 1980s, China proposed development theories such as urban-rural integration [8]. Some scholars have divided rural spaces into three basic functions, production, living and ecology functions, and proposed the key points of rural vitality remodeling with planning guided by rural space functions [9,10]. Based on a rural production function, Longhua Lou evaluated rural functions through farmland changes, population changes and industrial structures [11]. Since various functions are interwoven in space, the traditional spatial function recognition approach has many problems, such as complicated classification methods and concerns regarding the accuracy of the output results. It has particularly difficulty with identifying mixed-use functional areas. With the advent of the big data era, some scholars have used geospatial big data to carry out “urban computing”. For example, an automatic land use identification system was designed based on weekday-weekend clustering of the signals generated by a cell phone base station network that divided Madrid into five types of functional areas [12]. Becke et al. used cellular network activity records to monitor changes in population density changes and identify residential and park functional areas in the New York metropolitan area [13]. Estima et al. verified the probability of a point-of-interest (POI) data point corresponding to the land use type of the region in which it was located, thus confirming the strong feasibility of utilizing POI data use in the study of regional urban functional inference [14]. Scholars from Tsinghua University in China used POI and urban bus data to identify urban functional areas and obtained the distribution of urban functional areas in Beijing [15]. Some scholars used POI and taxi GPS data in Guangzhou, adopted a temporal and spatial calculation method and selected a variety of models to perform cluster analysis on the behavior of citizens. They were able to obtain the distribution of advantageous aggregation areas for various urban functions [16]. Others used machine learning algorithms to improve the recognition rate of urban functions to greater than 95% [17]. The big data environment has considerably improved the accuracy of spatial functional area identification, has played a positive role in guiding the sensitive and scientific development of urban and rural spaces, and should serve as an important tool for assisting with urban and rural planning in the future. However, the existing research on spatial functions that utilize POI data mainly considers cities, while the research on rural areas is sparse.
Based on the above problems, this study takes the Dujiangyan Irrigation District as an example to construct a rural spatial function recognition system, and introduces the big data auxiliary function recognition to realize the fine expressions for spatial functions, and then obtains the functional pattern of the regional space. The purposes of this study are (1) to explore the feasibility of applying big data in rural spaces and the accuracy of rural space function identification; (2) to carry out functional identification, reveal the current situation of a functional space, and summarize the characteristics and laws of regional functions; and (3) to combine the current situation regarding regional spatial functions and propose strategies to expand these spatial functions and realize the optimal allocation of spatial resources, thereby providing a reference for the future development of the Dujiangyan region.

2. Materials and Methods

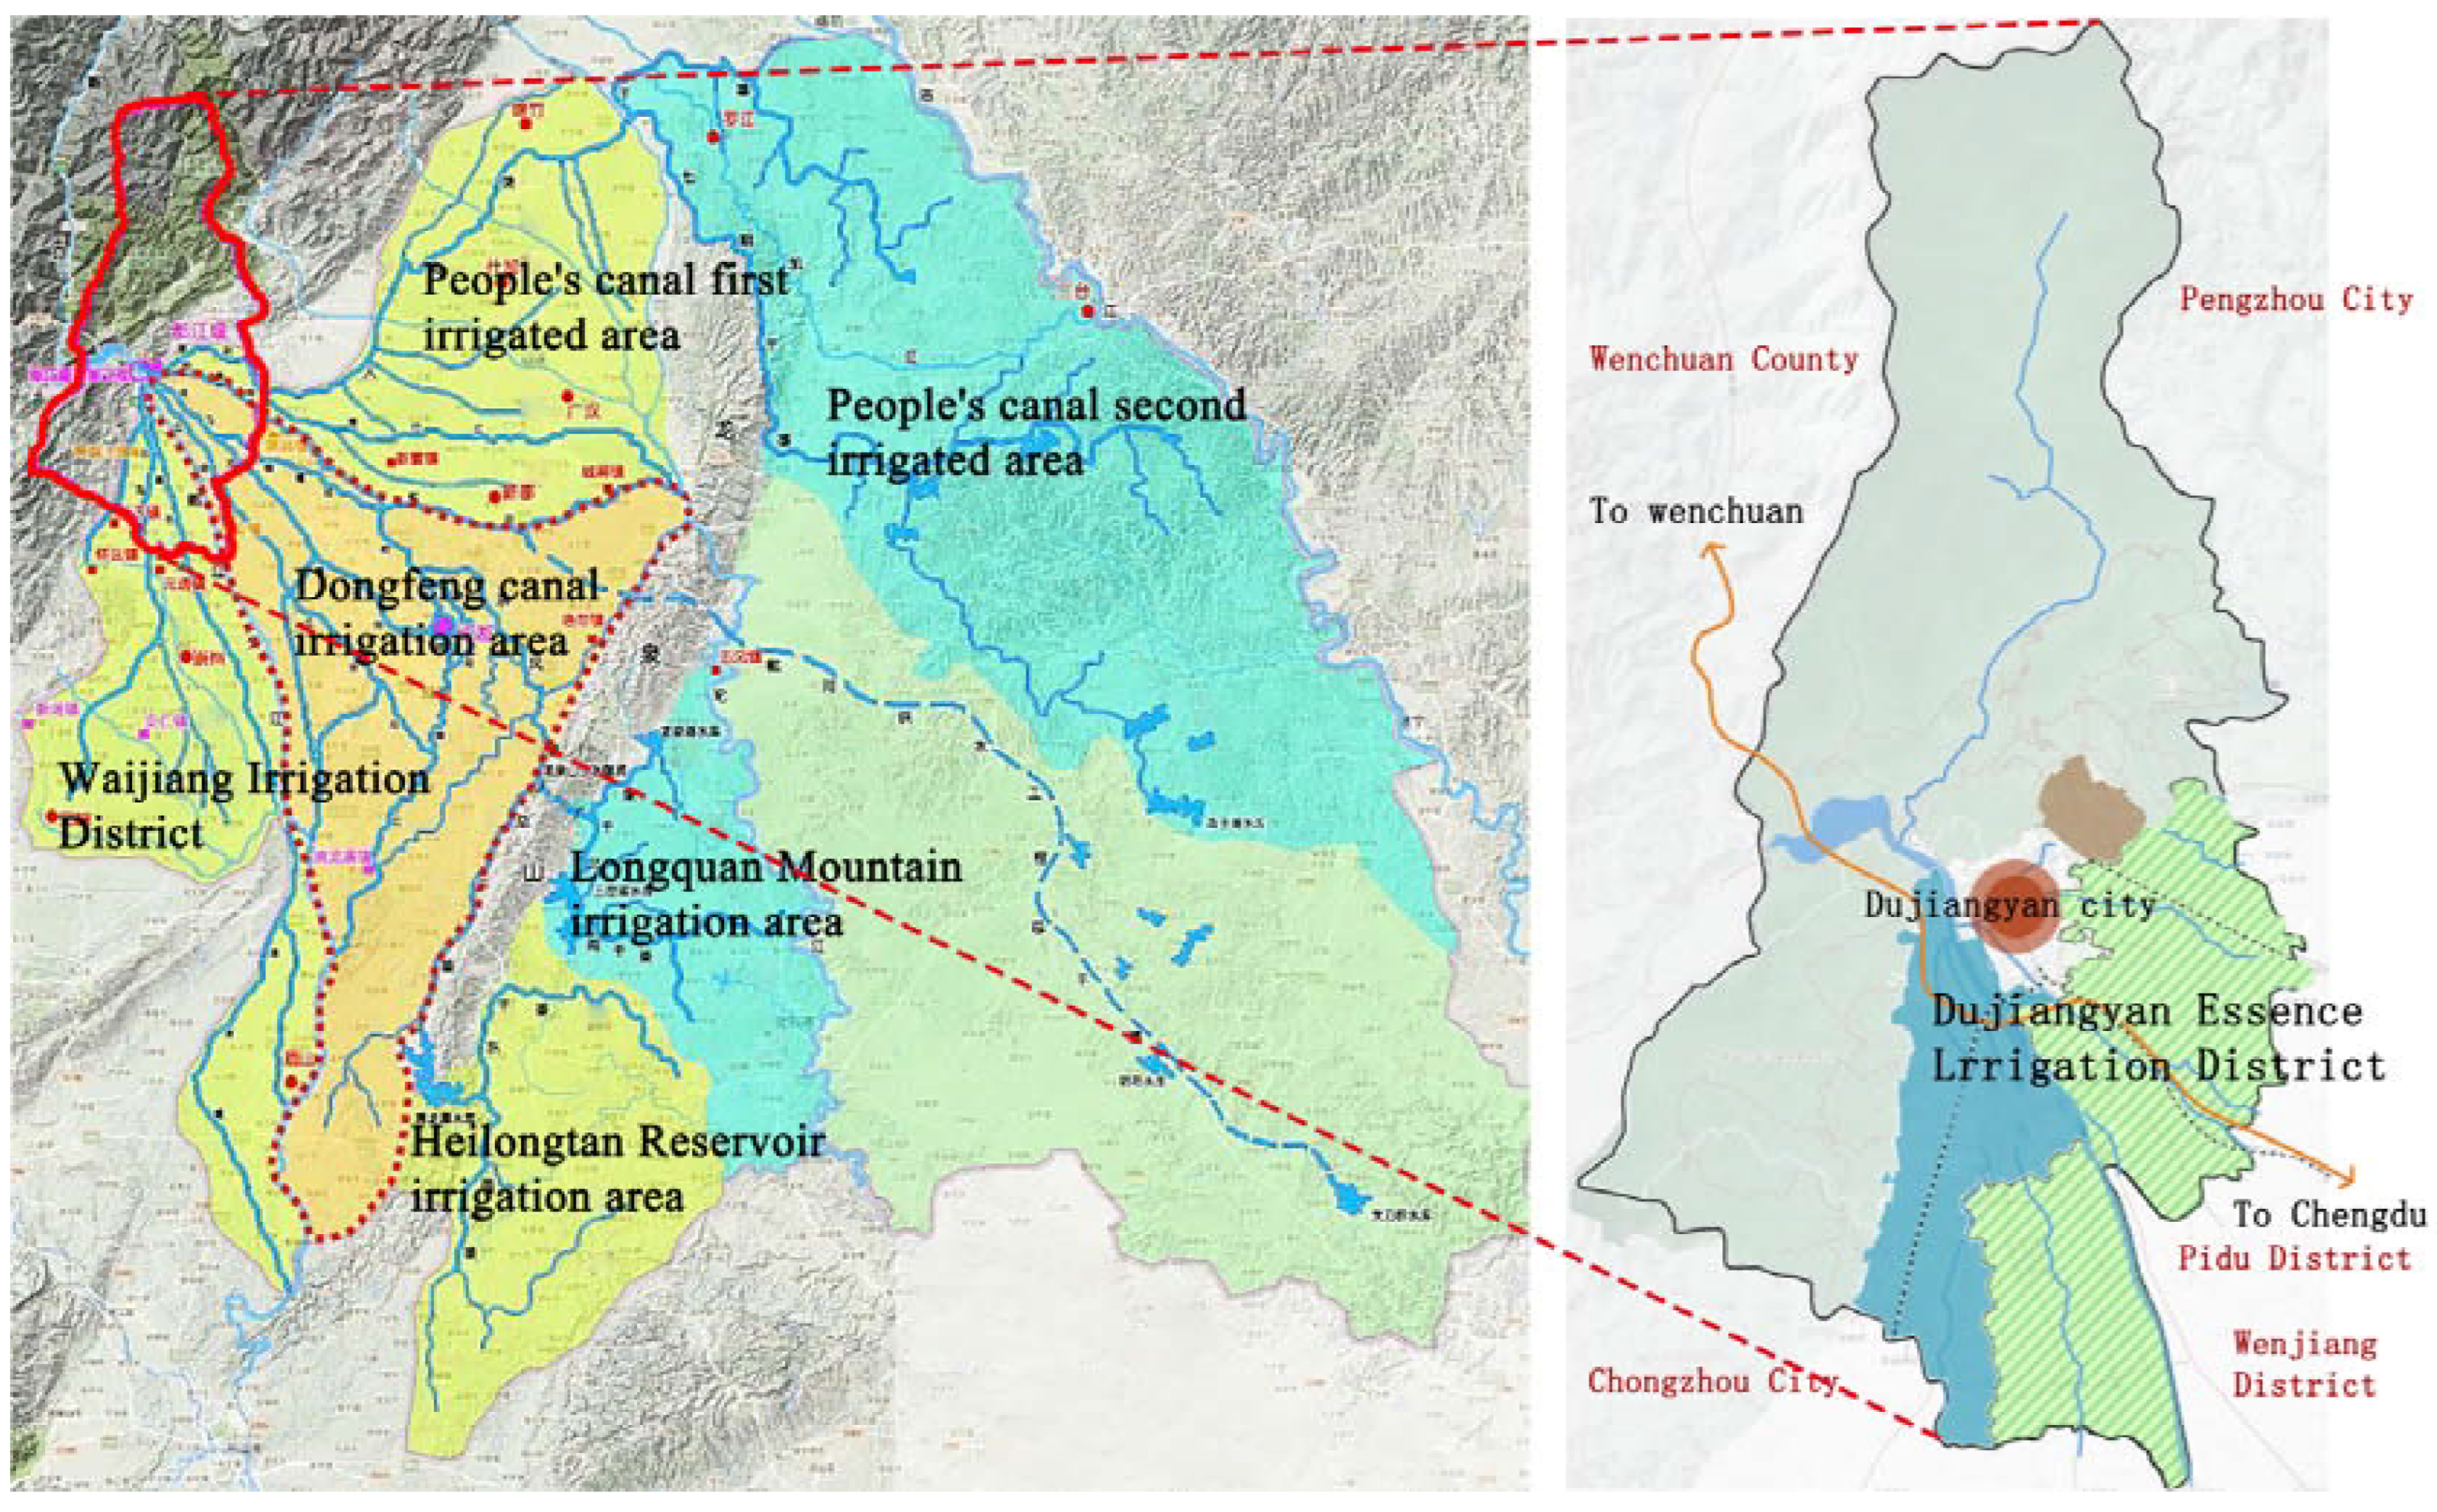
2.1. Geological and Geographic Setting

Dujiangyan City is located west of Chengdu, the capital of China’s Sichuan Province. It received its name from the world famous Dujiangyan Irrigation System. The Dujiangyan Irrigation System is one of the few world heritage sites and falls under main categories: World Natural Heritage, World Cultural Heritage and World Irrigation Engineering Heritage. Its water conservancy culture enjoys a strong reputation worldwide. The irrigation area affected by the Dujiangyan Irrigation System exceeds 7100 km2. Approximately 254 km2 of land in the eastern plains area of Dujiangyan City, which is close to the Dujiangyan Irrigation System, is located in the core area of the Dujiangyan Irrigation District (30°44′–31°02′ N, 103°0′–103°47′ E). The area has the geomorphological characteristics of a typical plain irrigation area and was selected as the scope of the study in this paper. The region covers 3 towns (including Juyuan, Tianma, and Shiyang, plus a total of 80 villages) with a total population of 242,100. This area is an important implementation area of the rural revitalization strategy of Chengdu. By choosing this area as the research scope of this paper, we had a clear understanding of how the landscape space should be protected and utilized under the background of the rural revitalization strategy (Figure 1).

2.2. Data Source and Preprocessing

2.2.1. Sorting and Meshing of Open Street Map (OSM) Data

As a skeleton network of a geographic space, the closed-loop unit formed by roads constitutes the boundary of landscape spatial patches [18]. This study was based on the OSM (https://www.openstreetmap.org/, accessed on 8 July 2021) division of data space units. OSM data constitute a free and easily accessible digital map resource with high positioning accuracy and topological relationships. The data contain basic spatial information such as longitudes and latitudes, as well as attribute information such as road name, road types and maximum driving speeds. During the process of dividing the spatial units of the Dujiangyan Irrigation District, considering the dense water network in the quintessential region, only taking roads as the basis of unit division may result in functional areas being combined with water systems; therefore, the water network was also taken as the basis of unit division. First, the data were converted into the projected coordinate system of WGS_1984_UTM_Zone_48N. Second, the broken roads and open roads in the data were extended and connected. Duplicate roads and roads less than 100 m in length were deleted, and the roads between villages that were less represented the OSM data were supplemented. The roads were sorted into 5 grades (Figure 2a). Finally, buffer zones of 40 m, 25 m, 15 m, 7 m and 3.5 m were generated for the OSM routes according to the road widths to establish road spaces. Ultimately, 4730 research units were formed (Figure 2b).

2.2.2. Processing Approach for Remote Sensing Data

The data source of this study was selected through the geospatial data cloud, which is located in the computer network information center of the Chinese Academy of Sciences (http://www.gscloud.cn/, accessed on 8 July 2021). A period with good plant growth and low cloudiness conditions, specifically, the 28 July 2020, Landsat 8 OLI-TIRS image (no. 129-039) scene, was chosen as the interpretation data source (Table 1). Due to the high similarity between the signs used to interpret construction lands, this paper classified the remote sensing images into nondevelopment land and construction land according to the associated land use attributes. Remote sensing data are only used to identify nondevelopment land, mainly including agricultural land (paddy fields and dry field), ecological functional land (mainly forests, garden land, and areas with no grassland), water areas (water systems and wetlands) and other functional elements.
The original remote sensing effects, which possessed geometric and atmospheric errors, could cause data distortion in space. In this study, Erdas Imagine software was first used for geometric correction; the errors in remote sensing images were reduced to less than 1 pixel by selecting ground object control points for multiple corrections, and the projection coordinate system was unified [19]. Then, ENVI software was used for atmospheric correction, and radiation correction was completed by retrieving the true reflectance levels of the ground objects and constructing a remote sensing band and a visible light recognition system. The remote sensing images were trimmed according to the study area, and remote sensing data fusion was completed [20]. Finally, direct signs such as shapes, sizes, shadows and texture patterns and others, and indirect signs for roads, topographies, and environments were used to establish an interpretation sign database [21]. The human–machine interactive interpretation method was selected; the classification process was supervised by a support vector machine; and spectral analysis, texture feature analysis and geomorphic feature analysis were applied. After performing repeated visual adjustments of the interpreted sign samples, remote sensing information interpretation was completed by integrating the above steps (Table 1).
By constructing a confusion matrix, the discrete multivariate technique was used to test the consistency of the classification results [22]. The kappa coefficient of the regional remote sensing results was 81.43%. The classification drawings were further compared with the land use and planning drawings to complete a longitude test. Finally, Erdas was used to encode the final results. The patches that were too tiny and could not be clearly expressed in the drawings were merged according to the principle of proximity, and the land use sketches interpreted by remote sensing were obtained.

2.2.3. Processing Approach for Point of Interest (POI) Data

POI data have the highest frequency of use and the widest spread range among the various types of geospatial big data. They contain classification information such as names, categories, and coordinates. The POI data source of this study was Amap (https://lbs.amap.com/, accessed on 27 May 2021), which has the highest degree of openness in China and a rapidly updated data volume. Web Crawler was used to capture the POI data of Dujiangyan City in 2020, and the original data covered 14 data types, such as companies, shopping services and life services. First, the original data were obtained from Amap, and the Mars coordinate system (gcj-02) with a coordinate offset was unified with the data coordinates of this study. Second, based on the urban and rural land classification and the existing POI classification method, the POI of Dujiangyan from Amap were divided into 6 categories, and the data were sorted according to the spatial scope of the Dujiangyan Irrigation District [23] (Table 2). POI data are spatial data that ignore geographic spatial entities and are represented in the form of information points; because this study was located in the countryside, the amount of utilized data was small. Therefore, considering the relationship between the POI data volume and the functional site area, the data were normalized [24]. After calculating the kernel density of the POI data in ArcGIS, the kernel density value was mapped to the numerical interval of [0,1] for convenience in the subsequent analysis.

2.3. Research Methods

2.3.1. Kernel Density Estimation (KDE) and Euclidean Distance

Due to the unevenness of the spatial distribution and POI data distribution enclosed by streets, the mean value of each research unit needs to be calculated; therefore, this study applies the kernel density function. The kernel density function is a nonparametric method for estimating the probability density function of a random variable [25,26]. In this study, kernel density was used to estimate the spatial distribution of POIs by density, and the average density values in the unit are calculated by superposition with spatial units. The specific expression is as follows:
f ( s ) = i = 1 n 1 h 2 k ( s c i h )
In this formula, f(s) is the kernel density calculation function in space s, h is the distance attenuation threshold (bandwidth), n is the number of elements whose distance from position s are less than or equal to h, k is the spatial weight function and ci is the core element.
Existing studies have shown that the selection of the bandwidth h has a great impact on the results of a kernel density analysis. The larger the bandwidth is, the more efficient and precise the identification of large-scale sites, but the more likely it is that performance is weakened with respect to identifying the detailed features of the site. With a smaller bandwidth, the data exhibit local prominence and fragmentation, which is suitable for the detailed expression of a small range of sites. Therefore, a bandwidth that represents a reasonable distance interval can keep the density center stable [27,28]. The Euclidean distance refers to the natural length of a vector in space, namely, the actual distance between two points. In this study, Euclidean distance was used to calculate the bandwidth of POI data. The specific expression is as follows:
S i = 1 m j = 1 m ( x j x i σ i ) 2
In this formula, Si is the similarity value (best fitting bandwidth) between two training samples of POI data in class i, including two statistical parameters: the mean value and the standard deviation. and xi are the mean and standard deviation of the class i training samples, respectively, m is the total number of types and xj represents the mean kernel density of the POI data unit of class j.
A small amount of POI data is contained in the research area. Through several experiments, a bandwidth threshold of [1500 m, 2000 m] and pixel values within 100 m were selected to analyze the regional spatial function, as this threshold could better represent the distribution region and characteristics of the POIs.

2.3.2. Frequency Density (FD) Vector

In the analysis process of this study, an FD vector of POI data was constructed for each spatial unit. The ArcGIS platform was used to assign the number of each type of POI in the unit needed to obtain the corresponding frequency density. The formula is as follows:
F i = n i N i ( i = 1 , 2 , , 6 )
where i represents the POI type and ni represents the number of POIs of type i. In the unit, Ni represents the total number of POIs of this type, and Fi represents the frequency density regarding the total number of POIs of type i.

2.3.3. Category Ratio (CR) Vector

After the normalization of POI data, a CR vector of POI data was constructed, and the specific expression is as follows:
C i = F i i = 1 6 F i × 100 % , i = 1 , 2 , , 6
In this formula, Ci represents the ratio of the frequency density (Fi) of type i POIs to all types of POIs in the cell, and thus, the diversity index and the proportion of each type of POI in the spatial unit are obtained to identify the mixed-use functional areas [29].

2.3.4. Location Entropy

Location entropy is an important method for measuring the spatial distribution of regional elements, where entropy expresses the possible degree of some material system states. This method can reflect the status and aggregation level of each element in space. In this study, the location entropy index was adopted to reflect the dominance degree of functional elements in different regions. The calculation formula is as follows:
L Q i j = q i j q j q i q
In this formula, LQij is the location entropy of function i in region j, and the higher its value is, the greater the development of this type of element in the region is. qij is the area index of function i in region j, qj is the area of region j, qi refers to the area of function type i in the region and the q at the bottom is the area of the whole study region. The aggregation degree, the dispersion of the dominant function and its distribution in each stage can be analyzed.

2.3.5. Nearest Neighbor Index (NNI)

To analyze the similarity between adjacent elements, this paper selected the mean nearest neighbor distance. The principle of this method is to first estimate the average distance of a random distribution of elements in a limited area, calculate the distance and average value between the actual centroid of each element and the centroid of the nearest neighbor element, compare it with the average distance in the assumed random distribution, and obtain NNI. In this way, whether the distribution of spatial point data represents a cluster can be determined [30].
N N I = i = 1 n d i N 0.5 A / N
In this formula, di is the distance between point i and its nearest element, N is the number of sample points, and A is the area of the study region. When the NNI is less than 1, the sample points are clustered. When the NNI is greater than 1, the sample points exhibit a discrete uniform distribution. When the NNI is equal to 1, the sample points are randomly distributed.

2.3.6. Spatial Autocorrelation

In this research, Moran’s index was used in the spatial autocorrelation analysis to assess the overall trend in the spatial correlations of the unit attribute values of adjacent or proximate regions in the whole study area. The calculation formula is as follows:
M = i = 1 n j = 1 n W i j ( x i x ¯ ) ( x j x ¯ ) S 2 i = 1 n j = 1 n W i j
In this formula, n is the number of research objects; xi and xj represent the attribute values of spatial units i and j, respectively; Wij is the spatial weight matrix; S2 is the variance in the observed values; and ?x is the average of the observed values. The value of M is between −1 and 1; when M > 0, there is positive spatial correlation is present, and the larger the value is, the greater the degree of agglomeration. When M < 0, the spatial correlation is negative, and the smaller the negative correlation is, the stronger it is. M = 0 means that the space is not correlated representing an independent random distribution.

2.4. Research Framework

Based on the above data and methods, the research framework was as follows: (1) Data preprocessing involved laying the research foundation by determining the research units and fusing remote sensing data with POI classification data. (2) Regional function identification entailed establishing a classification paradigm based on functional feature indices and identifying the global functions. (3) Spatial structure analysis involved clarifying the distributional characteristics and internal attributes of the data and analyzing the current issues faced by the functional structure. (4) An optimization approach was devised through the above analysis; an optimization and adjustment strategy was proposed for the current space. The workflow is as follows (Figure 3).

3. Results

3.1. Classification Results and Accuracy Verification

3.1.1. Classification Results

Based on the statistical data of road grids, the functional identification labels of the region in this research were divided into two categories: land for construction (identified by POI data) and nondevelopment land (identified by remote sensing data). The land for construction included 5 functions, including transportation (the area dedicated to public transportation stations could be ignored, so it was not included in the function identification process), public service, industrial, business and residential lands, and could be divided into location and density types according to the associated POI attribute characteristics (Figure 4). Nondevelopment land was also identified as representing one of five functions: water areas, agricultural areas, ecological land, recreation land and unused land. The function type with the highest proportion was defined as the dominant function of the region; this was determined by ranking the proportions of every function in each region and dividing the area into 10 subfunctional areas. The land for construction included 1227 plots (total area: 30.58 km2; accounted for 12.11% of the total), which were distributed in point form within the region. Nondevelopment land was the most extensive land type in the region and included 3503 plots (total area: 223.42 km2; accounted for 87.89% of the total), which were mainly concentrated in the central and western regions (Table 3).

3.1.2. Accuracy Verification

In this study, the true value of the confusion matrix was chosen from the land use plans, satellite images and field survey data of the Dujiangyan Irrigation District. First, in the function recognition results, 200 precisely determined evaluation points were randomly selected, and preliminary verification was simultaneously conducted by means of contrast in the two-dimensional artificial visual plane to address the difficult task of identifying industrial, commercial and other public services sites to verify the function of each type of construction land. After inputting the data, a confusion matrix was established to evaluate the classification results (Table 4).
The producer accuracy, user accuracy and overall accuracy of the whole region were maintained at high levels, and the classification accuracy (kappa coefficient) reached 76.57%. The land use function identification method based on POI and remote sensing data proposed study was considered to have good accuracy.

3.1.3. Analysis of the Coordination of the Functional Space Layout

By comparing the function identification results with the land use drawings used to ensure precision, it was found that although the regional development scale was beyond the preplanned scope, on the whole, it was essentially the same. In terms of undeveloped land, the ecological functional space expanded greatly after consolidation of the new urbanization and construction land, increasing by 3.59%. In terms of land for construction, the public service and industrial spaces increased in the study area, but the total proportion was still significantly small. Surprisingly, the residential functional area decreased in the functional identification results, with a difference of −10.28%.

3.2. Analysis of the Mixed-Use Functional Areas

The mixing of urban and rural spatial functions promotes connections between functional elements, brings vitality to the region and improves the comprehensive strength of the associated urban and rural areas. A CR vector was used to take 50% of the data as the dividing line. When the proportion of a certain type in the cell was higher than 50%, the functional composition of that cell was relatively unified, and so it was determined to be a single functional area and visualized as light blue. When all types in the cell had proportions that were less than 50%, the functional diversity in the cell was strong, and it was judged to be a mixed functional zone and visualized as dark blue. When no POI data were present in the cell, the visualization was transparent [31] (Figure 5). As seen from the figure, single-functional areas were most widely distributed (accounting for 68.4% of the total) in the region and were mainly located in the central and southern regions. Mixed functional areas, which were mainly located in Juyuan and Tianma in central China, were the second-most common type (accounting for 29.3% of the total), and the proportion of areas with no data was the smallest at only 2.1%.

3.3. Composite Analysis of the Functional Spaces

The current spatial structure and differentiation characteristics of different functional elements are the embodiment of district functional composites. They are mainly manifested in the spatial distributions and proportional relationships of urban and rural functions, and which represents the control of the overall urban and rural structure. Because the undeveloped land is relatively concentrated and contiguously connected with little manual intervention, and the large regional transportation facilities (railway stations) are unique, they were not included in the spatial composite analysis. Therefore, this work mainly analyzed the four aspects of public services, industrial, business and residential functions in construction land at different scales (Table 5).
From the measurement results of regarding the locational entropy values at the town scale, the locational entropy values of Juyuan and Tianma were higher overall than that of Shiyang, which indicated the clustering of superior functions. Among them, Juyuan had obvious advantages in the industrial and residential functions, while Tianma and Shiyang had obvious advantages in terms of the public services functions.

3.4. Multielement Analysis of the Functional Spaces

Functional space factor analysis can clearly recognize function distribution of area funcitons. This research used the hot spot tool of ArcGIS to analyze the effects of human activity. The largest function of the aggregation degree, in addition to the four functions in a spatial distribution, was a more balanced public service function. The other functions are mainly distributed in the town north of Juyuan, the Tianma town area; Shiyang was distributed discretely and mostly concentrated at the edge of town, without obvious centrality and circle patterns (Figure 6).

3.4.1. Public Service Space

The public service space integrates many essential urban and rural development functions, showing the level of urban and rural development in a region. The spatial distribution of public services in Dujiangyan Irrigation District is relatively balanced, where which Juyuan, Tianma and Shiyang account for 34.52%, 30.20% and 35.28% of the total, respectively. Through ArcGIS spatial analysis, the regional NNI = 0.317 (Z = −36.7012), so the possibility of clustering the model was less than 1%. To further explore the distribution characteristics of agglomeration or dispersion within the commercial space, this study used the spatial autocorrelation analysis method, and the regional Moran’s I = 0.1924 (Z = 33.5905), indicating that the distribution of POI points in the commercial space presented a positive spatial correlation. That is, the public service function presented a spatially discrete distribution.

3.4.2. Industrial Space

The development of urban and rural spaces cannot be separated from the supply of industry, and industrial spaces maintains regional economic vitality. The commercial density in the research area was low; 50% of the density was located in Juyuan. After calculation, the regional NNI = 0.8649 (Z = −1.5714), so there was no significant difference from the random distribution pattern. Moran’s I = 0.0155 (Z = 2.7982), and the probability of a discrete mode was less than 1%, indicating that the distribution of POI points in the commercial space presented a positive spatial correlation, and the POI points presented a spatially aggregated distribution.

3.4.3. Commercial Space

Commercial space is one of the main functions of urban and rural areas. It is a dynamic space integrating leisure and entertainment, catering and shopping, as well as an important place for gathering people to gather. The spatial distribution of commerce in the research area was relatively balanced, and the area proportions from high to low were Juyuan (45.02%), Shiyang (27.55%) and Tianma (27.43%). According to the calculation results, the regional NNI = 0.3438 (Z = −36.1418). Moran’s I = 0.0155 (Z = 2.7982); therefore, the probability of randomly generating business functional zone clusters was not higher than 1%, indicating that the distribution of POI points in the commercial space presented a positive spatial correlation; that is, the commercial functional zone presented a discrete spatial distribution.

3.4.4. Residential Space

Residential space is an important part of the urban and rural spatial structures, that provides social functions such as living and population gathering. With the acceleration of the urbanization process, traditional rural settlements are gradually being replaced by a new large-scale and intensive rural society. The proportions of the three towns from high to low were Juyuan town (43.86%), Tianma town (33.33%) and Shiyang town (22.81%). The regional NNI = 0.6515 (Z = −5.0322). Moran’s I = 0.0622 (Z = 11.0294); therefore, the probability of randomly generating commercial functional zone clusters was not higher than 1%, indicating that the distribution of POI points in the commercial space presented a positive spatial correlation; that is, the commercial functional zone presented a discrete spatial distribution.

4. Discussion

4.1. Application of Big Data to the Analysis of Rural Space

4.1.1. Improving the Accuracy of the Recognition Results

Big data, as a new type of data resource, offers higher identification accuracy than small samples. In addition, multisource data can be combined to compensate for the disadvantages of traditional spatial function recognition methods. In this study, big data from various sources were combined to carry out spatial function research. In general, the spatial identification results of nondevelopment land functions and land for construction functions (such as industrial, recreational and public service functions) were good, but there were some problems with identifying residential functions. In general, spatial function recognition based on big data was found to have high accuracy and is highly feasible.

4.1.2. Limitations of Big Data Applications

The results showed that the spatial distribution of residential spaces in the land use planning map was quite different from that in the recognition results of regional residential functions. The reasons for this finding can be explained as follows. Most of the agricultural houses in the region were distributed in small-scale and scattered patterns, which were integrated with the surrounding forestland, rivers and cultivated land without forming independent spatial units [32]. As a result, the agricultural houses occupied a relatively small proportion of the spatial unit compared with other functions and did form dominant functions, so they were not identified. Second, limited by POI data, traditional dwellings scattered in agricultural and ecological function zones could not be identified, which is also a limitation of the early application of big data. At the same time, urban residential and commercial functions were seriously confused.

4.2. Functional Space Analysis of the Dujiangyan Irrigation District

4.2.1. Functional Space for Modern Planning and Layout Development

With the construction of modern water supply facilities, urban and rural development is no longer restricted by hydrological conditions, and the spread of diversified transportation network systems has created favorable conditions for the location of cities and towns [33]. With the gradual improvement in the composite degree of functional space in the region, the boundary between construction land and nondevelopment land has becomes clearer. This study found that the commercial and residential functional spaces were gathered in the town center, and public services and business functional spaces deviated from the original drainage region, demonstrating the means for the growth in the urban space and clearly showing the linear structure of the road distribution. Lin Pan in western Sichuan Province is a main body with strong local characteristics and a gradual decline in the rural landscape [34]. After land consolidation, nondevelopment land, such as land with agricultural and ecological functions, developed contiguously and gradually formed a large-scale and clustered spatial distribution pattern of rural functions.

4.2.2. Rural Functional Quality Is Still Inadequate

The development of the town brought a variety of functions that gradually developed it into a very dynamic, complex space [35]. The overall degree to which existing spatial functions in the region are mixed is low, and there are great differences between the towns. Juyuan and Tianma have high degrees of mixing in their spatial functions, while Shiyang has a single function. This functional imbalance makes regional resources unequal, and the development patterns of various towns have also been distinct. In terms of the aggregation of functional spaces, the functional spaces of all land for construction except industrial space are discretely distributed, and there is no obvious central agglomeration, indicating that the main cities and towns in the region have not attracted urban agglomeration.

4.3. Implications for the Development of the Dujiangyan Irrigation District

This study identified the functional spaces in the Dujiangyan Irrigation District and found that the regional functional spaces exhibit insufficient quality and quantity. Among them, commercial, residential and transportation facilities are still not perfect, which makes it inconvenient to live in the region. At the same time, although the amount of recreational space has increased to a certain extent, these areas are still scattered and unable to meet the growing needs of residents, which is also an inevitable problem encountered during the development periods of most villages [36]. In terms of functional structure, the “Master Plan of Dujiangyan Irrigation District” proposed a spatial structure with Juyuan as the main center and Tianma and Shiyang as the subcenters. However, in the actual situation, although Juyuan and Tianma have high degrees of spatial function mixing, Shiyang’s function is extremely singular; the town’s function has not reached its development expectation, and the development of its regional spatial function has been relatively unbalanced. How can regional functions be coordinated to regional production and living conditions be improved? This is a problem that must be solved in the process of regional development.
Regarding the future development of the Dujiangyan Jinghua irrigation area, it will be necessary to carry out comprehensive regional spatial sorting, guide the integration of functional elements, and realize the optimization of spatial resource allocation. At the same time, we should aim to build a 15-min “life circle”, strengthen the functional centrality of the main towns, enhance the degree of functional land compounding in the central towns, and realize the high aggregation of urban functions. Through high functional towns, radiation effects have gathered in surrounding villages, driving the development of the surrounding area.

5. Conclusions and Prospects

5.1. Conclusions

This research used big data to obtain a new perspective for analyzing the spatial functions of the Dujiangyan Irrigation District, piloting the use of POI data for rural functional spaces, and significantly improving the breadth and accuracy of rural space feature type identification. From the macro level to the medium level, the functions of the urban and rural spatial structure and different complex situations were described, the response characteristics of the different functional elements in the spaces were discussed, and the following main conclusions were obtained: (1) Big data can greatly improve the accuracy of spatial function recognition, but the research on rural spaces has limitations regarding the amount of available data. (2) The agricultural and ecological functions of nonconstruction land in the functional spaces examined by the study area have modern agricultural forms, but the functions of construction land are relatively discrete, the degree of spatial aggregation is low, and the spaces are mainly distributed linearly along roads. (3) The mixing degree of the regional functional spaces is low, the connections between functional elements are insufficient, and problems such as unbalanced functional development and imperfect functional facilities remain, resulting in significant functional differences and low comprehensive quality between different cities and towns. The degrees of composition for various functions in the region are high, and the composite functional areas of various spatial units have become the main manifestations of the region, especially the composition phenomena of residential spaces and other functional spaces. However, except in industrial spaces, functional space aggregation is distributed discretely.
Based on the quantitative identification results of functional spaces and a status analysis of these spaces, strategies and suggestions for the future development of the functional spaces in the Jinghua irrigation area of Dujiangyan were proposed to provide improvement policies and scientific guidance for future regional development. It was suggested that the future functional layout of the region should integrate functional elements, optimize the allocation of spatial resources, and improve the livability of the region. In terms of functional structure, the centrality of towns should be strengthened to promote the development of the surrounding nonurban areas.

5.2. Research Deficiencies and Prospects

(1)
Due to the geographical locations of rural areas, the amount of data in rural areas is different from that in urban areas. As a result, some residential functional spaces could not be identified in this study. Resolving this difference to more accurately express rural space is a problem that needs to be considered in subsequent research.
(2)
In cities and towns, business is usually mixed with public services and residential functions and is presented in the form of residential-based business, resulting in data overlap and low P accuracy when identifying residential functions. Follow-up research can identify urban and rural functional areas by selecting appropriate clustering algorithms or weighting forms, analyzing and comparing the advantages and disadvantages of various algorithms, and increasing the accuracy of data expression.
(3)
The spatial function research data in this study were mainly static data, with inadequate elaborations regarding the inherent spatial and spatiotemporal relationships, a lack of dynamic expressions for spatial functions, and an inability to precisely express the changes in urban and rural development from the perspective of historical evolution. In subsequent research work, multidimensional spatiotemporal data can be used to realize the dynamic expression of a functional space by analyzing its development context.

Author Contributions

Conceptualization, Q.D. and J.C.; methodology, Q.D.; software, Q.D.; formal analysis, L.W.; investigation, L.W.; resources, D.L.; data curation, D.L.; writing—original draft preparation, Q.D.; writing—review and editing, J.C. and Q.C.; visualization, D.L.; supervision, Q.C. All authors have read and agreed to the published version of the manuscript.

Funding

(1) Breakthrough bamboo and flower breeding materials and method innovation and new varietu breeding (breeding research projuect), 2021yfyz0006; (2) Research project on industrial integration and innovation of beautiful bamboo forest scenic spot, T202101.

Data Availability Statement

The data presented in this study are available on request from the corresponding author. The data are not publicly available due to privacy.

Conflicts of Interest

The authors declare no conflict of interest.

References

  1. Shan, Z.R.; Huang, Y.P. An analysis of the concept, goals, contents, planning strategies and misunderstandings of new urbanization. Urban Plan. Forum 2013, 2, 16–22. [Google Scholar]
  2. Gu, Y.; Jiao, L.; Dong, T.; Wang, Y.; Xu, G. Spatial Distribution and Interaction Analysis of Urban Functional Areas Based on Multi-source Data. Geomat. Inf. Sci. Wuhan Univ. 2018, 43, 1113–1121. [Google Scholar]
  3. Zhong, T.; Lü, G.; Zhong, X.; Tang, H.; Ye, Y. Measuring Human-Scale Living Convenience through Multi-Sourced Urban Data and a Geodesign Approach: Buildings as Analytical Units. Sustainability 2020, 12, 4712. [Google Scholar] [CrossRef]
  4. Holmes, J. Impulses towards a multifunctional transition in rural Australia: Gaps in the research agenda. J. Rural Stud. 2006, 22, 142–160. [Google Scholar] [CrossRef]
  5. Holmes, J. Cape York Peninsula, Australia: A frontier region undergoing a multifunctional transition with indigenous engagement. J. Rural Stud. 2012, 28, 252–265. [Google Scholar] [CrossRef]
  6. Willemen, L.; Hein, L.; van Mensvoort, M.E.F.; Verburg, P.H. Space for people, plants, and livestock? Quantifying interactions among multiple landscape functions in a Dutch rural region. Ecol. Indic. 2010, 10, 62–73. [Google Scholar] [CrossRef]
  7. Marques-Perez, l.; Segura, B.; Maroto, C. Evaluating the functionality of agricultural systems: Social preferences for multifunctional peri-urban agriculture. The “Huerta de Valencia” as case study. Span. J. Agric. Res. 2014, 12, 889–901. [Google Scholar] [CrossRef] [Green Version]
  8. Li, Y.N. The Reform ofthe Rural-Urban Dualism. J. Peking Univ. 2008, 2, 5–11. [Google Scholar]
  9. Liu, Y.S.; Liu, Y.; Chen, Y.F. Regional multifunctional evaluation and its decision-making mechanism in China. Acta Geogr. Sin. 2011, 10, 1379–1389. [Google Scholar]
  10. Liu, Y.; Liu, Y.S. Progress and Prospect in the Study of Rural Region Multifunctions. China Popul. Resour. Environ. 2012, 10, 164–169. [Google Scholar]
  11. Long, H.L. The theory of land reclamation and rural space reconstruction. Acta Geogr. Sin. 2013, 8, 1019–1028. [Google Scholar]
  12. Soto, V.; Frías-Martíne, E. Automated land use identification using cell-phone records. ACM 2011, 17–22. [Google Scholar] [CrossRef] [Green Version]
  13. Becker, R.A.; Caceres, R.; Hanson, K.; Loh, J.M.; Urbanek, S.; Varshavsky, A.; Volinsky, C. A tale of one city: Using cellular network data for urban planning. IEEE Pervasive Comput. 2011, 10, 18–26. [Google Scholar] [CrossRef]
  14. Estima, J.; Painho, M. Investigating the Potential of OpenStreetMap for Land Use/Land Cover Production: A Case Study for Continental Portugal. In OpenStreetMap in GIScience; Springer: Berlin/Heidelberg, Germany, 2015; pp. 273–293. [Google Scholar]
  15. Long, Y.; Shen, Z. Geospatial Analysis to Support Urban Planning in Beijing; Springer: Berlin/Heidelberg, Germany, 2015; pp. 169–192. [Google Scholar]
  16. Chen, S.; Tao, H.; Li, X.; Zhuo, L. Discovering urban functional regions using latent semantic information: Spatiotemporal data mining of floating cars GPS data of Guangzhou. Acta Geogr. Sin. 2016, 3, 471–483. [Google Scholar] [CrossRef]
  17. Pan, G.; Qi, G.; Wu, Z.; Zhang, D.; Li, S. Land-use classification using taxi gps traces. IEEE Trans. Intell. Transp. Syst. 2013, 14, 113–123. [Google Scholar] [CrossRef]
  18. Liu, X.; Long, Y. Automated identification and characterization of parcels with OpenStreetMap and points of interest. Environ. Plan. B Plan. Des. 2016, 43, 341–360. [Google Scholar] [CrossRef]
  19. Zou, B.X.; Meng, B. Application of two teaching methods in remote sensing image correction teaching. Geospat. Inf. 2017, 12, 108–110. [Google Scholar] [CrossRef]
  20. Li, Z.Q.; Chen, X.; Ma, Y.; Qie, L.; Hou, W.; Qiao, Y. An overview of atmospheric correction for optical remote sensing satellites. J. Nanjing Univ. Inf. Sci. Technol. (Nat. Sci. Ed.) 2018, 1, 6–15. [Google Scholar]
  21. Chen, X.N.; Wu, M.Y.; Wen, J.B.; Chen, H. Research on the Establishment of Remote Sensing Interpretation Marks. Geomat. Spat. Inf. Technol. 2017, 2, 35–37. [Google Scholar]
  22. Liang, J.; Wang, J.; Wang, J.H. Study on Automatic Classification and Accuracy Analysis of Remote Sensing Image Based on SAM. Remote Sens. Technol. Appl. 2002, 6, 299–303. [Google Scholar] [CrossRef]
  23. Zhang, L. Research on POI Classification Standard. Bull. Surv. Mapp. 2012, 10, 82–84. [Google Scholar]
  24. Jiang, Y.L.; Dong, M.X.; Fan, J.; Gao, S.; Liu, Y.; Ma, X.Q. Research on identifying urban regions of different functions based on POI data. J. Zhejiang Norm. Univ. (Nat. Sci.) 2017, 04, 398–405. [Google Scholar]
  25. Porta, S.; Strano, E.; Lacoviello, V.; Messora, R.; Latora, V.; Cardillo, A.; Wang, F.; Scellato, S. Street centrality and densities of retail and services in Bologna, Italy. Environ. Plan. 2009, 36, 450–465. [Google Scholar] [CrossRef] [Green Version]
  26. Jalobeanu, A.; Zerubia, J.; Blanc-Féraud, L. Bayesian Estimation of Blur and Noise in Remote Sensing Imaging; Taylor Francis Group: Abingdon, UK; CRC Press: Boca Raton, FL, USA, 2007; pp. 239–275. [Google Scholar]
  27. Heidenreich, N.-B.; Schindler, A.; Sperlich, S. Bandwidth selection for kernel density estimation: A review of fully automatic selectors. AStA Adv. Stat. Anal. 2013, 97, 403–433. [Google Scholar] [CrossRef] [Green Version]
  28. Hinneburg, A.; Keim, D.A. An Efficient Approach to Clustering in Large Multimedia Databases with Noise. Knowing Discov. Data Min. 1999, 98, 58–65. [Google Scholar]
  29. Wang, M. Investigation of remote sensing image and big data analytic for urban garden landscape design and environmental planning. Arab. J. Geosci. 2021, 14, 473. [Google Scholar] [CrossRef]
  30. Lai, C.Q.; Wu, B. A study on spatial distribution characteristics of megacity hotels based on GIS method: A data analysis based on POI data of Guangzhou hotels. Mod. Urban Res. 2019, 8, 66–74. [Google Scholar]
  31. Verma, S.; Kuila, A. Bioremediation of heavy metals by microbial process. Environ. Technol. Innov. 2019, 14. [Google Scholar] [CrossRef]
  32. Wan, A.; Chen, H.; Xie, X.; Liu, Y. Study on the Spatial Layout Features of Linpan in Western Sichuan with the Aid of GIS: A Case Study in Deyuan Town. Wirel. Pers. Commun. 2021, 116, 927–937. [Google Scholar] [CrossRef]
  33. Chaoua, S.; Boussaa, S.; El Gharmali, A.; Boumezzough, A. Impact of irrigation with wastewater on accumulation of heavy metals in soil and crops in the region of Marrakech in Morocco. J. Saudi Soc. Agric. Sci. 2018, 18, 429–436. [Google Scholar] [CrossRef]
  34. Gao, X.Y. Study on the Historical Evolution of Urban Spatial Form in Dujiangyan Irrigation Area. Uraban Planning Society of China. Vitality of Urban and Rural Human Settlements Good—2019 China Urban Planning Workshop (09 Urban Cultural Heritage Protection); China Architecture Building Press: Beijing, China, 2019; pp. 369–378. [Google Scholar]
  35. Li, G.D.; Fang, C.L. Quantitative identification and analysis of urban eco-production-living space function. Acta Geogr. Sin. 2016, 71, 49–65. [Google Scholar]
  36. Zhang, A.; Yang, Y.; Chen, T.; Liu, J.; Hu, Y. Exploration of spatial differentiation patterns and related influencing factors for National Key Villages for rural tourism in China in the context of a rural revitalization strategy, using GIS-based overlay analysis. Arab. J. Geosci. 2021, 14, 83. [Google Scholar] [CrossRef]
Figure 1. The geographical location of the Dujiangyan Irrigation District.
Land 11 00386 g001
Figure 2. Processing approach for the OSM data. (a) Road supplement and grading. (b) Generation of road network unit.
Land 11 00386 g002
Figure 3. Functional space identification process of the Dujiangyan Irrigation District.
Land 11 00386 g003
Figure 4. Results of spatial function recognition.
Land 11 00386 g004
Figure 5. Proportions of mixed-use functional areas.
Land 11 00386 g005
Figure 6. Aggregation of each functional element.
Land 11 00386 g006
Table 1. Assignment of resistance elements.
ClassificationsInterpretation SignsRemote Sensing Image ExamplesEnvironmental Samples
Nondevelopment landAgricultural functional landPaddy fields, dry land, etc. Light green, mostly checkered textures Land 11 00386 i001 Land 11 00386 i002
Ecological functional landWoodlands, gardens, etc. These areas look dark green and dotted Land 11 00386 i003 Land 11 00386 i004
Water areaThese areas look dark blue or black, and their tones are more uniform, with a curved or linear distributions Land 11 00386 i005 Land 11 00386 i006
Land for constructionTransportation facilities, public services, etc. Purple, cyan gray, regular shapes, clear boundaries Land 11 00386 i007 Land 11 00386 i008
Uncultivated landWasteland, abandoned land, etc., Should be distinguished by the auxiliary way of visual interpretation approach Land 11 00386 i009 Land 11 00386 i010
Table 2. POI data types.
Category (Quantity)Subclass
Transportation Function (233)
Public Service Functions (803)
Industrial Functions (38)
Business Services Functions (831)
Residential Functions (57)
Recreational Functions (40)
Bus stations, subway stations, train stations, etc.
Hospitals, schools, government offices, etc.
Factories, industrial parks, etc.
Restaurants, shopping centers, hotels, etc.
Community centers, residential complexes, etc.
National scenic spots, plazas, zoos, etc.
Table 3. Area statistics of each function type.
Function TypeNumber of Plots (Number)Total Area (km2)Area Proportion (%)Average Land Area (km2)
Waters12418.597.32%5.31
Agricultural function1764110.4643.49%0.06
Ecological function183593.536.81%0.05
Transportation function10.240.09%0.24
Public service Function1444.061.60%0.03
Industrial function34311.684.60%0.03
Commercial function1834.781.88%0.03
Residential function3229.823.87%0.03
Recreational function90.470.19%0.07
Unused land20.400.16%0.20
Table 4. Confusion matrix of the functional zone identification results.
Class ValueC0C1C2C3C4C5C6C7C8C9TotalU Accuracy
Waters(C0)5010000100771%
Agricultural functions(C1)063700105007682%
Ecological functions(C2)0114800102006277%
Transportation functions(C3)00010000001100%
Public service Functions(C4)0000150000015100%
Industrial functions(C5)020001001001376%
Commercial functions(C6)00000190001090%
Residential function(C7)002000010001283%
Recreational functions(C8)00000000202100%
Unused lands(C9)00000000022100%
Total5765811513919222000%
P Accuracy100%82%82%100%100%76%100%52%100%100%0%82%
Table 5. Locational entropy values of each functional element.
NamePublic Service FunctionsIndustrial FunctionsCommercial FunctionResidential Function
Juyuan Town0.5572 1.5437 1.0997 1.4304
Tianma Town1.4055 1.3882 1.1777 1.1176
Shiyang Town1.0352 0.2550 0.7790 0.5605
Publisher’s Note: MDPI stays neutral with regard to jurisdictional claims in published maps and institutional affiliations.

