1. Introduction
Pipelines are crucial infrastructure components because they enable the transportation of various substances that are vital for everyday life. Therefore, a pipeline must be able to function properly throughout its entire service life.
Pipelines, either above-ground and underground(buried), can be categorized into different types. Examples include water, sewer, gas, oil, electricity, and communication pipelines, as well as off-shore pipelines, in-plant pipelines, cross-mountain pipelines and others.
In addition, the serviceability of a pipeline depends greatly on its stability. A cracked or fractured sewer pipeline may cause leaking, which will disrupt service and may contaminate the environment as well.
The presence of buried pipes inevitably alters the state of geostatic stress in the ground. The degree of alteration varies with numerous factors, including the shape, size, and stiffness of a pipe, its burial depth, and the stiffness of the surrounding soil. Further investigation of soil pressure distributions is necessary to develop practical design and analysis procedures for buried concrete pipes.
Although several researchers [
1,
2,
3,
4,
5] have conducted laboratory and full-scale field tests to investigate the soil pressure distributions around buried pipes, most experimental studies have focused entirely on backfill materials. Soil pressure distributions are not only affected by backfill materials but also by other environmental conditions, such as the loading type, the presence of a groundwater table, and voids that form around buried pipes. These environmental conditions are not fully considered in existing pipeline analysis procedures.
In addition to experimental studies, several analytical and numerical investigations [
6,
7,
8,
9,
10,
11,
12,
13] have also been conducted. However, the simulations were performed under conditions of a 2D plane strain using elastic models for soil and pipe materials. To analyze the influence of inelastic soil behaviors on the pressure distributions around pipes, the elastoplastic behavior of surrounding soil must be considered.
Therefore, in this study, a nonlinear elastoplastic model for backfill materials was developed to obtain more accurate soil pressure distributions around buried concrete pipes and analyze crack propagation in pipes. The specific objectives of this study can be summarized as follows.
Use an advanced soil model to explore the load-transfer mechanisms through which a buried pipe may benefit from the soil arching effect.
Examine material-specific soil pressure distributions and crack propagation in pipes related to external loading, groundwater tables, and voids.
Derive significant insights based on the simulation results for the environment-related design and analysis of buried concrete pipes.
2. Finite Element Modeling
Three-dimensional finite element modeling was conducted using the commercial finite element software package ABAQUS [
14]. For finite element modeling, a buried concrete pipe was modeled using shell elements (S4R in ABAQUS) and the surrounding soils were modeled as solid elements (C3D8R in ABAQUS).
2.1. Modeling Methodology
A nonlinear elastoplastic model was adopted for the backfill materials to predict the responses of surrounding soils more accurately under various loading conditions. For the nonlinear elastic components, the hyperbolic stress–strain relationship proposed by Duncan and Chang [
15] was adopted. Since material parameters change with material-stress states, an incremental approach was used to approximate nonlinear behaviors as piecewise linear behaviors. During the application of each load increment, the materials were considered to be linearly elastic. However, different tangential elastic moduli were applied according to the changes in stresses at each incremental load. The tangential modulus (
) is defined as follows:
where
Rf is the failure ratio, which normally ranges from 0.7 to 1.0.
Ei is the initial modulus, which is equal to
.
Pa is the atmospheric pressure (101.3 kPa).
K and
n are material constants.
c is the cohesion.
is the friction angle.
and
are the major and minor principal stresses, respectively.
Once the stresses are obtained at each load increment, the tangential modulus can be calculated for any stress state. For the plastic components, the Drucker–Prager yield criterion with a non-associated flow rule was adopted. The Drucker–Prager yield criterion can be expressed in terms of deviatoric stress and hydrostatic stress as follows:
where
s and
p are the deviatoric and hydrostatic stress, respectively,
is the norm of the deviatoric stress, and
and
k are material constants that can be expressed in terms of the friction angle
and cohesion
c of the soil, where
A non-associated flow rule is then applied by defining the plastic potential as follows:
which yields the plastic strain rate
in the following form:
where
.
The plastic strain rate parameter is a positive scalar of proportionality during plastic deformation and the overdot denotes an increment. The aforementioned nonlinear elastoplastic model was implemented in ABAQUS using a user-defined material subroutine called UMAT.
The buried concrete pipe was characterized as a linearly elastic plastic material. A damage model was incorporated into the plastic component, where reinforcement behaviors were modeled by considering the tension stiffening effect. The damage-related failure mechanisms of the concrete (cracking and crushing) cause degradation of the elastic stiffness, as expressed by the following degradation scalar:
where
d is a degradation variable ranging from zero (undamaged) to unity (fully damaged) and
is the initial elastic stiffness. The yield function of the plastic damage model was proposed by Lubliner et al. [
16] and modified by Lee and Fenves [
17]. This modified plastic damage yield function is expressed as a function of the stress and equivalent plastic strain
as follows:
where
and
are dimensionless material constants,
I1 and
J2 are the first invariant stress tensor and second invariant deviatoric stress tensor, respectively, and
and
denote the maximum principal stress and compressive cohesion, respectively. The material constant
can be determined from the initial uniaxial and biaxial compressive yield stresses
and
as follows:
Because the typical values of the ratio
for concrete are in the range of 1.10 to 1.16, the value of
lies between 0.08 and 0.12 [
16]. In this study,
for 0.1 was applied. By applying the initial uniaxial tensile yielding stress
, the function
can be written as
The plastic damage model also adopts the non-associated flow rule. The non-associated flow plastic potential function is defined as follows:
where
is selected to provide suitable dilatancy. Therefore, the plastic strain rate can be written as follows:
In addition, the contact between soil and concrete pipe was considered to examine the soil–pipe interaction with the coulomb friction law.
2.2. Finete Element Mesh and Boundary Conditions
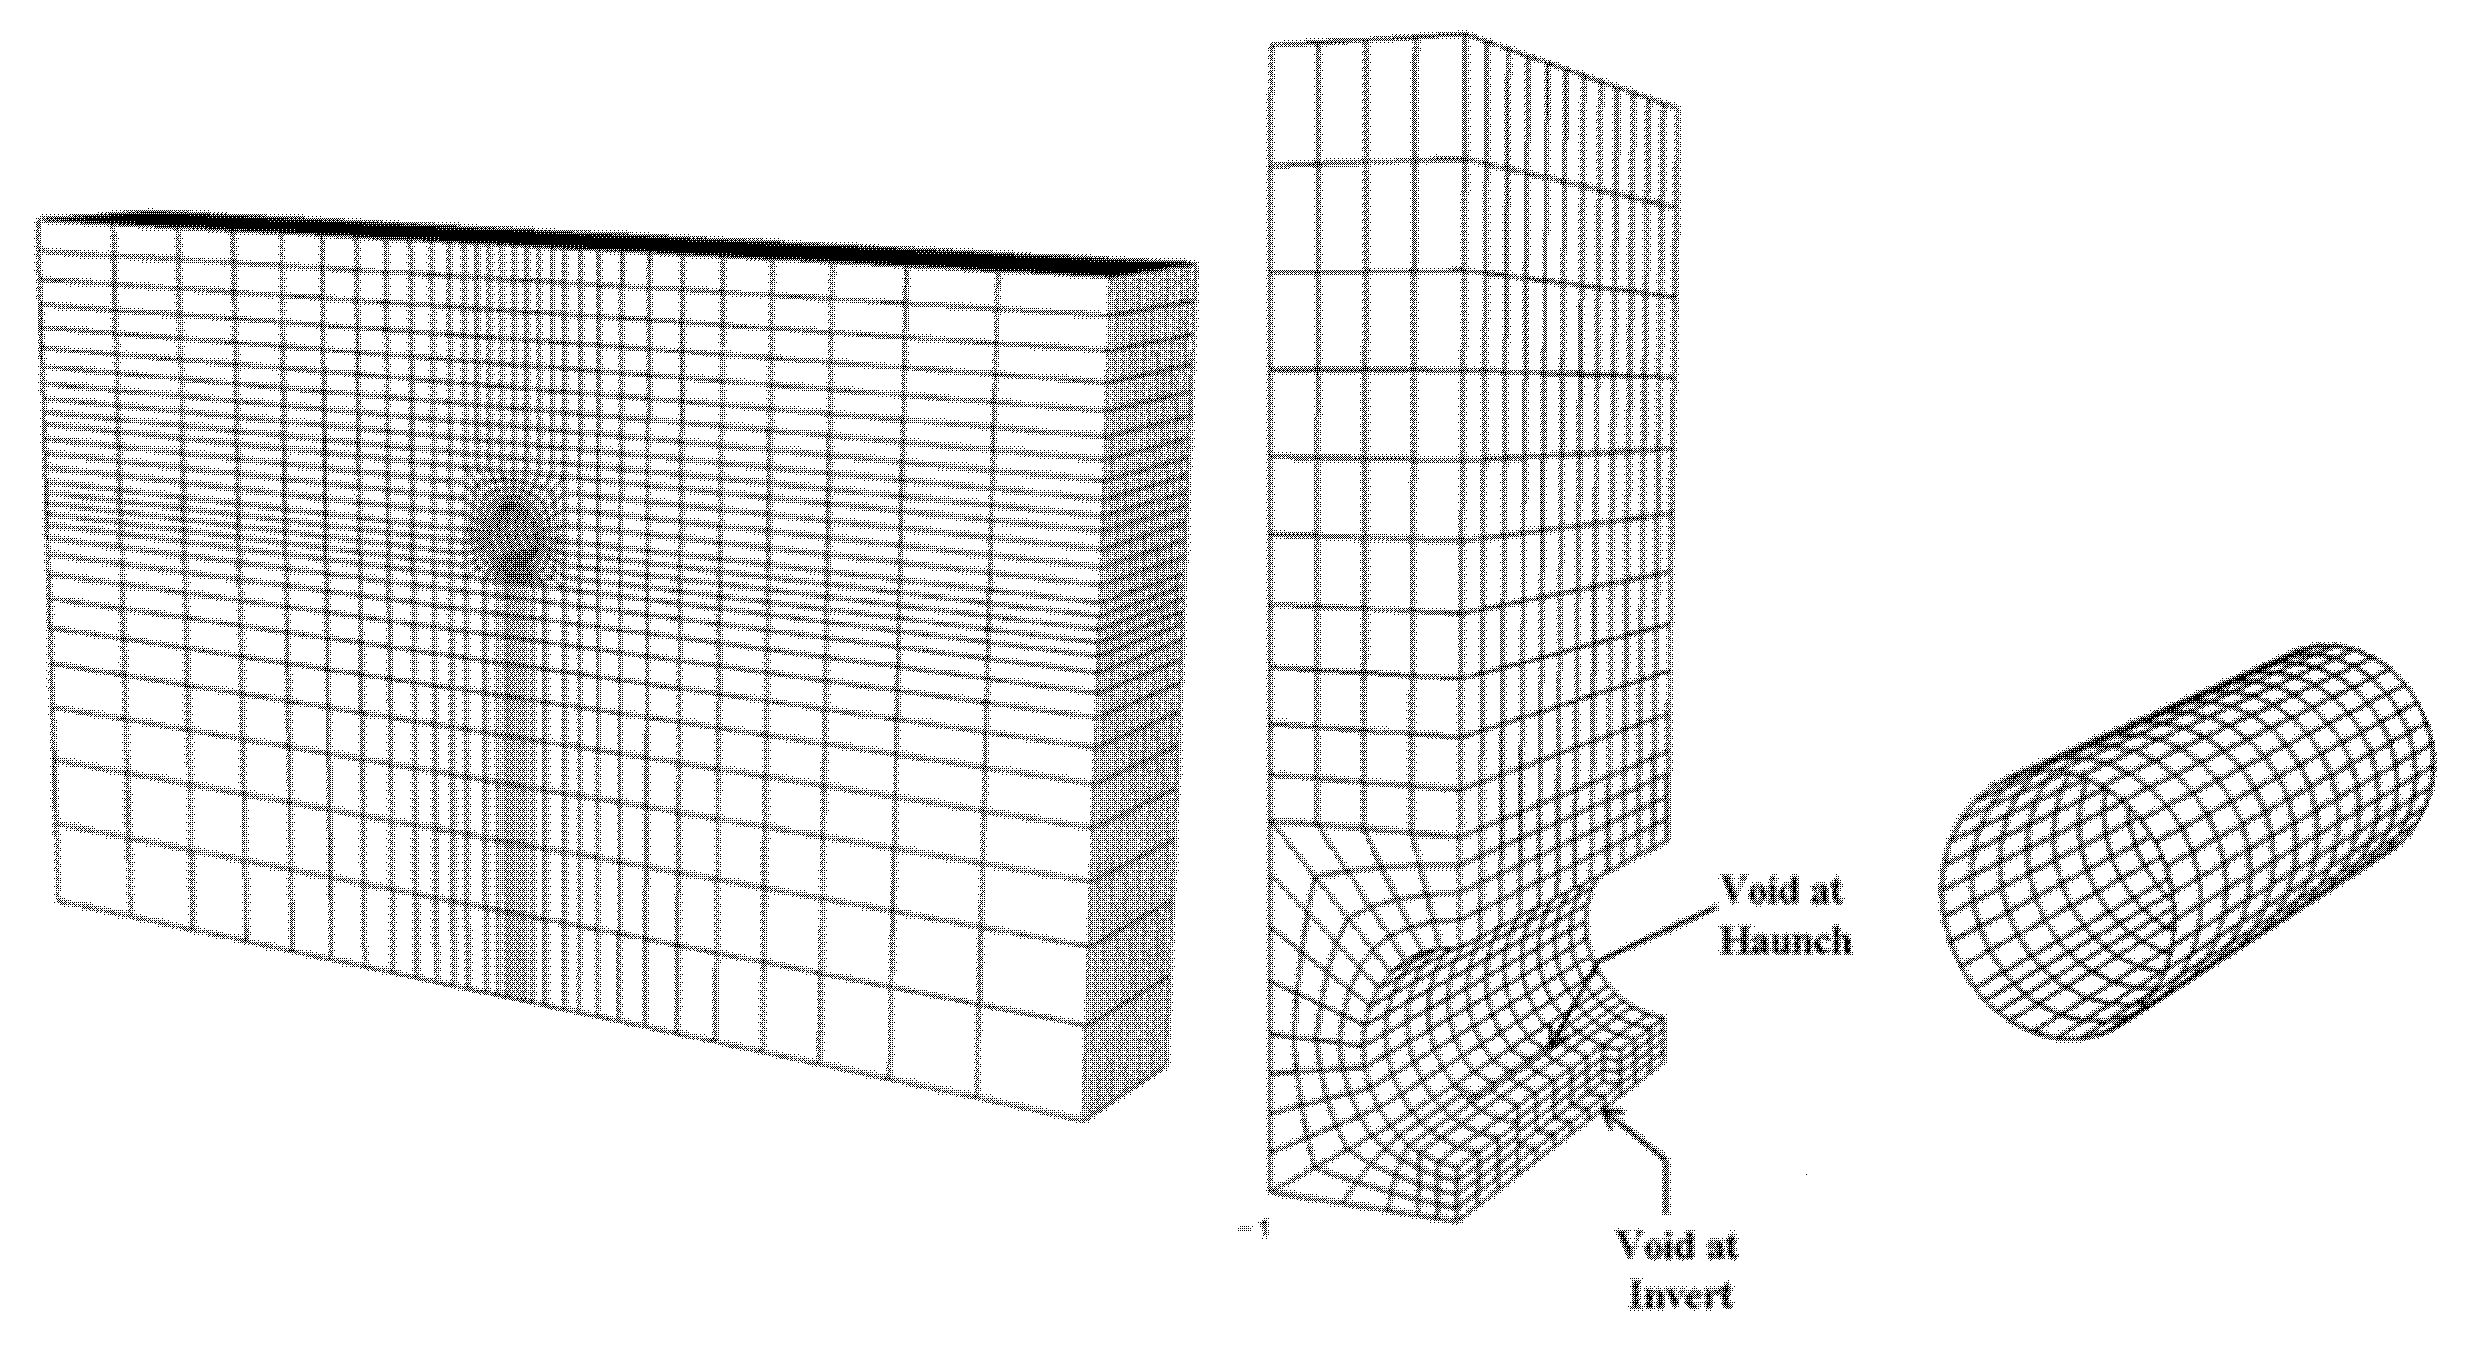
Figure 1 illustrates the finite element mesh used for our simulations. Soils with and without a groundwater table were discretized using eight-node trilinear displacement, the pore water pressure was represented by a reduced integration continuum element (C3D8RP in ABAQUS), and linear displacement was represented by a different type of reduced integration continuum element (C3D8R in ABAQUS). The concrete pipe was modeled as a four-node, quadrilateral, stress/displacement shell element with reduced integration (S4R in ABAQUS).
As illustrated in
Figure 1, the finite element mesh extends to a depth equivalent to seven times the pipe diameter below the invert and extends laterally to a distance equivalent to ten times the pipe diameter away from the springline. This boundary has been demonstrated to be sufficient to eliminate boundary effects. This implies that changes in the stress and displacement at the wall boundaries are negligible. In addition, the concrete pipe is assumed to be buried at 1.2 m below the surface, which is the general burial depth of the sewer.
2.3. Material Properties for Model Simulations
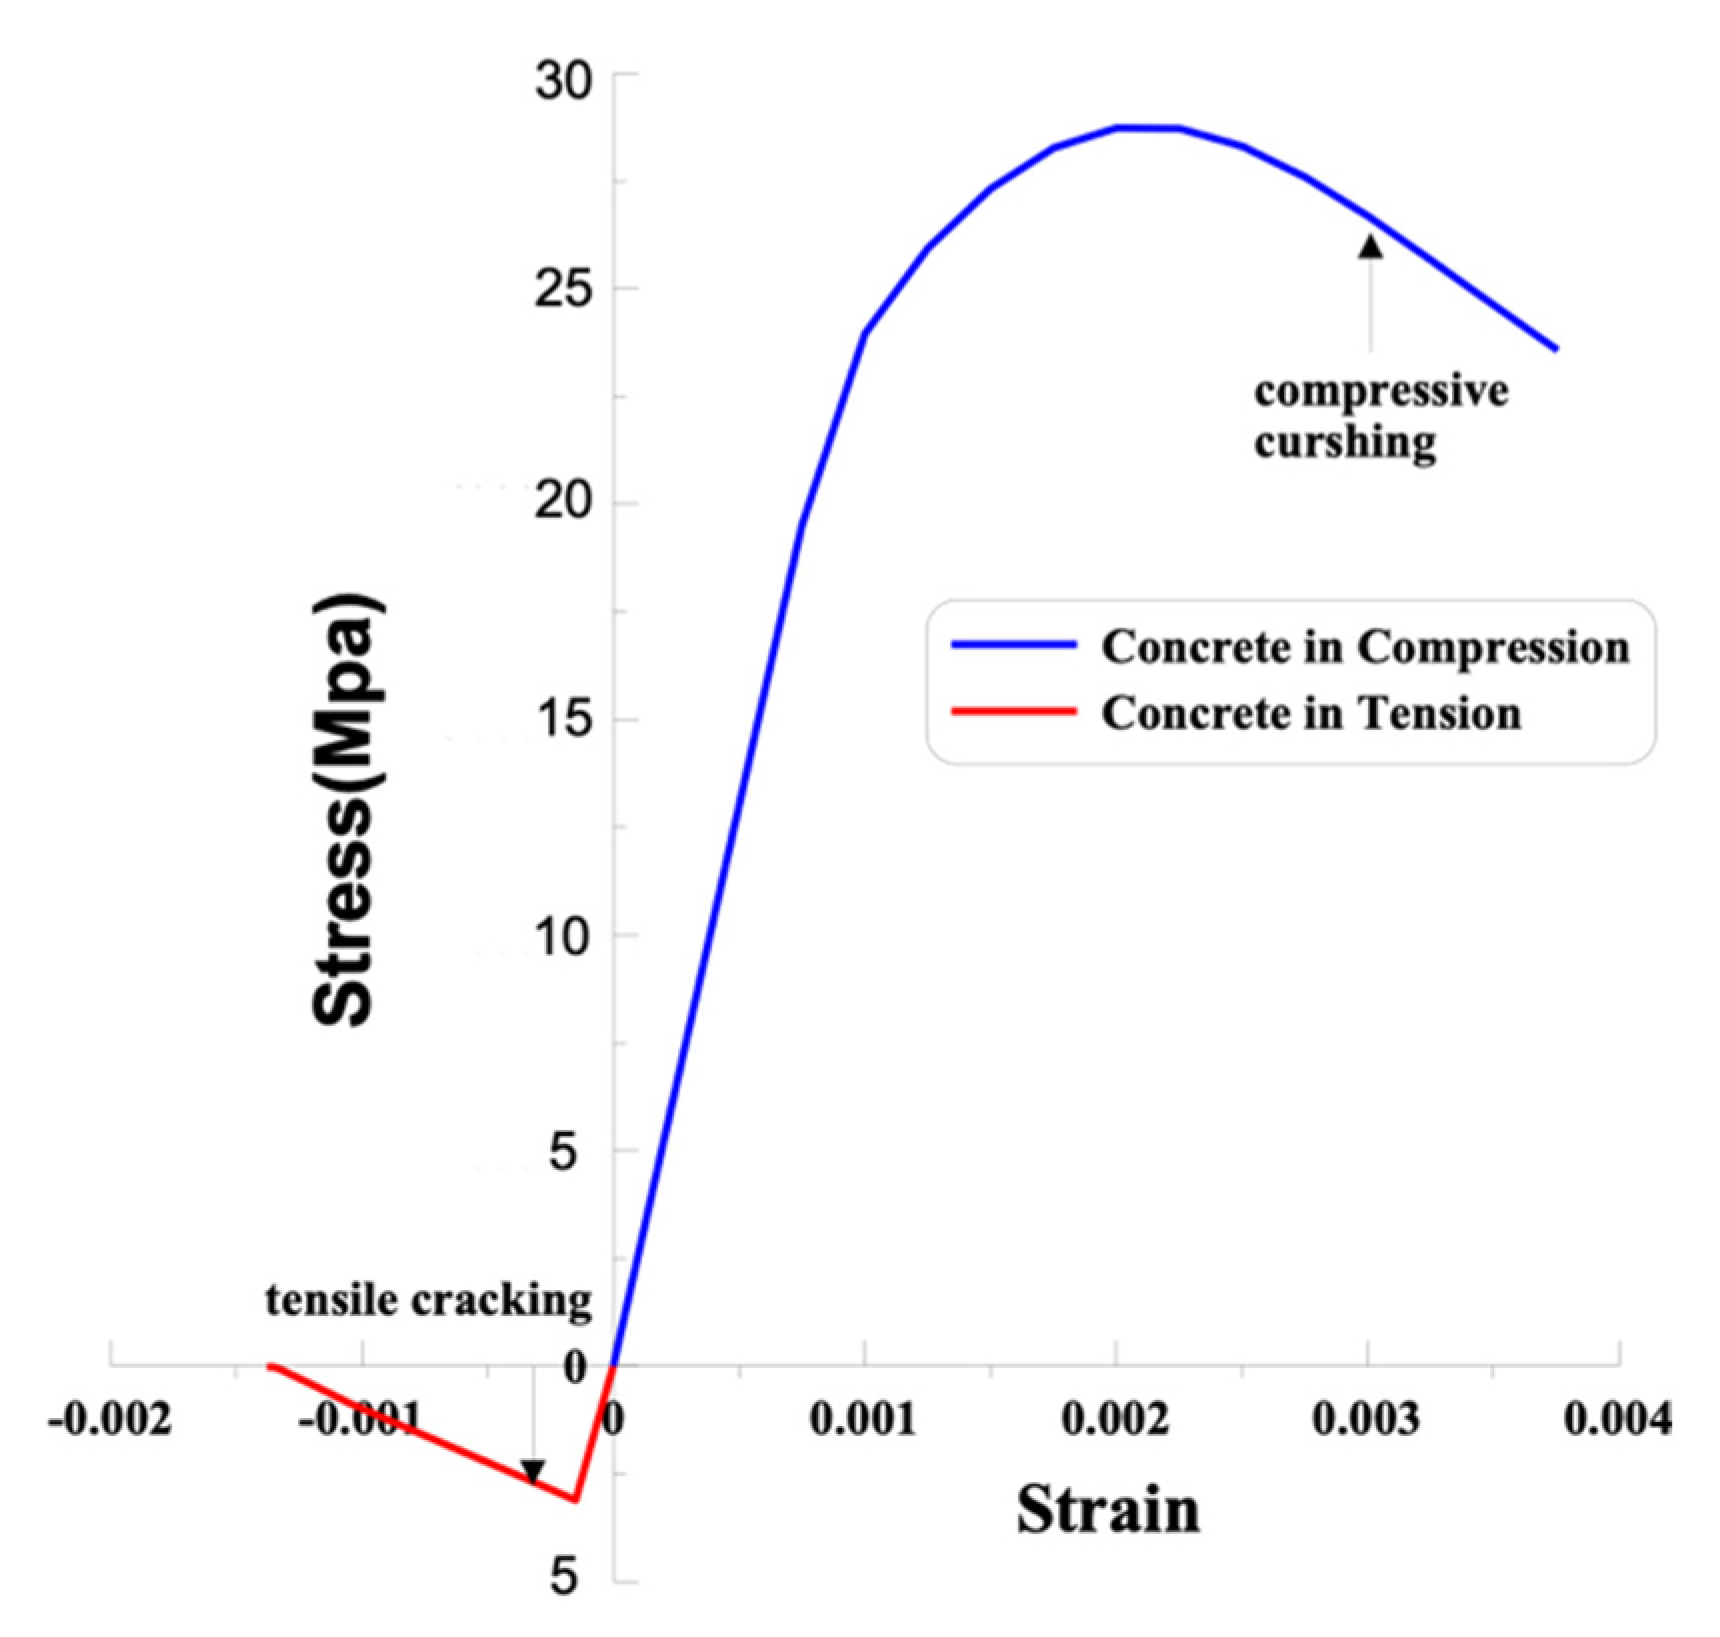
The properties of the concrete pipe used for the shell elements require compressive crushing, tensile softening, and cracking as input data. The stress–strain relationship of the concrete employed in the simulations is presented in
Figure 2. The curve in compression was borrowed from Todeshini et al. [
18], and the curve in tension was borrowed from Zarghamee and Fok [
19]. One can see that the stress–strain relationship in tension consists of a linear portion for strains up to 0.000123 and a tensile softening portion in which the stress decreases at a slope of one-tenth of Young’s modulus of concrete until reaching a fully cracked state, where the stress is zero. Beyond this level strain, the concrete is assumed to retain either no stress or only a small amount of stress.
The material properties of the native soil and concrete pipe used in the simulations were obtained from the literature [
5,
19,
20,
21] and ASTM C 76 standard. These values are presented in
Table 1 and
Table 2. In
Table 1, SW, ML, and CL denote well-graded sand, low-plasticity silt, and low- to medium-plasticity silty clay, respectively. According to the ASSHTO T-99 standard, which was used in the standard Proctor test, these materials have maximum dry densities of 80, 95, and 100, respectively.
In
Table 2, f’c denotes the specified compressive strength of concrete and f’t denotes the tensile strength of concrete.
Our analysis consists of three main steps: determining the initial stress conditions, the geostatic step, and the loading step. Each step consists of a number of increments, each of which involves calculating Newton–Raphson iterations to obtain accurate solutions for nonlinear problems. Since the behavior of soil depends on the current stress and strain fields, determining the initial conditions is the first step. In this step, the initial stress of the soil is defined. The initial vertical stress is assumed to vary linearly with soil depth, and the initial horizontal stress is determined by multiplying the initial vertical stress by the coefficient of earth pressure at rest. The geostatic step verifies whether the initial geostatic stress field defined in the first step is in equilibrium with the applied loads and boundary conditions. The analysis cannot proceed if an equilibrium is not achieved. A gravity load of 9.81 m/s2 is applied to both the soil and pipe. After establishing the initial stress with appropriate boundary conditions, the loading step is performed.
3. Results and Discussion
Under soil pressure, pipes may deform. Depending on the relative stiffness between the pipe and surrounding soil, the soil arching effect may have an influence on pipe deformation. A pipe can benefit from the soil arching effect to some extent because the soil-arching mechanism allows the overburden and surcharge pressures at the crown to be supported by the adjacent soil. Therefore, the entire overburden pressure plus any surcharge loading is not imposed on the buried pipe. As a result, the buried pipe only needs to support the portion of the load that is not transferred to the adjacent soil.
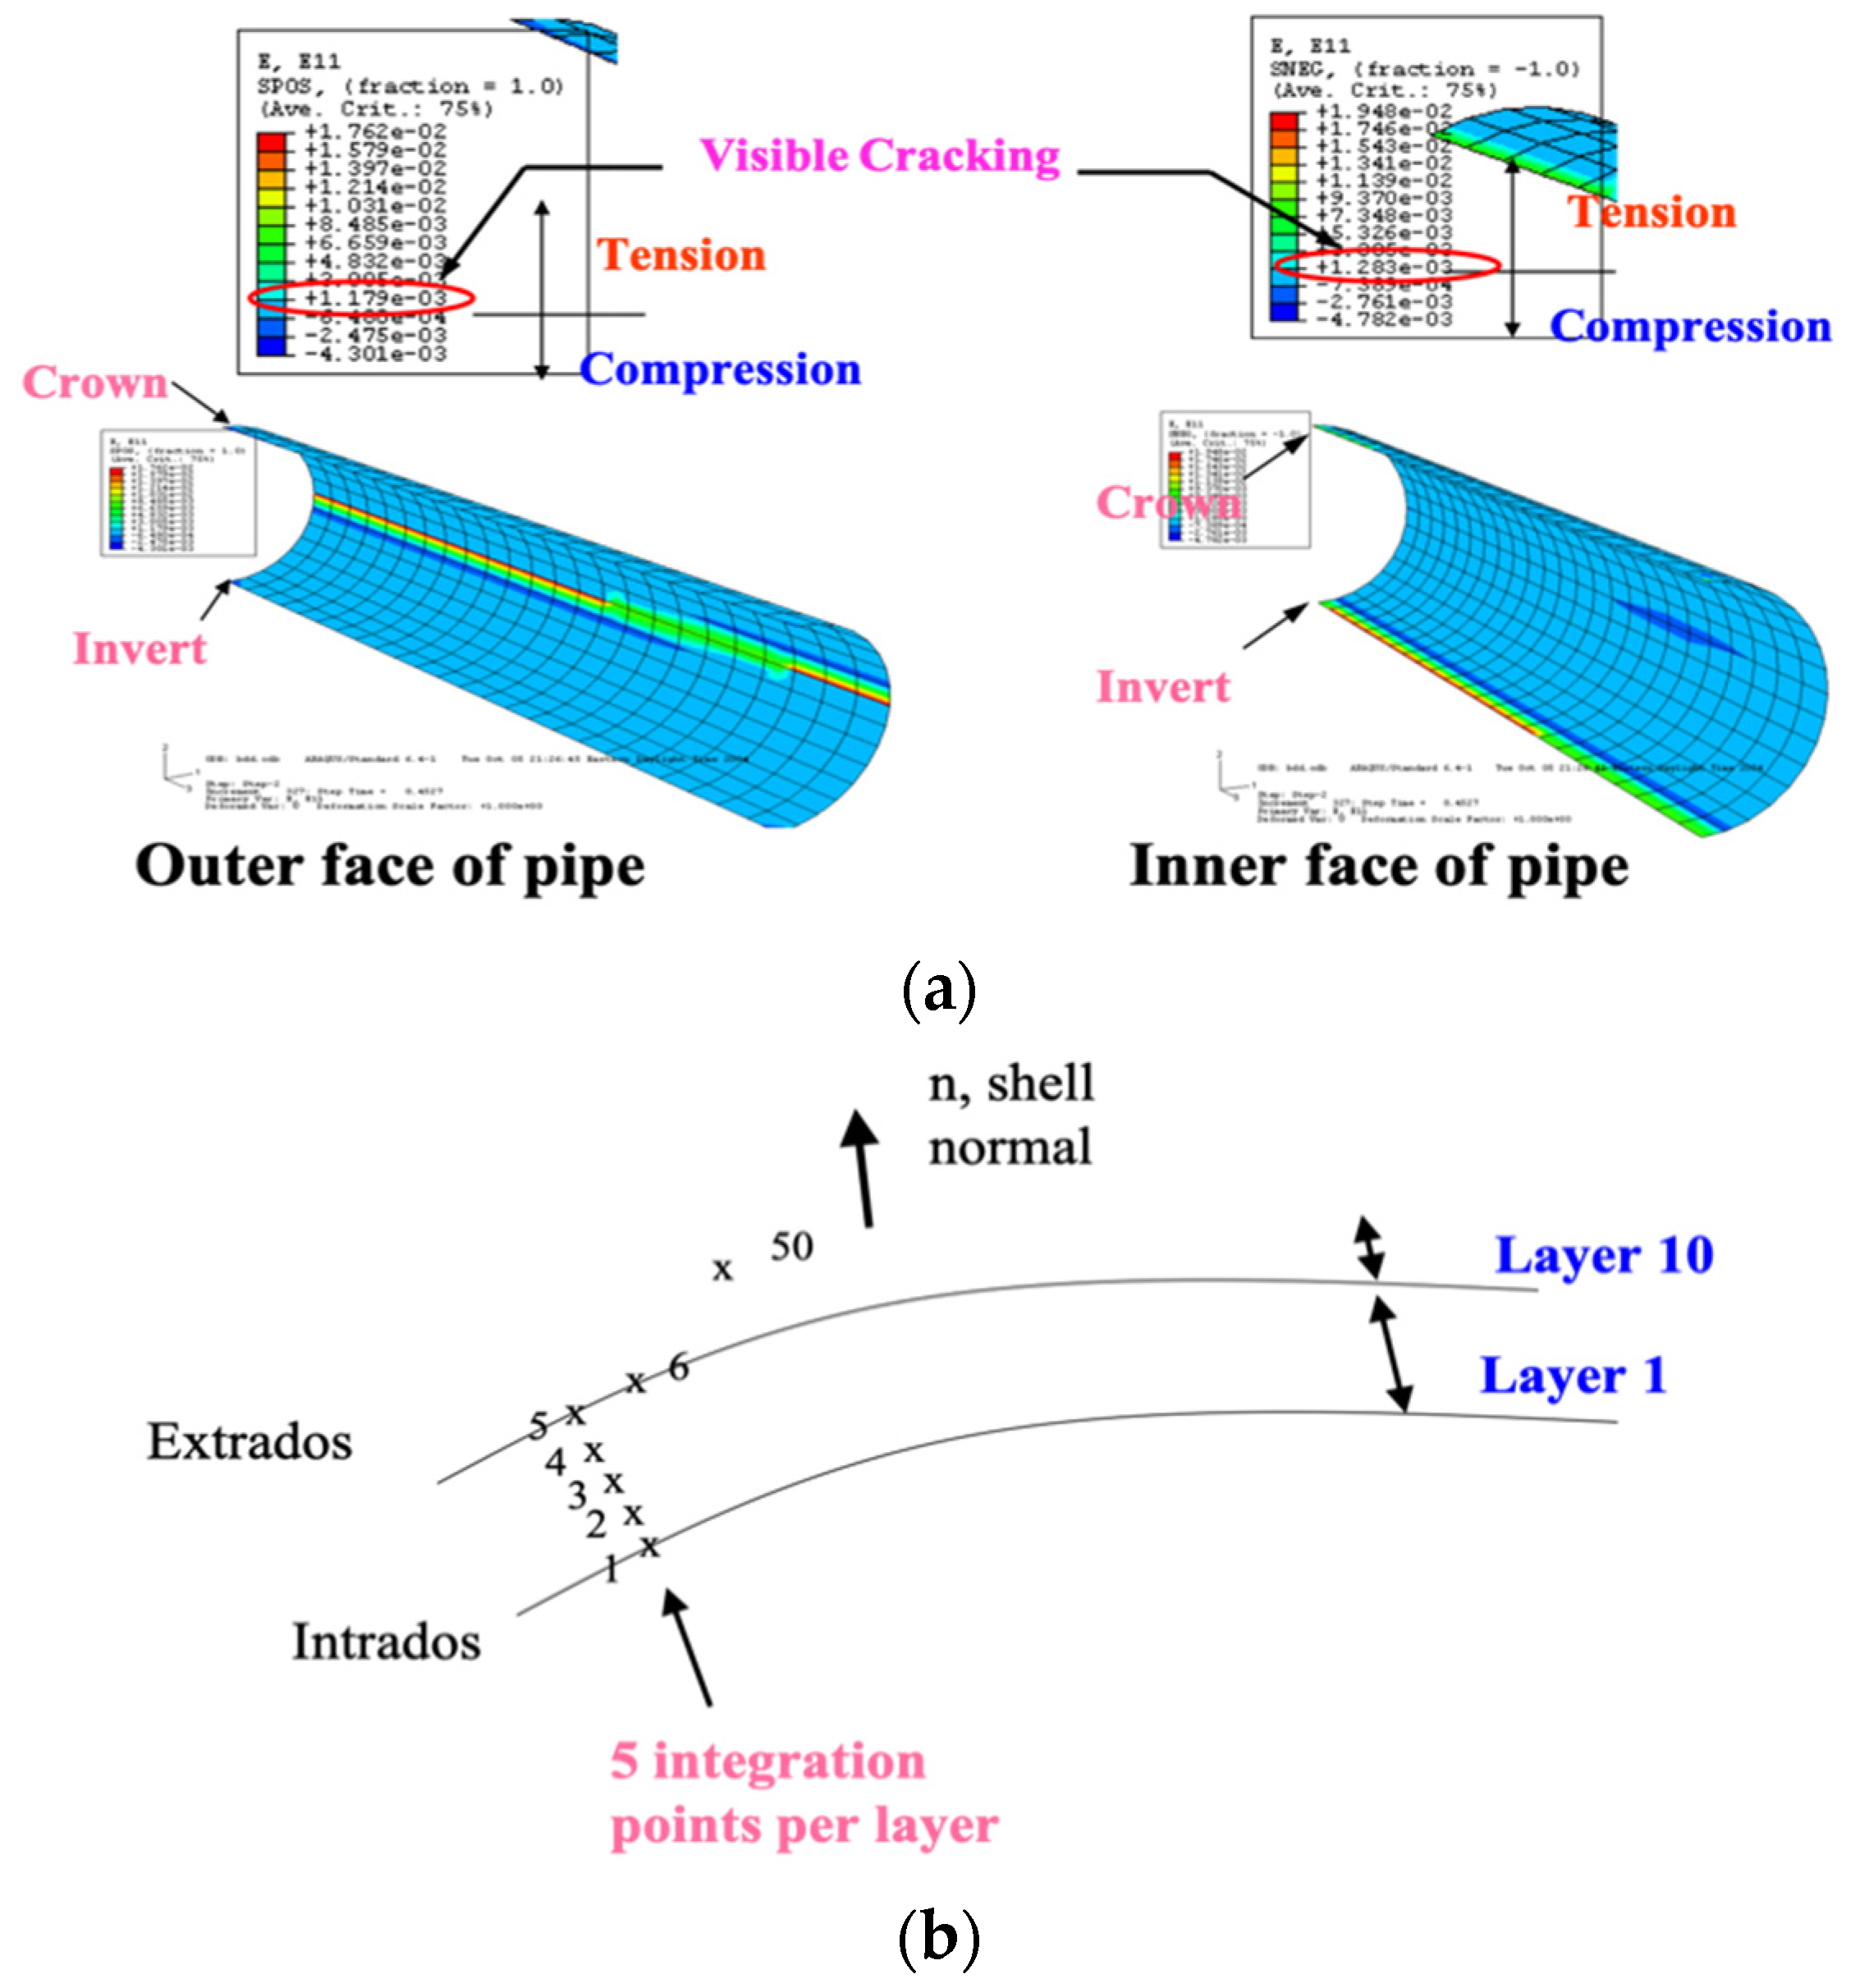
The crack depth data were obtained from the results of the strain distributions across the pipe wall, as shown in
Figure 3a. In this analysis, the 7.5-cm-thick pipe wall is divided into ten layers, with five integration points in each layer. The five integration points are equally spaced across the thickness of each layer. Therefore, there are a total of 50 integration points across the pipe wall thickness (
Figure 3b).
3.1. Loading Effects
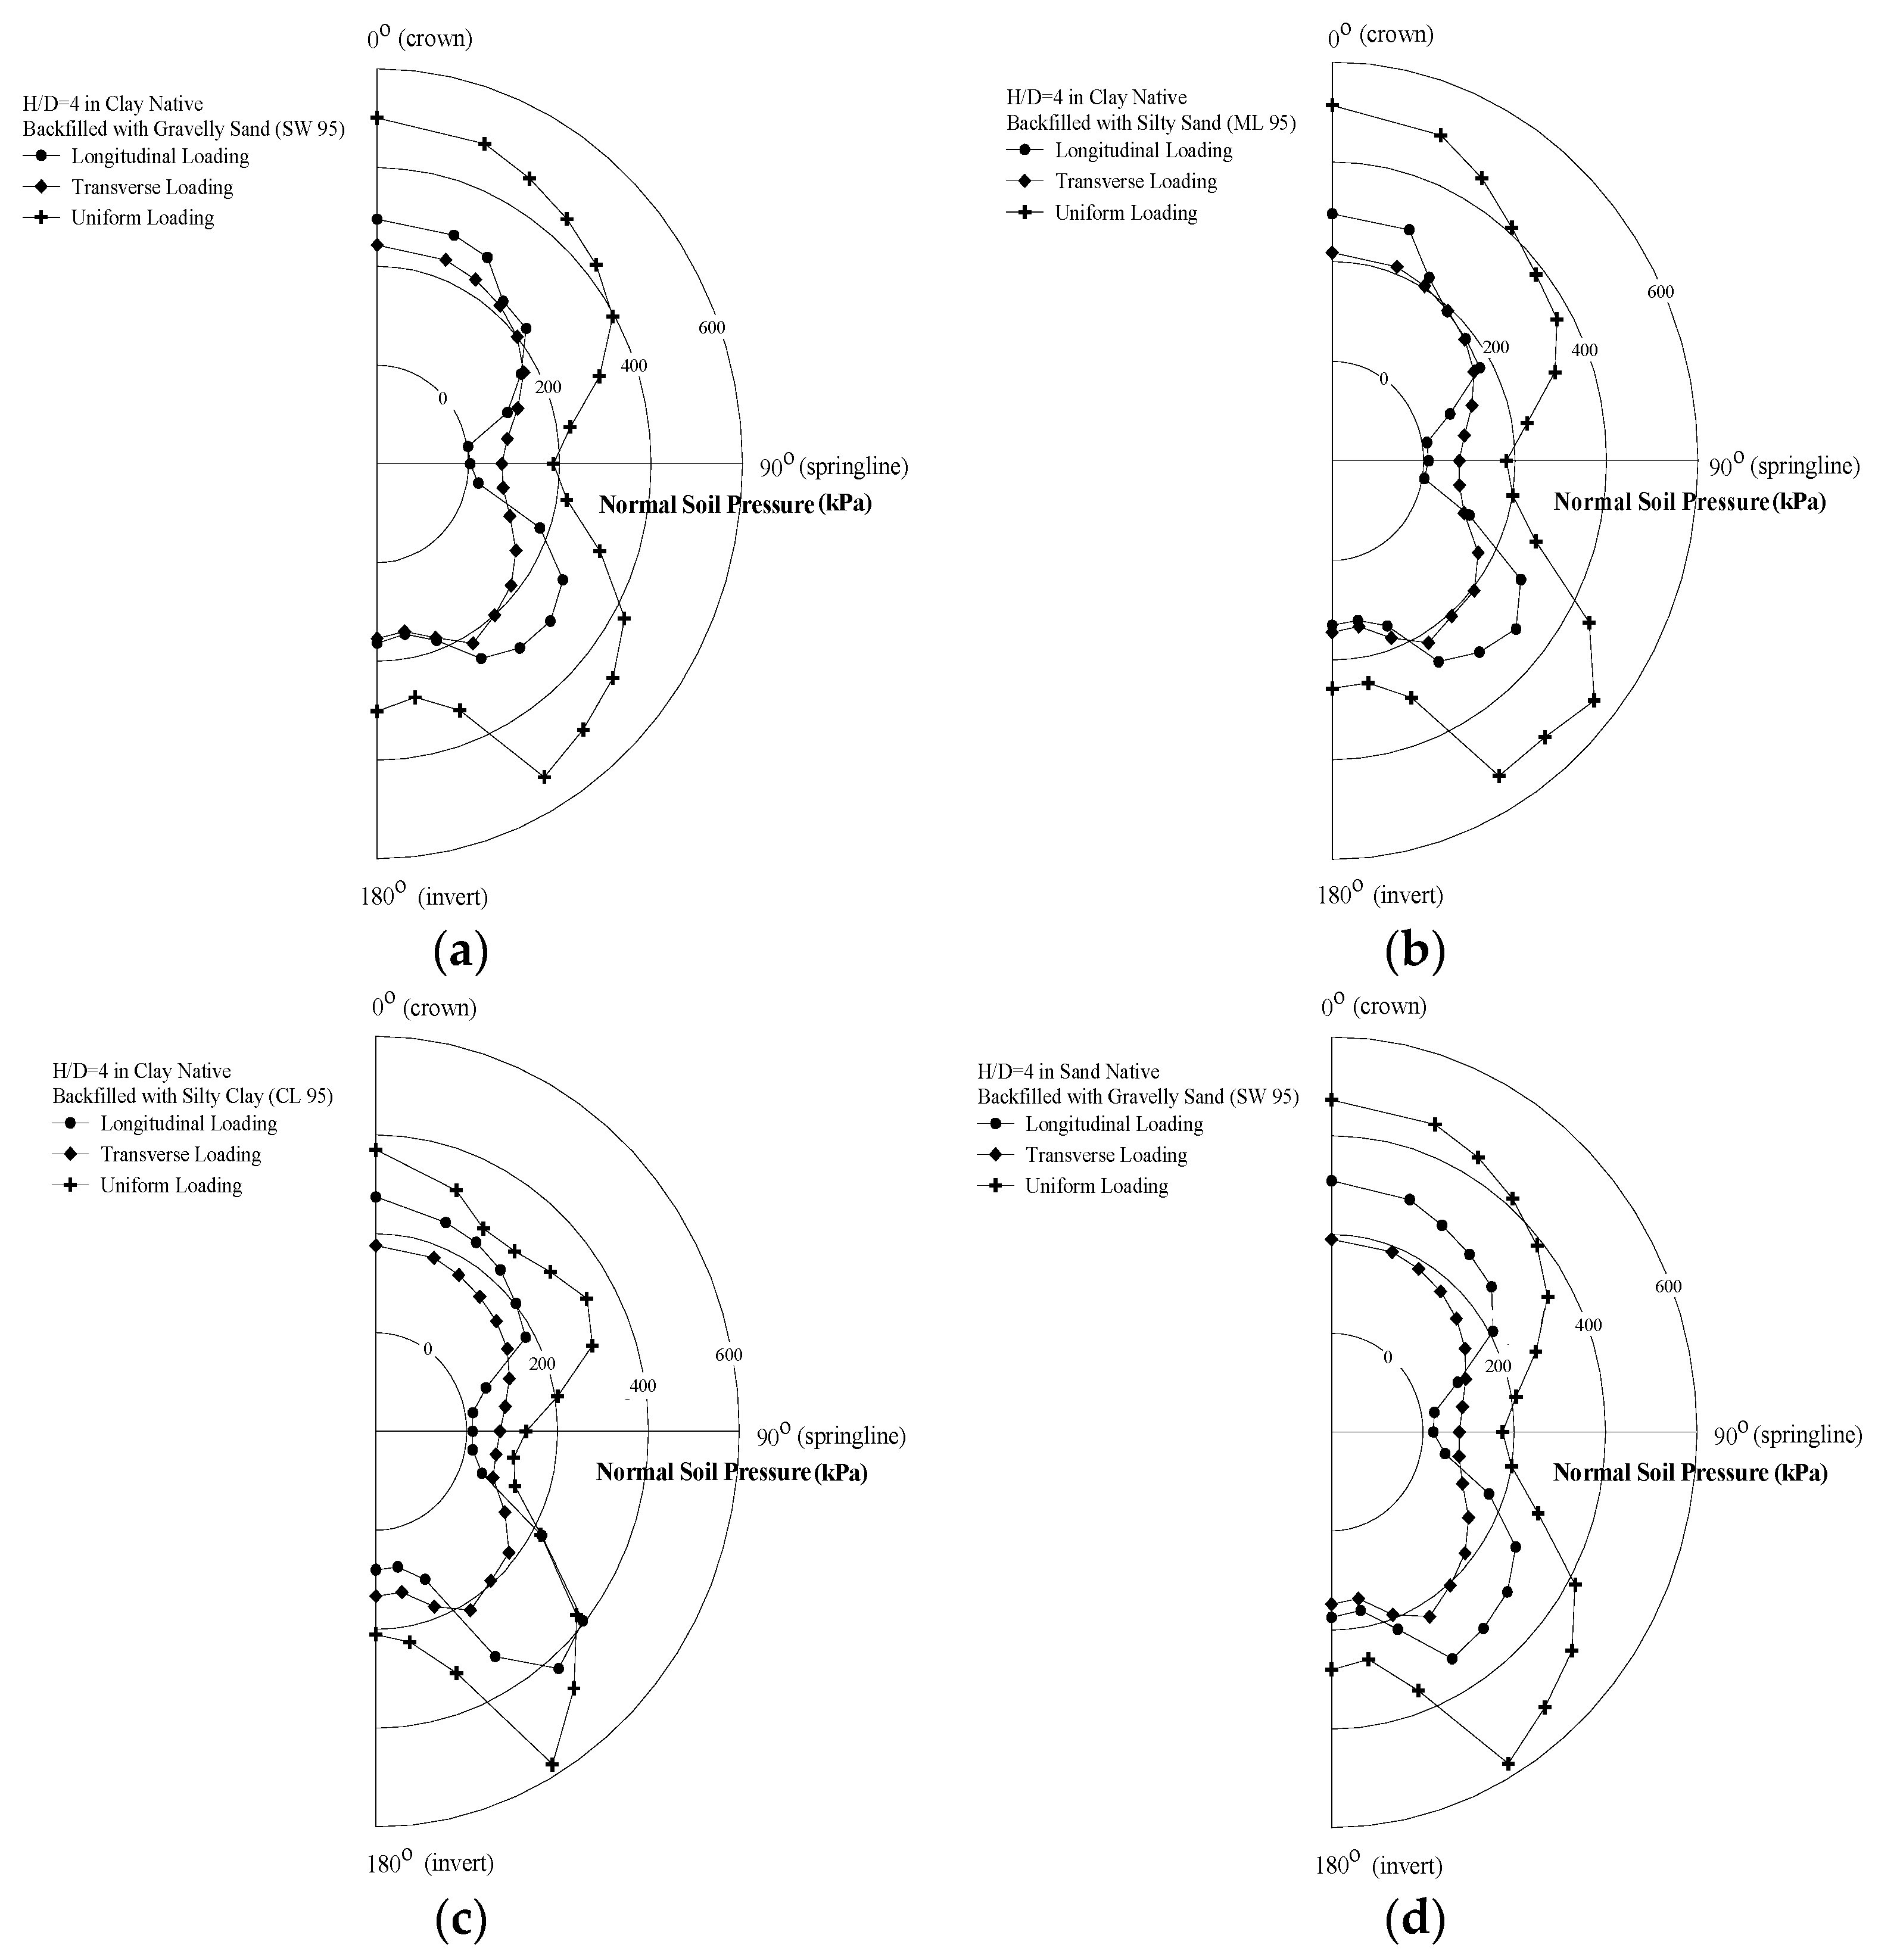
A buried pipe may be subjected to different loading conditions depending on how loading is imposed on the pipe. Longitudinal, transverse, and uniform loads can be imposed on buried pipes. Under the longitudinal loading condition, surface loading only covers the trench width in the longitudinal direction. Under the transverse loading condition, surface loading covers one-third of the entire model surface in the transverse direction. Under the uniform loading condition, the load covers the entire model surface. The normal soil pressure distribution around a buried concrete pipe was analyzed under longitudinal, transverse, and uniform loading conditions. The analyzed normal soil pressures were then plotted along the central angle measured clockwise from the crown of the buried concrete pipe. The surface loading was kept constant at 500 kPa for all conditions to allow for the direct comparison of results.
The normal soil pressure distributions under different loading conditions for gravelly sand, silty sand, and silty clay backfills, as well as clay and sand native soils, are presented in
Figure 4. The cross-sectional view of the transverse loading condition was captured at the central axis of transverse loading. For all conditions, a distinct feature of the corresponding distribution is that the pressure decreases from the crown to the springline, increases from the springline to the lower haunch, and then decreases to the invert. The soil pressure distribution for the uniform surface loading condition should be the same as that without any surface loading (geostatic condition), except that the magnitudes of the values under the geostatic condition should be smaller.
As illustrated in
Figure 4a, the average normal soil pressures are heavily influenced by the loading type. The lowest and highest average normal soil pressures occur for the transverse and uniform loads, respectively. One plausible explanation for this phenomenon is that higher normal soil pressures are induced by higher confining pressures under uniform loading conditions. Additionally, the normal soil pressure under transverse loading conditions at the springline is greater than that under longitudinal loading conditions. This can be attributed to the fact that the confining pressure under the central axis under transverse loading conditions is greater than that under longitudinal loading conditions. Furthermore, unlike the pressures obtained under uniform and transverse loading conditions, the normal soil pressures at the springline under longitudinal loading conditions are nearly zero. These very low normal soil pressures at the springline could be partially attributed to the shear resistance mobilized along the vertical interface between the trench wall and native clay soil. This shear resistance reduces the surface loading effects on the normal soil pressure.
As illustrated in
Figure 4b,c, the patterns of the normal soil pressure distributions for silty sand and silty clay are similar to those for gravelly sand. The induced soil pressures for gravelly sand under both longitudinal and transverse loads are almost equivalent at the invert. However, the induced soil pressures under transverse loading for silty sand and silty clay are greater than those under longitudinal loading at the invert.
Figure 4d presents the normal soil pressure distributions under different loading conditions for the gravelly sand backfill material in the sand native soil. The trends in the normal soil pressure distributions are similar to those for the clay native soil presented in
Figure 3a. The normal soil pressure at the springline under longitudinal loading is greater than that in clay native soil. This can be attributed to the greater confining pressure under this condition.
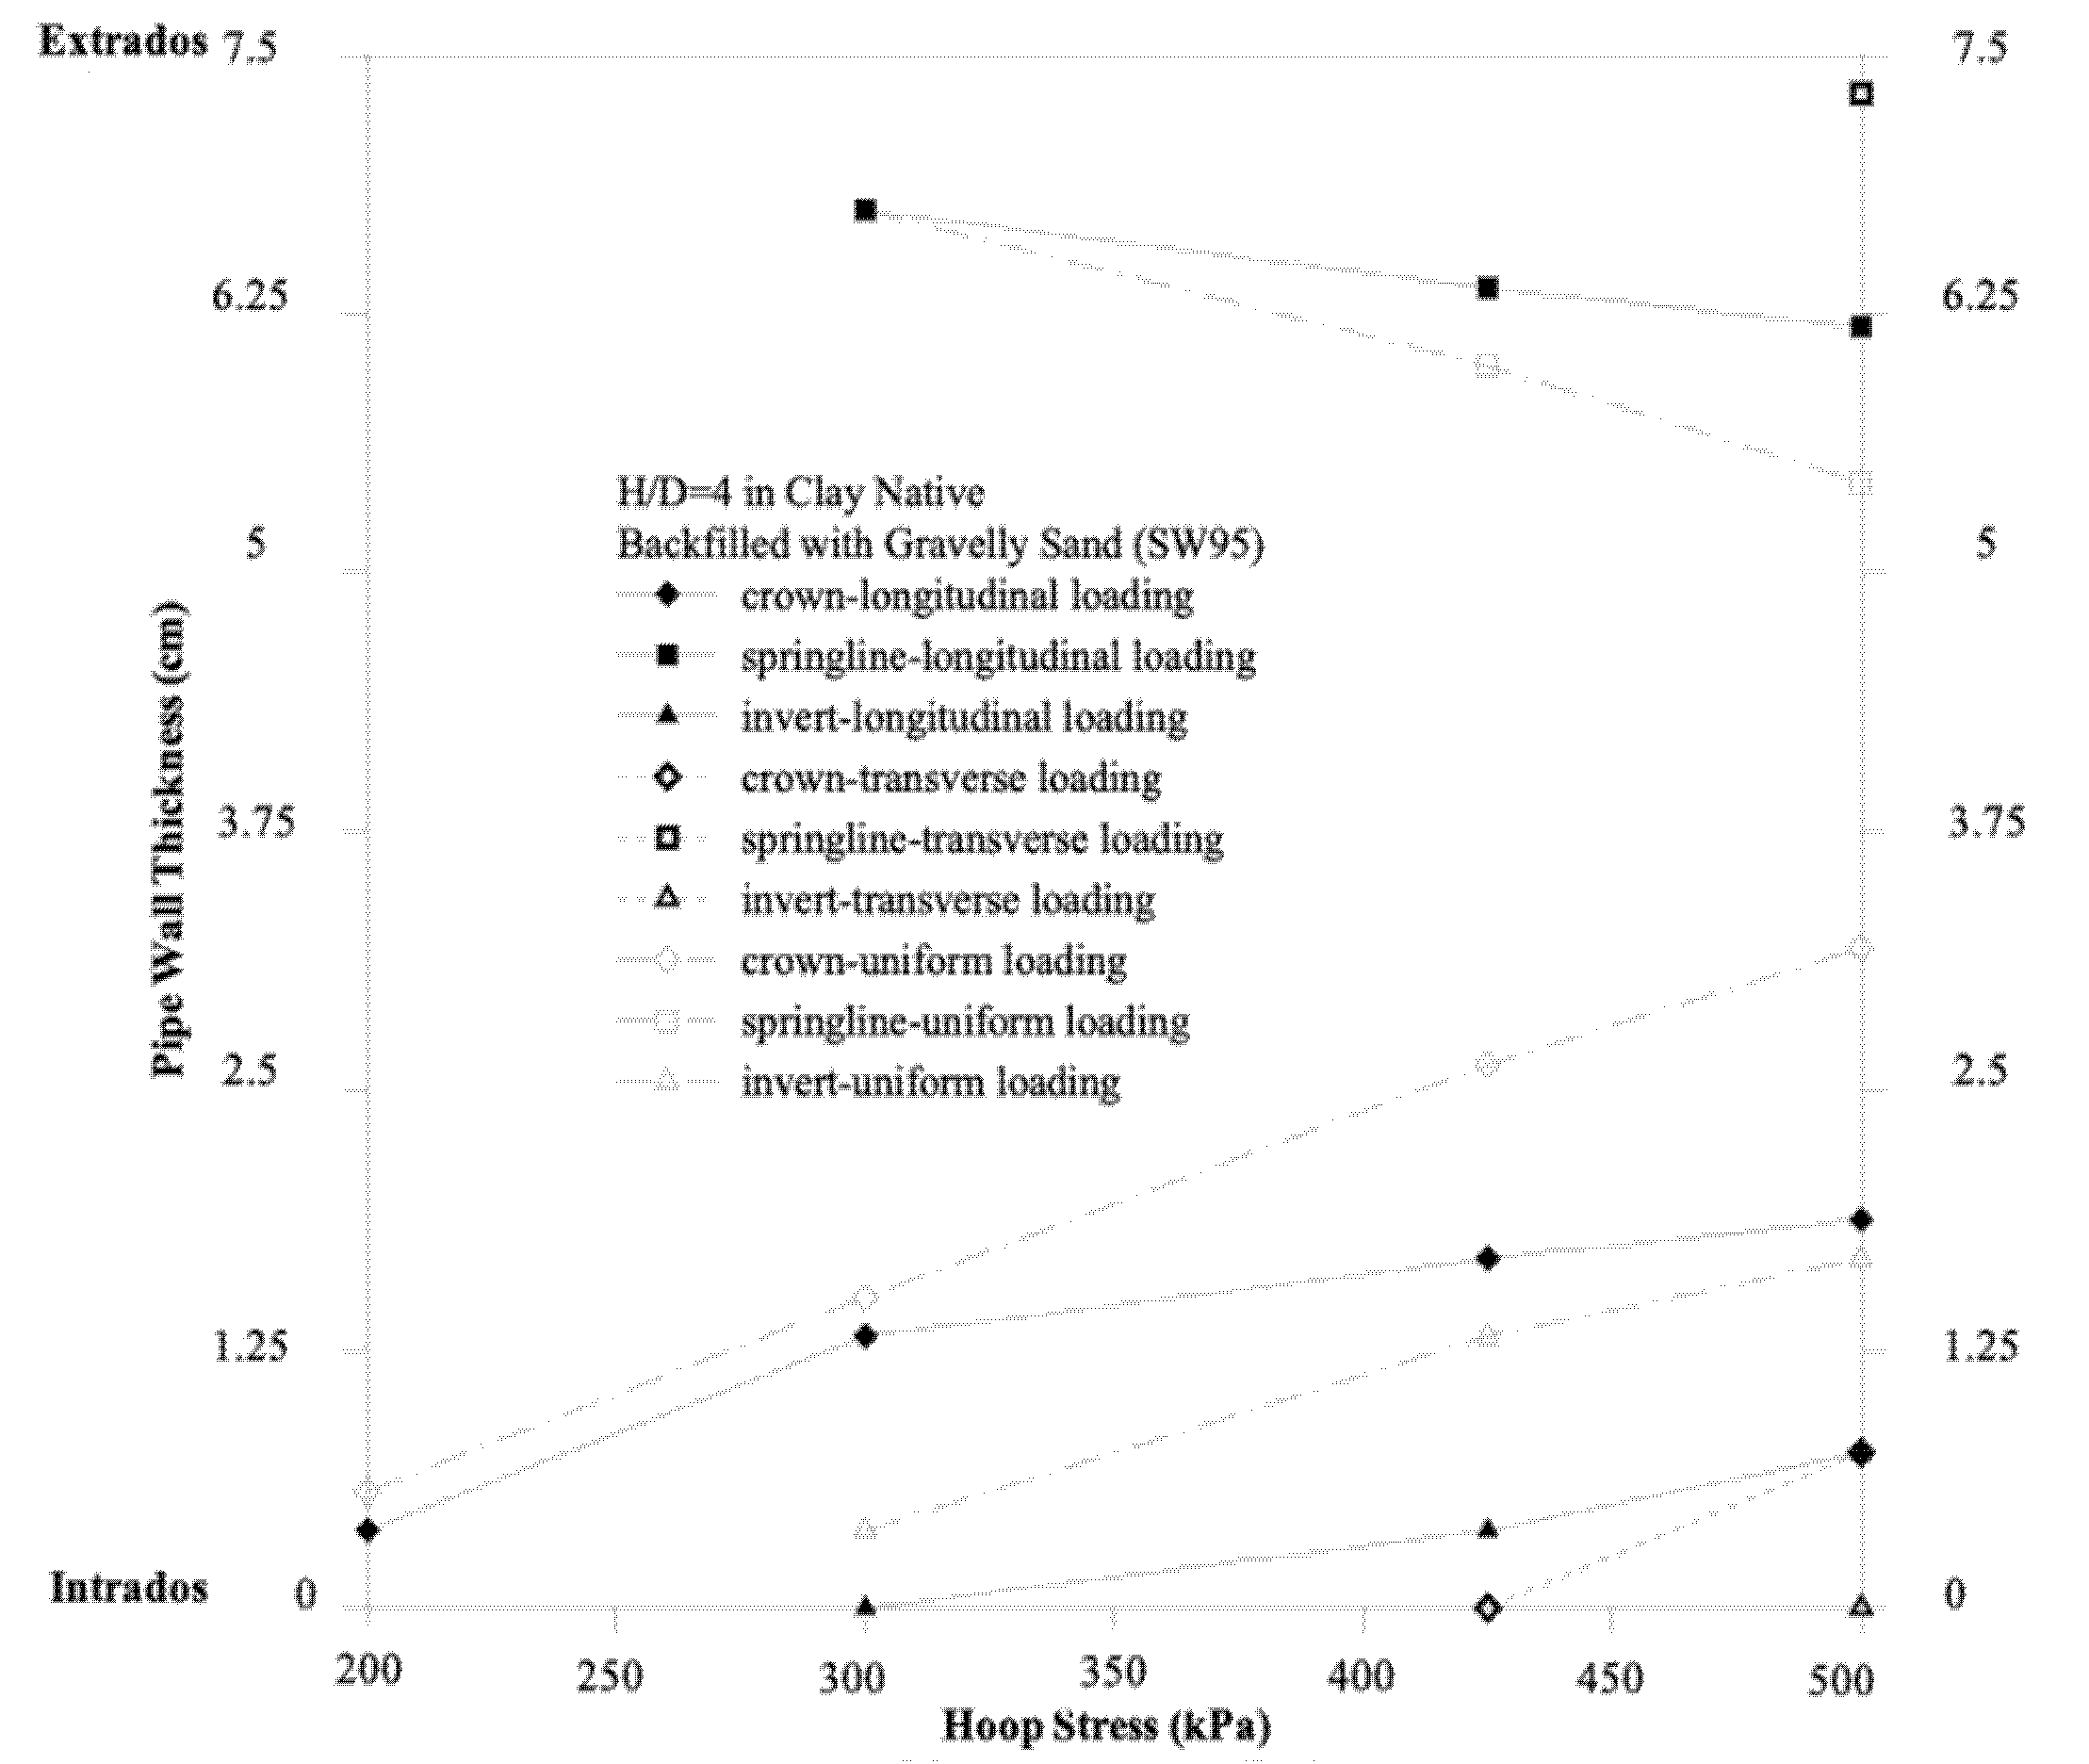
Crack propagation in the pipe under surface loading is presented in
Figure 5.
The
y axis depicts the wall thickness. The intrados and extrados of the pipe wall are located at 0 cm and 7.5 cm on the
y axis, respectively. As shown in
Figure 5, cracking initiates from the intrados to extrados at the crown and invert. However, at the springline, cracking initiates from the extrados to the intrados. Under longitudinal loading, cracking that initiates in the intrados at the crown propagates outward to a distance of approximately 0.38 cm under a surface load of 200 kPa and approximately 1.9 cm under a surface load of 500 kPa. At the springline, cracking initiates in the extrados and reaches a depth of approximately 0.75 cm under 300 kPa of surface loading. The crack depth then grows to approximately 1.33 cm under 500 kPa of surface loading. At the invert, cracking initiates in the intrados under 300 kPa of surface loading and propagates outward to a depth of approximately 0.76 cm under 500 kPa of surface loading.
Under transverse loading, the cracks at the crown initiate in the intrados under a surface load of 425 kPa and propagate outward to approximately 0.76 cm under 500 kPa of surface loading. At the springline, the cracks that initiate in the extrados propagate inward to approximately 0.19 cm under 500 kPa of surface loading. At the invert, cracks initiate in the intrados only under 500 kPa of surface loading. Under uniform loading, cracking that initiates in the intrados at the crown propagates outward to approximately 0.57 cm under a surface load of 300 kPA and approximately 3.24 cm under 500 kPa of surface loading. At the springline, cracks initiate in the extrados under the same surface load of 300 kPa but propagate outward to approximately 2.10 cm under a uniform load of 500 kPa more rapidly compared to the longitudinal loading condition. At the invert, cracks initiate in the intrados and reach a depth of approximately 0.38 cm under a uniform surface load of 300 kPa. The crack depth increases to approximately 1.71 cm under 500 kPa of surface loading. The rate of crack propagation can be estimated from the slopes of the curves in
Figure 5. These curves indicate that cracks propagate more rapidly under uniform loading than under longitudinal loading. For transverse loading, the amount of data is insufficient to evaluate the rate of crack propagation for comparison.
3.2. Groundwater Effects
Typically, pipes are buried above the groundwater table. However, the groundwater table may rise above a pipe as a result of a severe rainstorm or other unexpected events. To investigate the effects of groundwater, analyses were conducted on moist, saturated, and submerged soil conditions. For the submerged condition, the groundwater table was assumed to be located at the ground surface. The stress-pore pressure coupled modeling technique was adopted to investigate the coupled effects of stress and pore water on the performance of buried concrete pipes. In fully coupled modeling, both hydraulic boundary conditions and mechanical boundary conditions must be defined. Regarding hydraulic boundary conditions, a no-flow boundary was assigned at each of the four vertical boundaries of the buried concrete pipe. To prevent water from flowing into the buried pipe, the permeability of the buried pipe was set to zero. The pore-water pressures at both the right and left vertical boundaries were assumed to be constant throughout our analysis.
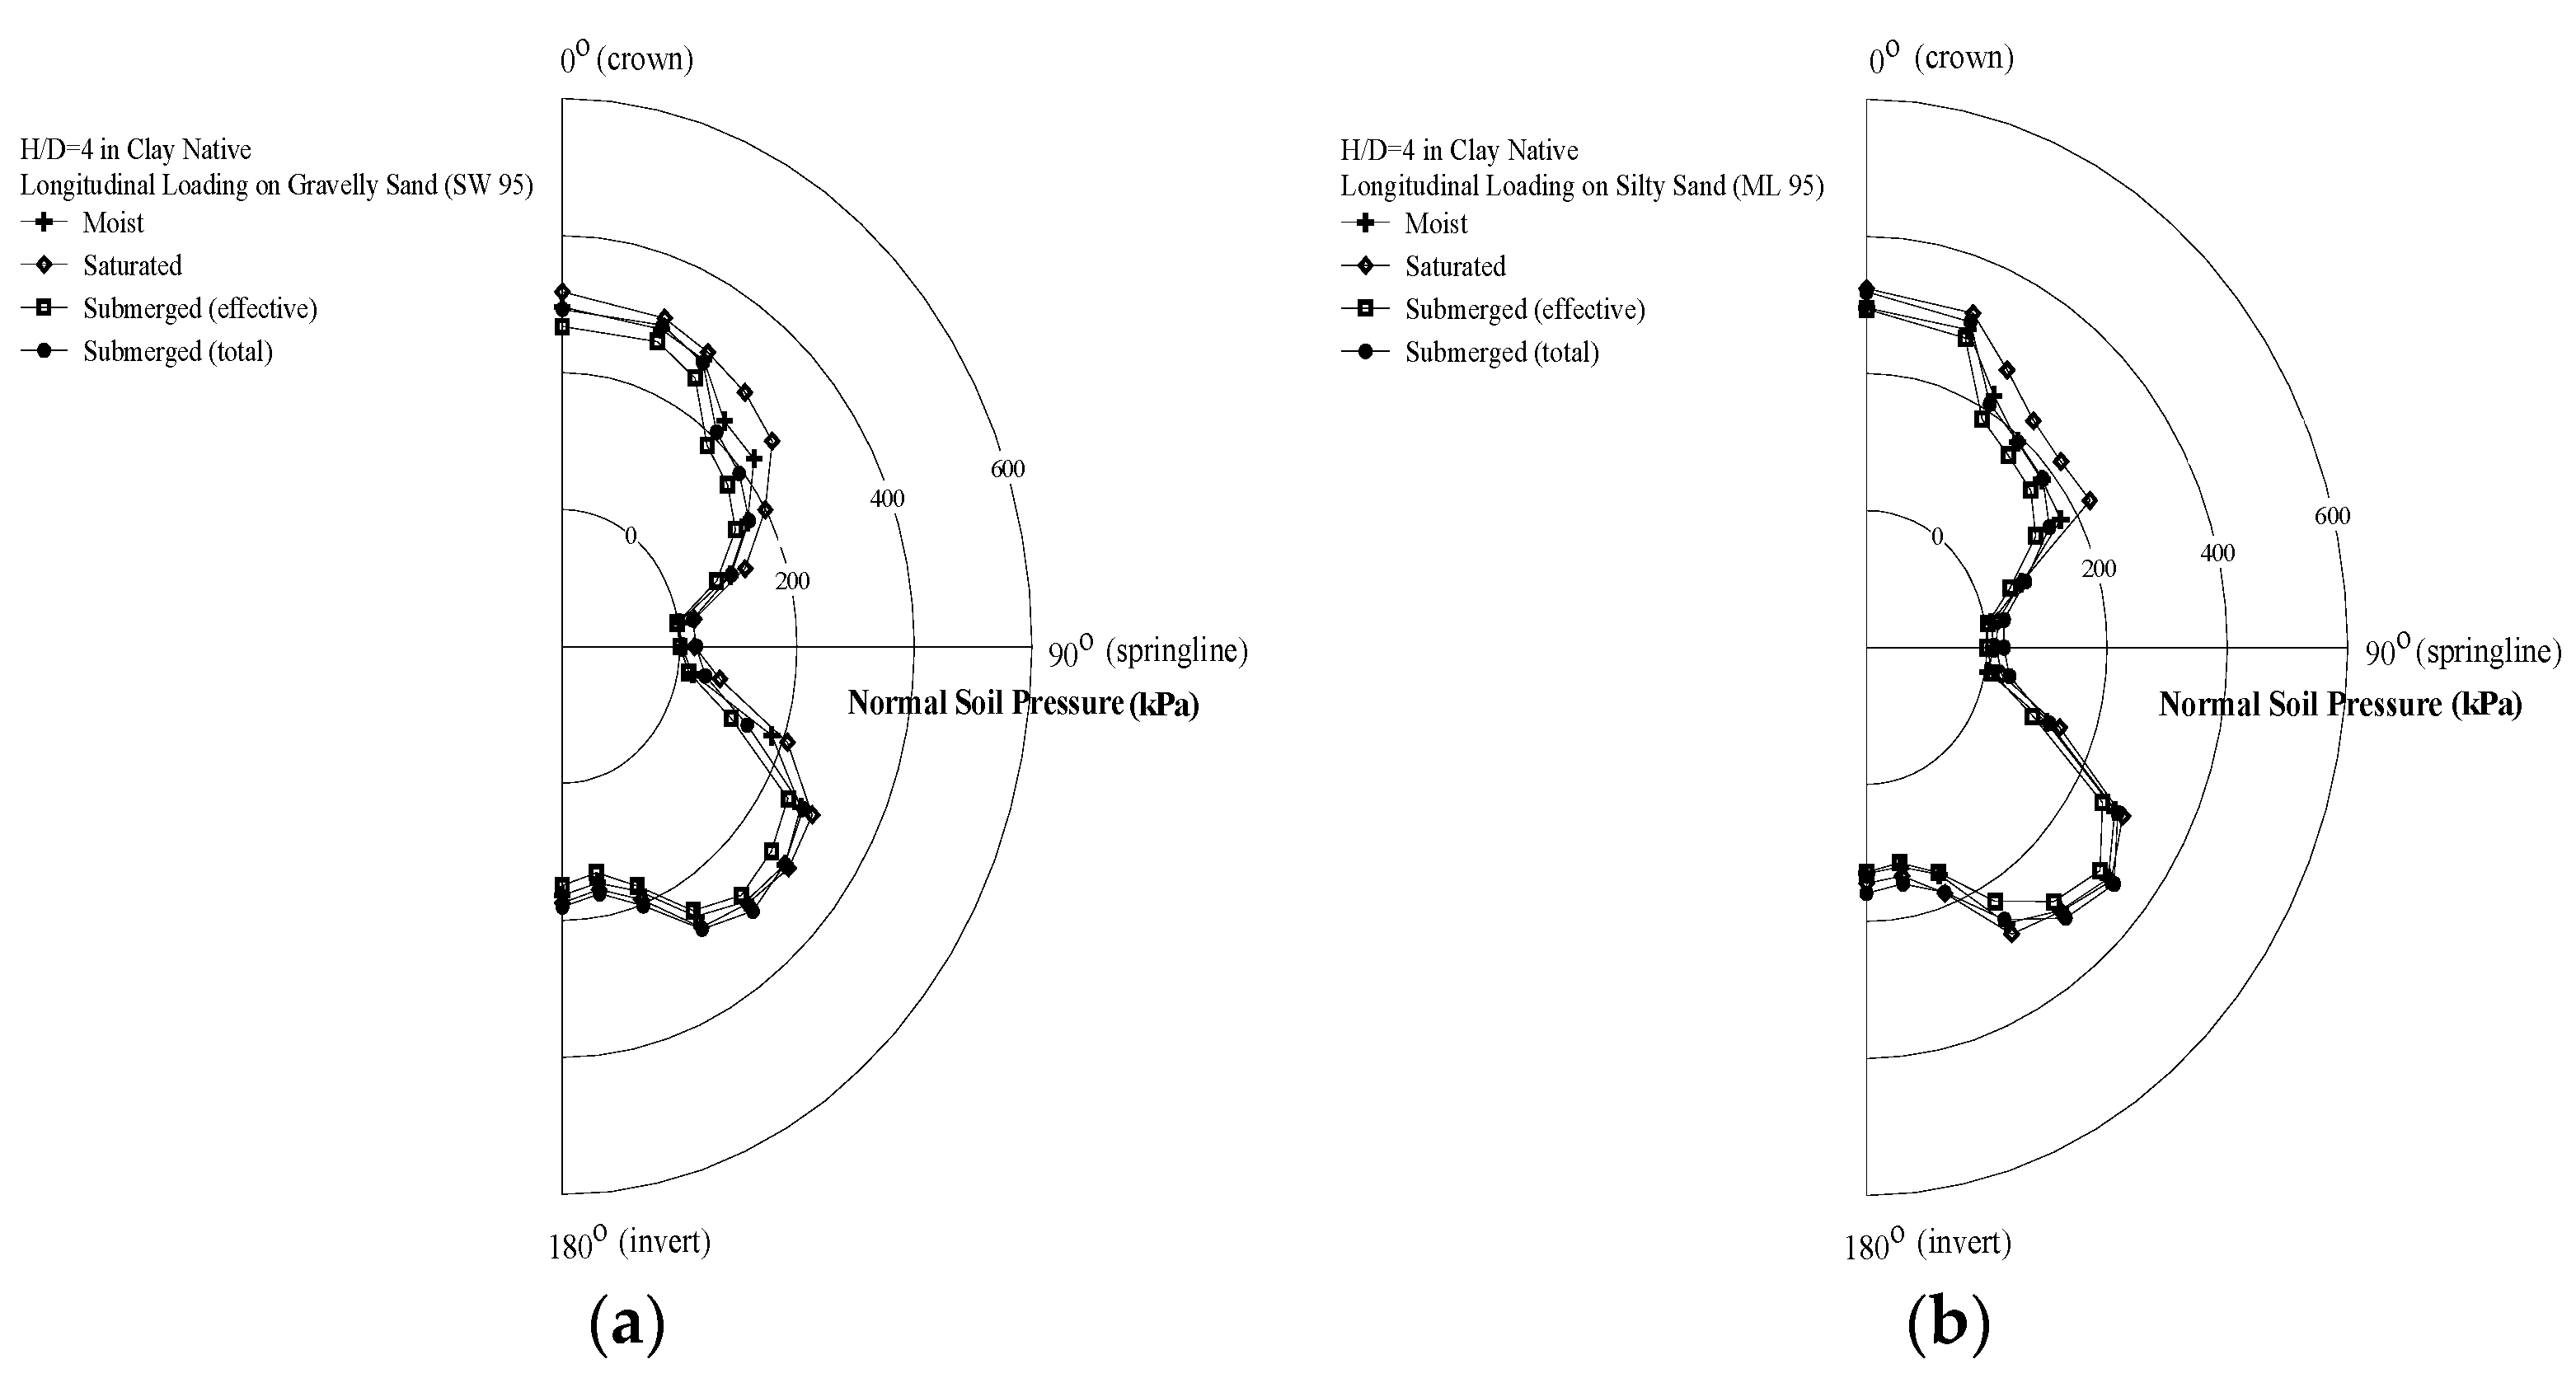
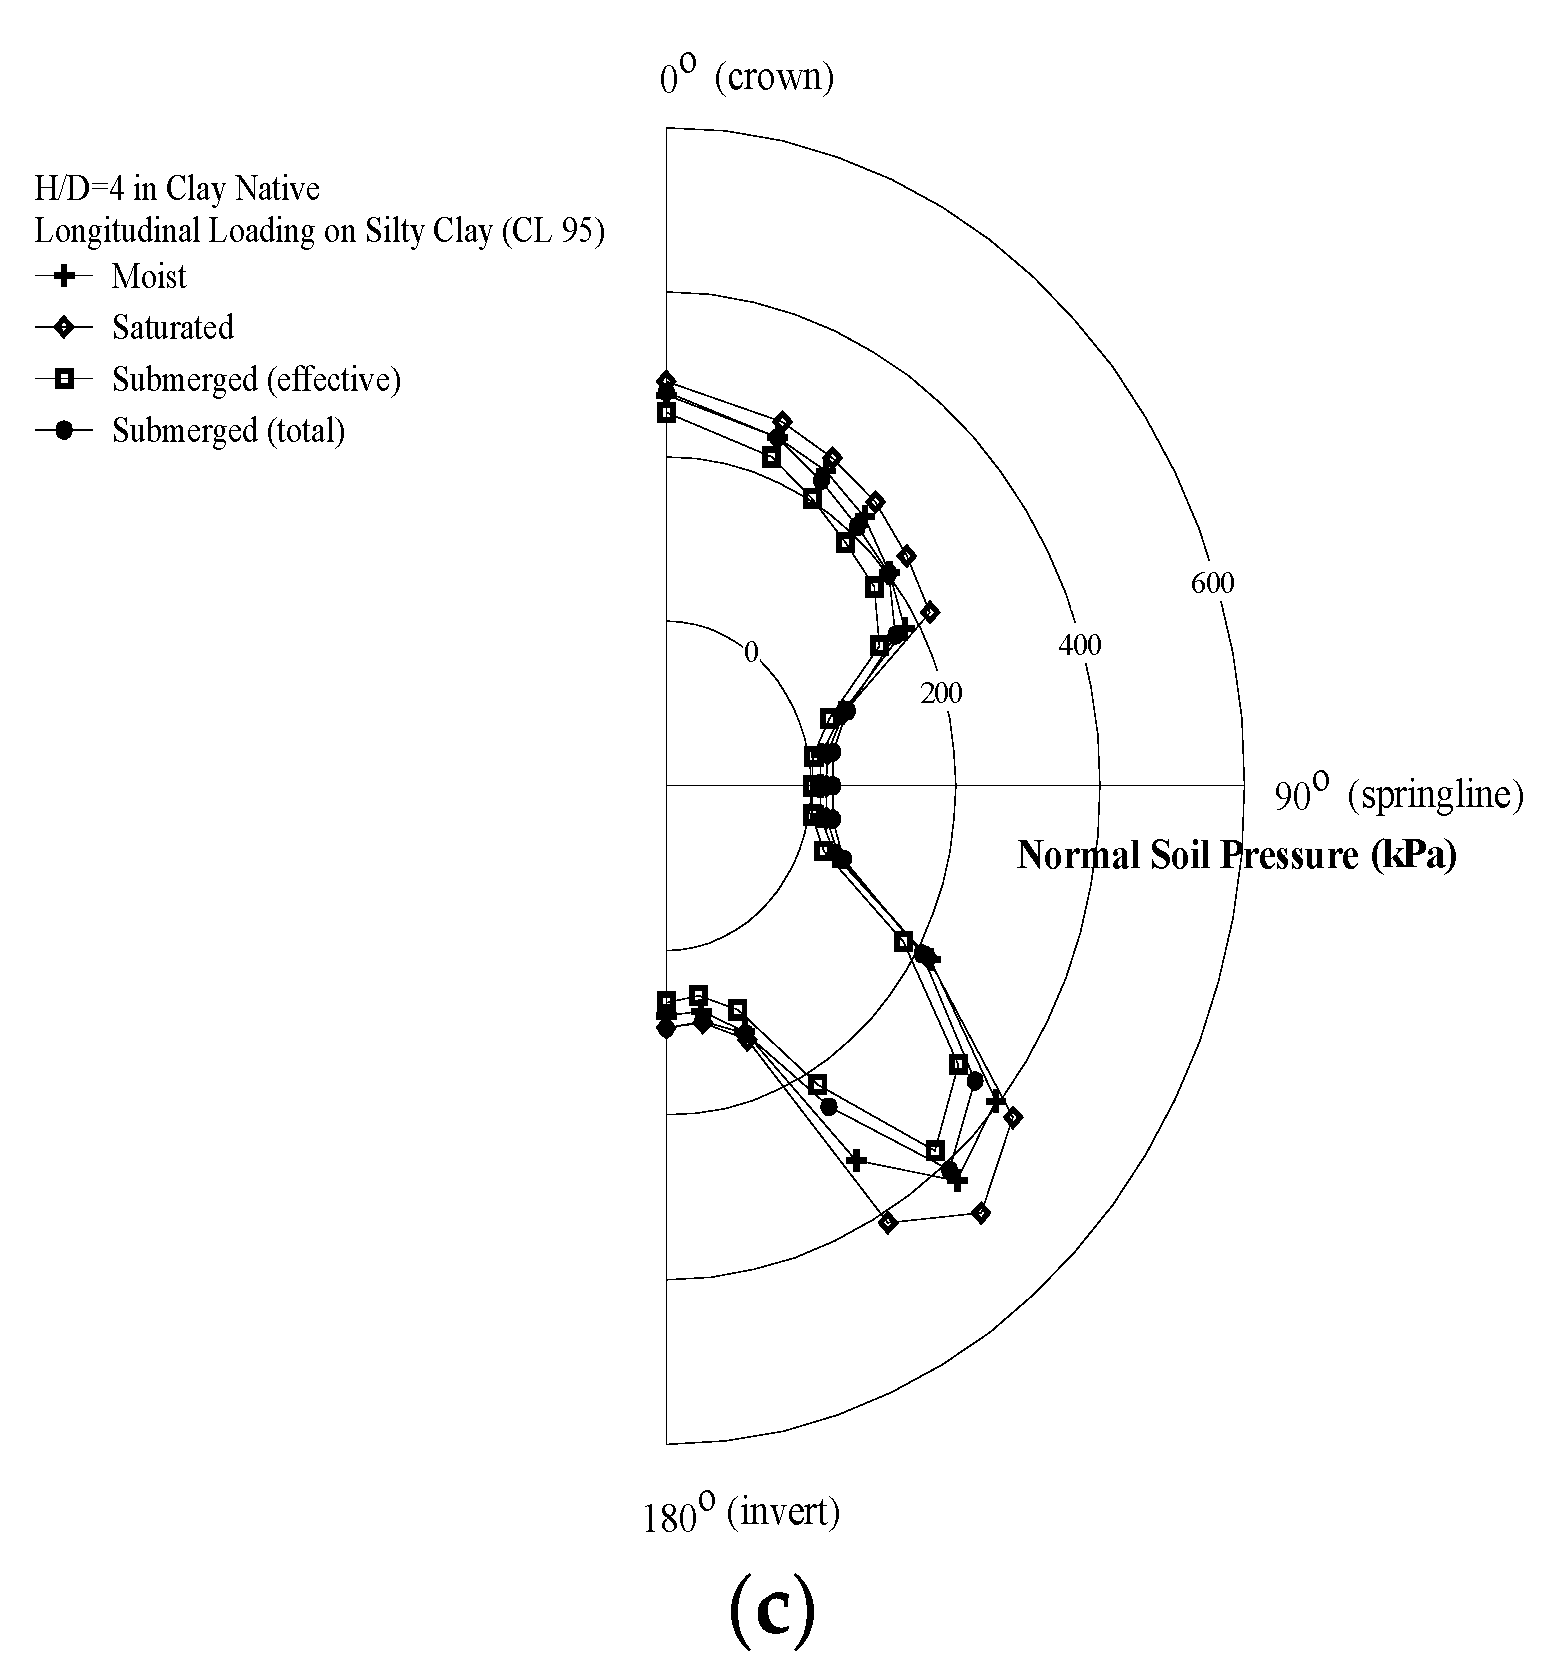
To simulate rapid drawdown conditions, analyses were performed on fully saturated soils without a groundwater table. The saturated unit weight of the soil was then used in place of the dry unit weight. Since soil pressures are computed in terms of total stress, the pore-water pressure was subtracted from the computed soil pressures to obtain the effective stresses. The normal soil pressure distributions for moist, saturated, and submerged conditions under longitudinal loading are presented in
Figure 6 for different backfill materials. The backfill materials are gravelly sand, silty sand, and silty clay in
Figure 6a–c, respectively. All three backfill materials were deposited in native clay soil. Each figure contains four curves for the three conditions because there are two curves for the submerged condition: one for the effective stress and one for the total stress.
As shown in
Figure 6, the average normal soil pressures are affected by the presence of the groundwater table. The effective soil pressure in the submerged condition is the lowest in terms of effective stress among the three conditions. However, below the lower haunch, the soil pressure in terms of total stress gradually surpasses the other three values because the pore water pressure increases with depth. The normal soil pressure distributions exhibit similar trends, regardless of the backfill material.
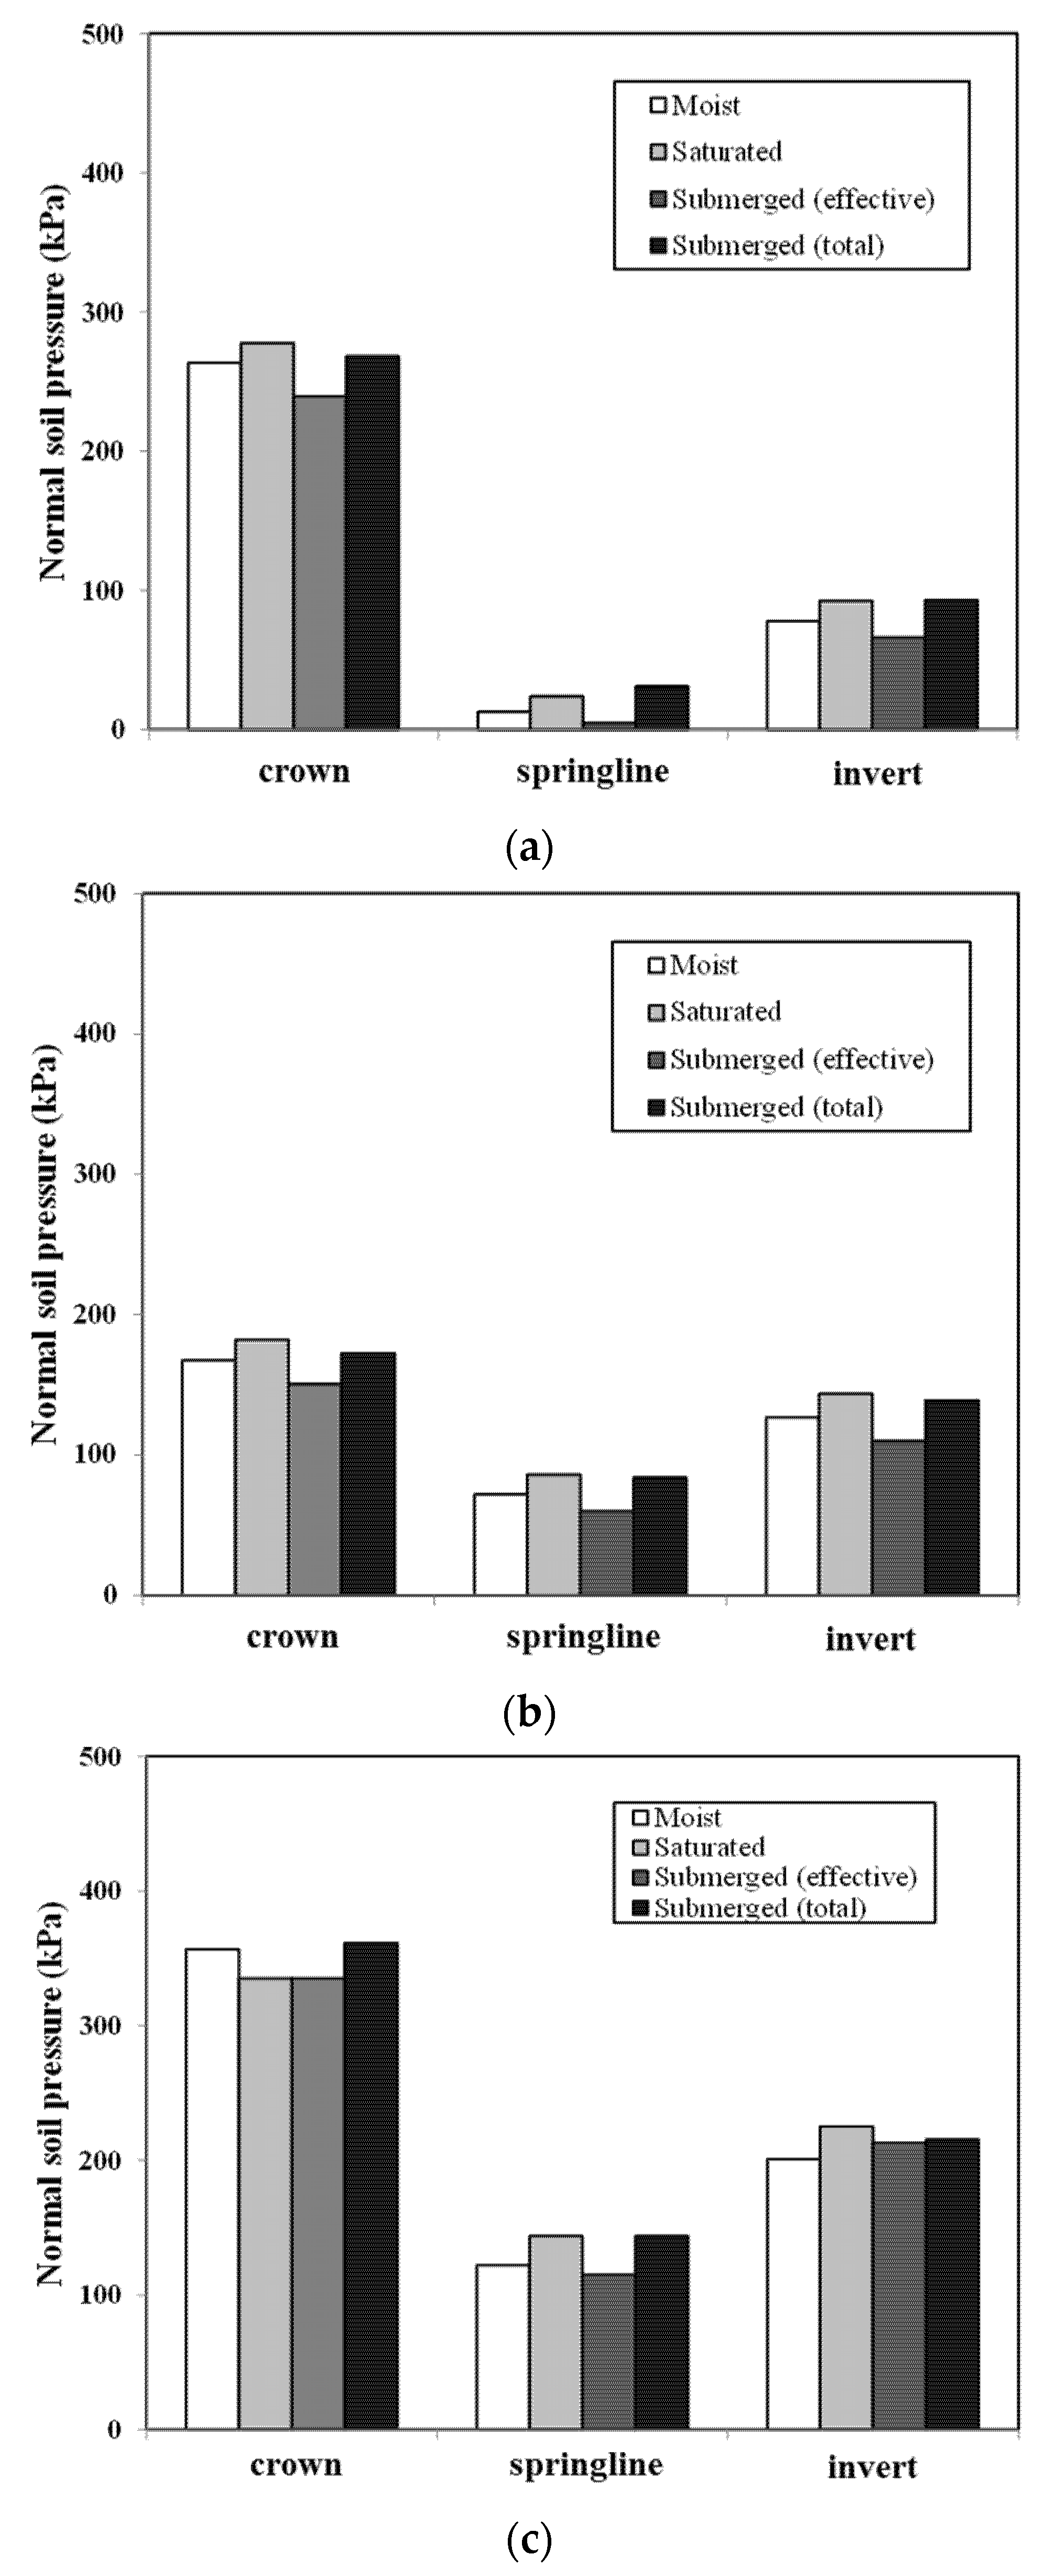
A comparison of the normal soil pressures (effective and total) for moist, saturated, and submerged conditions at the crown, springline, and invert under the three different loading conditions (longitudinal, transverse, and uniform loading) is presented in
Figure 7. Here, the trench is filled with silty clay. As shown in
Figure 7a, the total normal pressure under the submerged condition is slightly lower than that under the saturated condition at the crown but is higher at both the springline and invert. Therefore, the presence of the groundwater table increases the normal soil pressure at both the springline and invert. In
Figure 7b, it appears that under transverse loading, the soil pressures in terms of effective stress are the lowest for the submerged condition at all three analyzed locations. At the springline and invert, the soil pressures are the highest in terms of total stress for the submerged condition. For the uniform loading condition,
Figure 7c reveals a similar trend; however, the pressure magnitude varies with the loading condition. Among the three loading conditions presented in
Figure 7, the normal soil pressures are the highest under uniform loading at all locations, regardless of the presence of the groundwater table. The normal soil pressures under longitudinal loading are higher at both the crown and invert than those under transverse loading. However, the normal soil pressure under longitudinal loading is the lowest among the three loading conditions, primarily because the loading-induced lateral confining pressure on the pipe is the smallest under longitudinal surface loading.
Under longitudinal surface loading, the crack depth in the pipe wall is plotted versus the applied pressure for moist, saturated, and submerged conditions in
Figure 8. One can see that for the saturated condition, the crack that initiates in the intrados at the crown propagates outward to a distance of approximately 0.57 cm under 200 kPa of surface loading and approximately 2.86 cm under 500 kPa of surface loading. At the springline, the crack that initiates in the extrados under 300 kPa of surface loading propagates inward to approximately 5.33 cm under 500 kPa of surface loading. The crack that initiates in the intrados at the invert propagates outward to approximately 0.19 cm under 300 kPa of surface loading and approximately 1.33 cm under 500 kPa of surface loading. For the submerged condition, the crack that initiates in the crown propagates to the same depth through the pipe wall as that in the saturated condition under surface loads up to 425 kPa.
3.3. Void Effects
Voids are typically formed in the lower haunch area based on the difficulty of compaction during pipe installation. Voids may also form at other locations based on either exfiltration (leaking) or the infiltration of water into the pipe, which causes soil erosion. Regardless of the causes of void formation, the effect of voids on the buried concrete pipes’ behavior must be understood to assess the structural stability of pipe–soil systems. To consider the effects of void size and location on pipe behavior, three-dimensional analysis is required because plane–strain analysis is only valid when voids are continuous throughout the entire buried concrete pipe. In this study, analyses were conducted separately for voids at two different locations: at the invert and the haunch. We considered one void at the invert and a separate void on each side of the haunch. One void at the haunch is located from 130° to 150° measured clockwise from the crown and the other was in the same location in the counterclockwise direction. The voids have a width of 12 cm and a length of 90 cm in the longitudinal direction of the pipe. These void dimensions were selected arbitrarily.
Under the longitudinal loading condition, the effects of a void at the invert on the normal soil pressure distribution are presented in
Figure 9 for gravelly sand, silty sand, and silty clay backfills. One can see that the presence of a void at the invert reduces the normal pressures at the invert, as expected. There is no apparent influence on the soil pressures at either the crown or springline. Based on the presence of the void, there is no soil pressure immediately below the invert. It appears that the reduced soil pressure around the invert area is transferred to the haunch area, resulting in greater soil pressure around the haunch area, as illustrated in
Figure 9. Although
Figure 9a–c reveals similar patterns for the normal soil pressure distributions of all three trench materials, there is a significant difference in the pressure distribution at the haunch between the silty clay trench material and the other two materials. This can be attributed to the relatively high compressibility of silty clay (
Figure 9c) compared to silty sand (
Figure 9b) and gravelly sand (
Figure 9a). This higher compressibility leads to greater compression of the soil around the invert. As a result, the soil pressure at the haunch is significantly greater in silty clay than in either gravelly sand or silty sand.
The effects of a void at the haunch on the normal soil pressure distribution are presented in
Figure 9d for the gravelly sand backfill. As expected, the reduced soil pressure at the void is transferred to the adjacent soil on both sides of the void, resulting in greater soil pressure around the haunch area. There is little influence on the soil pressures at either the crown or springline. However, the soil pressure at the invert increases slightly based on the presence of a void at the haunch. This increased soil pressure at the invert can be attributed to the soil’s increased compression at the invert based on a loss of soil support at the haunch. Comparisons of the crack depths in the pipe wall with no voids and with a void at the invert are presented under different longitudinal surface loading intensities in
Figure 10.
One can see that at both the crown and springline, the presence of a void at the invert has very little effect on crack propagation through the wall. Both with and without a void at the invert, the crack that initiates in the intrados of the crown propagates outward to approximately 0.38 cm under 200 kPa of surface loading and approximately 1.90 cm under 500 kPa of surface loading. At the springline, the crack that initiates in the extrados reaches a depth of approximately 0.76 cm under 300 kPa of surface loading and propagates inward to approximately 1.54 under 500 kPa of surface loading. Without a void, cracks develop in the intrados at the invert under 300 kPa of surface loading and propagate outward to a depth of approximately 0.76 cm under 500 kPa of surface loading. However, with a void at the invert, no cracks develop, even under a surface load of 500 kPa. Comparisons of the crack depths with and without a void on each side of the haunch are presented for different loading intensities in
Figure 11.
One can see that the voids at the haunch significantly influence the crack propagation through the wall thickness. Both with and without voids at the haunch, cracks at the crown propagate to approximately 0.38 cm under 200 kPa of surface loading and approximately 1.90 cm under 500 kPa of surface loading. With voids at the haunch, the crack that initiates in the extrados at the springline propagates inward to approximately 0.76 cm under 300 kPa of surface loading and approximately 1.52 cm under 500 kPa of surface loading. Without voids, the cracks at the springline also propagate to approximately 0.76 cm under 200 kPa of surface loading but only reach 1.33 cm under 500 kPa of surface loading. Furthermore, without voids, cracks at the invert initiate under 300 kPa of surface loading and propagate to approximately 0.76 cm under 500 kPa of surface loading, whereas the cracks that form with voids at the haunch propagate to approximately 1.33 cm under 300 kPa of surface loading and approximately 2.10 cm under 500 kPa of surface loading. It is noteworthy that with voids at the haunch, the crack at the invert grows faster and deeper than that at the crown.
4. Conclusions
This study investigated the soil pressure distributions around buried concrete pipes and the crack propagation in pipe walls under various environmental conditions using the finite element method. To this end, intensive numerical simulations were conducted under various environmental conditions in terms of loading type (longitudinal, transverse, or uniform) and the presence of groundwater and voids. This study can provide a better understanding of the load transfer mechanisms to buried concrete pipes and the resulting soil pressure distributions around pipes, as well as the crack propagation in pipe walls. These results can be used as a basis for environment-aware concrete pipe design processes. The conclusions can be drawn in two ways i.e., soil pressure distribution around the pipe and crack propagation through the pipe wall.
For the soil pressure distributions depending on the loading types, the smallest and largest soil pressures occurred under transverse and uniform loads, respectively. The high soil pressures were caused by the high confining pressures under uniform loading. It was also observed that the soil pressures under longitudinal loading were nearly zero based on the mobilization of shear resistance along the vertical interface between the trench wall and native soil.
For the presence of a groundwater table, the effective soil pressure for submerged conditions was the lowest among the three soil conditions (moist, saturated, and submerged). In the totally submerged condition, the pressure was slightly lower than that in the saturated condition at the crown but was higher at both the springline and invert, implying that the presence of a groundwater table increases the soil pressure at both of these locations.
The presence of a void at the invert only reduces soil pressure at the invert, and there is no distinct influence at either the crown or springline. However, the reduced soil pressure around the invert area is transferred to the haunch area, resulting in greater soil pressure around the haunch area. Similarly, reduced soil pressures are transferred to the adjacent soils on both sides of a void when a void is located at the haunch. This results in an increase in soil pressure at the invert.
For the crack propagation through the pipe wall, the first crack initiated at the crown, followed by the springline, and then the invert for all conditions. However, the cracks at the invert were not observed when there was a void at the invert. This may be because a void at the invert reduces the normal soil pressure and acts as a cushion. Additionally, the induced hoop stress did not reach the crushing stress during compression for any of the conditions analyzed in this study.
Lastly, the cracks that initiate at both the crown and springline propagate the deepest through the pipe wall thickness under the submerged condition. The cracks that initiate at the invert propagate the deepest under other conditions with voids at the haunch.


