
Edge Computing Based on Federated Learning for Machine Monitoring


1
Department of Information Management, Hsuan Chuang University, Hsinchu 300, Taiwan
2
Department of Visual Communication Design, Hsuan Chuang University, Hsinchu 300, Taiwan
3
School of Mathematics and Information Engineering, Longyan University, Fujian 364012, China
4
Department of Computer Science & Information Management, Soochow University, Taipei 111, Taiwan
*
Author to whom correspondence should be addressed.
Appl. Sci. 2022, 12(10), 5178; https://0-doi-org.brum.beds.ac.uk/10.3390/app12105178
Submission received: 10 April 2022
/
Revised: 14 May 2022
/
Accepted: 17 May 2022
/
Published: 20 May 2022
(This article belongs to the Special Issue Edge Computing with AI)
Abstract
:This paper focused on providing a general solution based on edge computing and cloud computing in IoT to machine monitoring in manufacturing of small and medium-sized factory. For real-time consideration, edge computing and cloud computing models were seamlessly cooperated to perform information capture, event detection, and adaptive learning. The proposed IoT system processed regional low-level features for detection and recognition in edge nodes. Cloud-computing including fog computing was responsible for mid- and high-level features by using the federated learning network. The system fully utilized all resources in the integrated deep learning network to achieve high performance operations. The edge node was implemented by a simple camera embedded on Terasic DE2-115 board to monitor machines and process data locally. Learning-based features were generated by cloud computing through the data sent from edge and the identification results could be obtained by combining mid- and high-level features with the nonlinear classifier. Therefore, each factory could monitor the real-time condition of machines without operators and keep its data privacy. Experimental results showed the efficiency of the proposed method when compared with other methods.
1. Introduction
Industry 4.0 drives a new revolution in manufacturing; thus, many factories are looking for new solutions to ensure their productivity and competitiveness. Unfortunately, it is very difficult to introduce new machines to meet the immediate requirements under the consideration of capital and machine compatibility of the current situation in small and medium-sized factories (SMSFs). Replacing current operators with automated technology to monitor machine status is a great method to make quality products and maximize outputs in SMSF. Capturing real-time data from sensors can assist SMSF in making decisions, providing insights and specific actions. Sensors and the corresponding system can further take over operators and automate tasks that previous industrial revolutions could not handle.
The Internet of Things (IoT) is a new technology under the rapid development of the internet in recent years [1]. In IoT, objects, things, and cloud administrations are connected by means of networks and work together to produce high efficiency [2]. Each smart object in IoT is well organized, properly managed, and safely controlled for many intelligent applications in our daily lives [3]. Since IoT has been successfully applied in health care [4], agriculture [5], smart cities [6,7], and other applications [8,9], the development of IoT technology can also be used to help SMSF move toward Industry 4.0. Today, IoT refers more specifically to interconnected devices that combine sensors, software, and advanced technologies to transmit and receive data from the target. Edge computing is a distributed computing that integrates intelligence into edge devices in IoT. They are also often referred to as edge nodes because they can process and analyze data in real-time near the source of data collection. In edge computing, data do not need to be uploaded directly to the cloud or to a centralized data processing system [10].
M. Iliyas et al. [11] provided an article to introduce the current manufacturing industries and computer numerical control tool for machine production in factories. They also provided a brief review of machine monitoring and the summary of investments for machine monitoring in different countries. It showed the importance of the research needs for machine monitoring. Quasi-arithmetic means were proposed by B. Hou et al. for machine monitoring. They investigated several measuring tools based on Quasi-arithmetic means to measure the machine conditions [12]. However, the data of machine condition should be collected by using the standard interface of the machine. For some machines of different ages, it is almost impossible to build a standard interface under cost considerations.
Various artificial intelligence algorithms are designed to imitate human thinking and simulate recognition systems. By using various mathematical models and sufficient training data, it presents its ability to learn, recall, and inductively perform deduction. In addition, it has good results in dealing with image recognition, classification, normalization, optimization, and other problems. Currently, computer vision technology is very useful in recognizing objects with camera sensors in IoT [13,14,15]. Convolutional Neural Network (CNN) is a feedforward neural network for which its artificial neurons can respond to units within a partial coverage area and produce better results in computer vision and image processing. The network architecture of CNN usually includes multiple layers such as the input layer, convolution layer, and pooling layer. Among them, multiple convolutional layers or pooling layers can be repeated to achieve the purpose of deep learning. Finally, the training of the fully connected layer is added to achieve the prediction result of the output layer. If a large amount of training data can be matched, there will usually be a better identification result. Deep learning makes computer vision more robust for solving real problems such that IoT will also be more intelligent [16,17]. However, high accuracy in computer vision requires powerful computing power, which is not an easy task that edge nodes can afford. There are many types of machine control panels, and displayed data are mixed and diversified, which often causes difficulties in computer vision technology. H. Yun et al. [18] developed a CNN model from the spectrograms of sound to establish machine monitoring technology. Two stethoscope sensors were used to capture the sound information about the environment of machines. The authors also applied Short-Time Fourier Transform to analysis spectrograms of sound to solve the problem of factory noise.
Currently, deep learning models are usually deployed on cloud servers under the consideration of computing power. However, in this manner, the collected data need to be transmitted to the cloud to perform event detection tasks. It often leads to delays in the cloud computing model, communication costs, and privacy issues, and the task cannot be achieved in time. Machine-to-machine service platform had been proposed to enable the communication of end devices. Through the cooperation of end nodes, this mechanism can effectively reduce the network traffic and speed up overall performances [19]. Edge computing attempts to deploy the decision-making model to the terminal device. Due to the shortage of the end device in computing power and storage, only simple machine learning can be performed, and high accuracy may not be obtained in the end.
In preliminary research, it is observed that the supervisors of the production machine control department generally believe that integrating digital platforms through the IoT system can help supervisors and operators to keep an eye on the production process, detect the occurrence of abnormal events, improve the efficiency of production machines, and optimize the production process. Most of these factories have more than ten kinds of production machines. The time of purchasing the machine equipment may vary a long period, and the brands and functions are also different. Therefore, there are considerable differences in machine control methods or status display panels. In order to complete the digital upgrade of different equipment, additional sensors and IoT technology are normally used to collect real-time production status data of machine equipment. The integrated system can analyze the data, predict the moment when the machine may fail, or detect problems in real time. This also includes preventing abnormal events such as machine equipment crash or even to the blockage of production materials, increase unnecessary costs, and affect the normal production capacity of the factory. Most existing approaches about machine monitoring focused on building a total solution of IoT to fit the needs of Industry 4.0. It would not be acceptable under cost considerations. To the best of our knowledge, many control panels of the machines for small- and medium-sized factories are standalone and do not have communication interfaces for transmitting data directly. It might violate the warranty or cause damage to the production machine if we install new communication interfaces on the control panel in a brute force manner. Therefore, we proposed vision-based IoT technology based on federated learning to solve the immediate machine monitoring problem.
This paper focused on providing a general solution based on edge computing and cloud computing in IoT for machine monitoring in the manufacture of small- and medium-sized factory. For real-time consideration, edge computing and cloud computing models were seamlessly cooperated to perform information capture, event detection, and adaptive learning. The proposed IoT system processed regional low-level feature for detection and recognition in edge nodes. The cloud computing including fog computing was responsible for mid- and high-level features by federated learning network. The system fully utilized all resources in the integrated deep learning network to achieve high performance operations. The edge node was implemented by a simple camera embedded on a Terasic DE2-115 board to monitor machines and process data locally. The learning-based features were generated by cloud computing through the data sent from edge, and the identification results could be obtained by combining mid- and high-level features with the nonlinear classifier. Therefore, each factory could monitor the real-time condition of machines without operators and retain data privacy. Experimental results showed the efficiency of the proposed method when compared with other methods.
2. The Background
2.1. Research Field
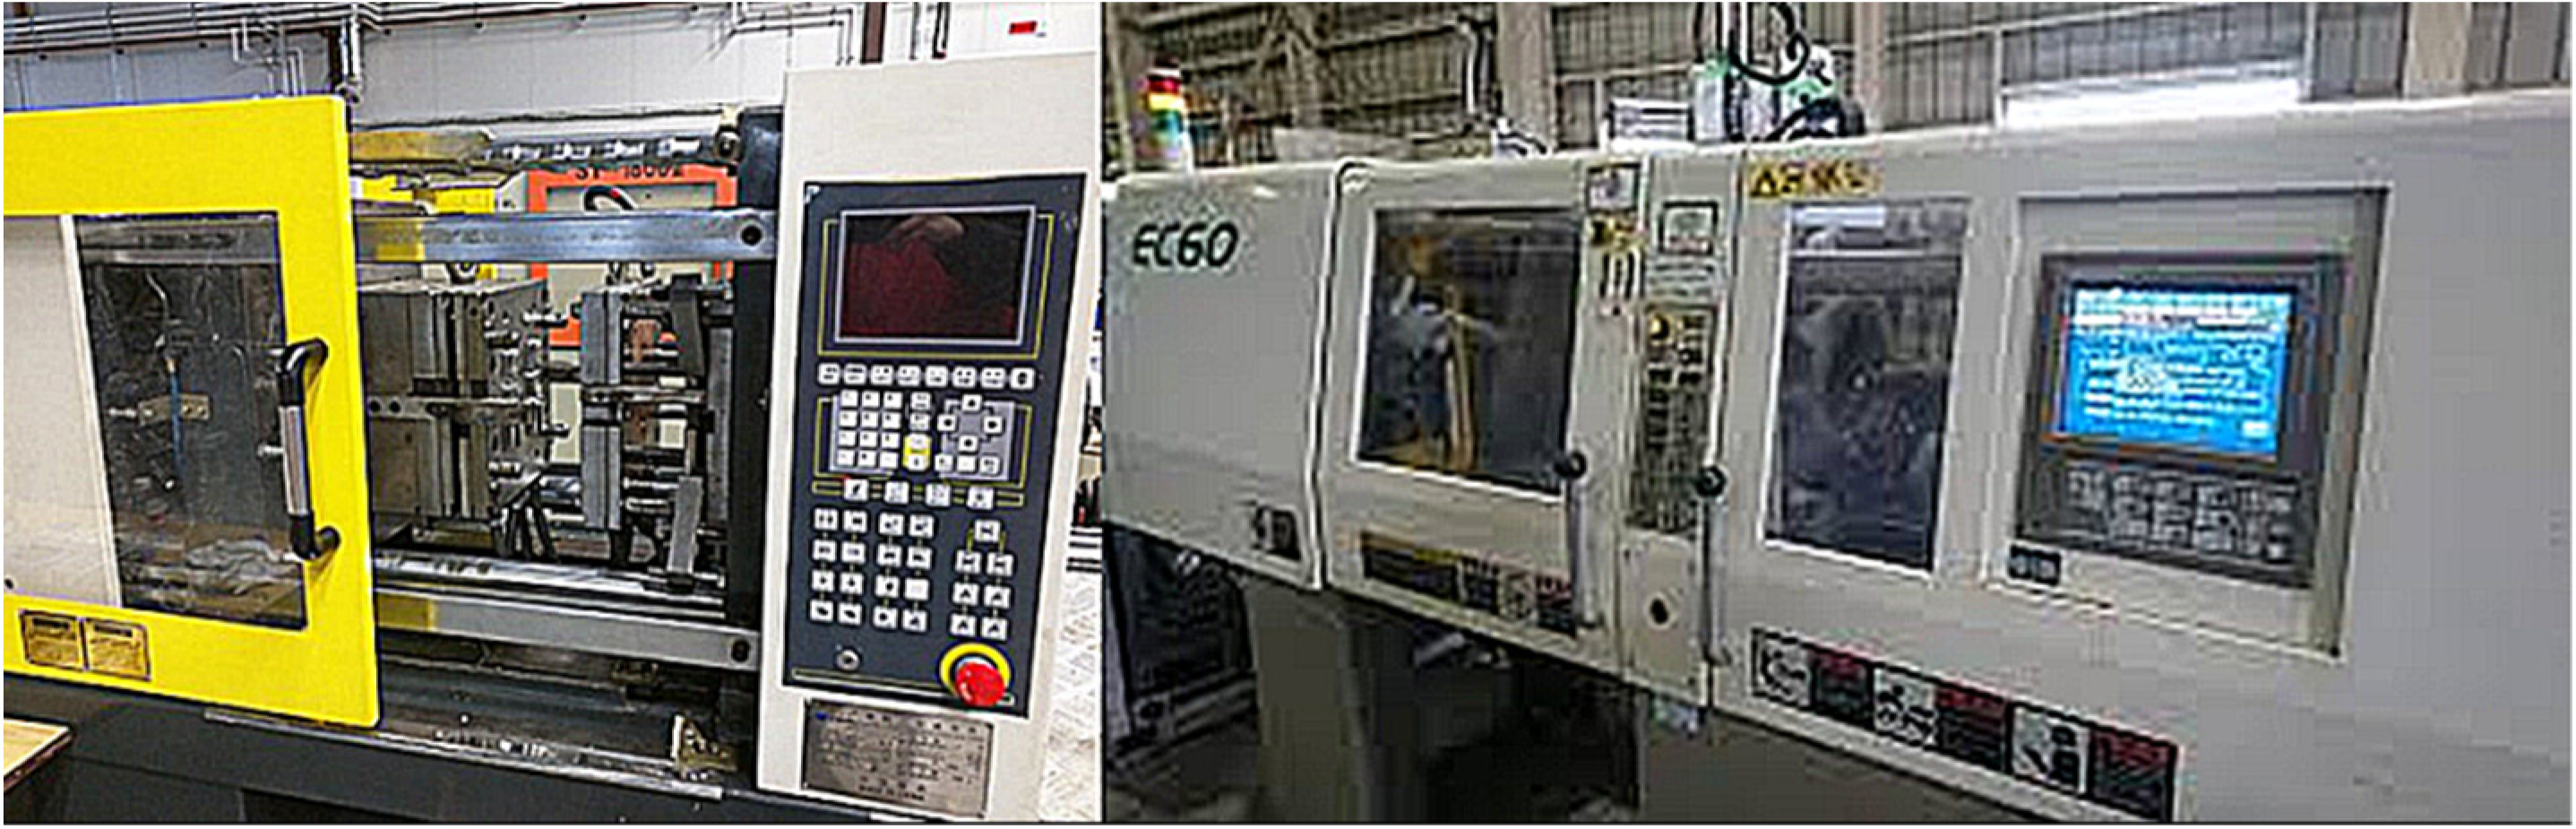
In this research, the IoT system was implemented in a SMSF with plastic injection machines. Because the factory gradually purchased new machines over time, it resulted in different types, panels, and control methods. It is impossible to widely distribute various sensors in production equipment, processes, and factory environment through IoT architecture, and we expect to collect and analyze data automatically. Four kinds of plastic injection machines of different ages in the factory are shown in Figure 1. Therefore, this research study adopts the method of computer vision technology to deploy IoT to assist business operators in understanding production lines and making further decisions.
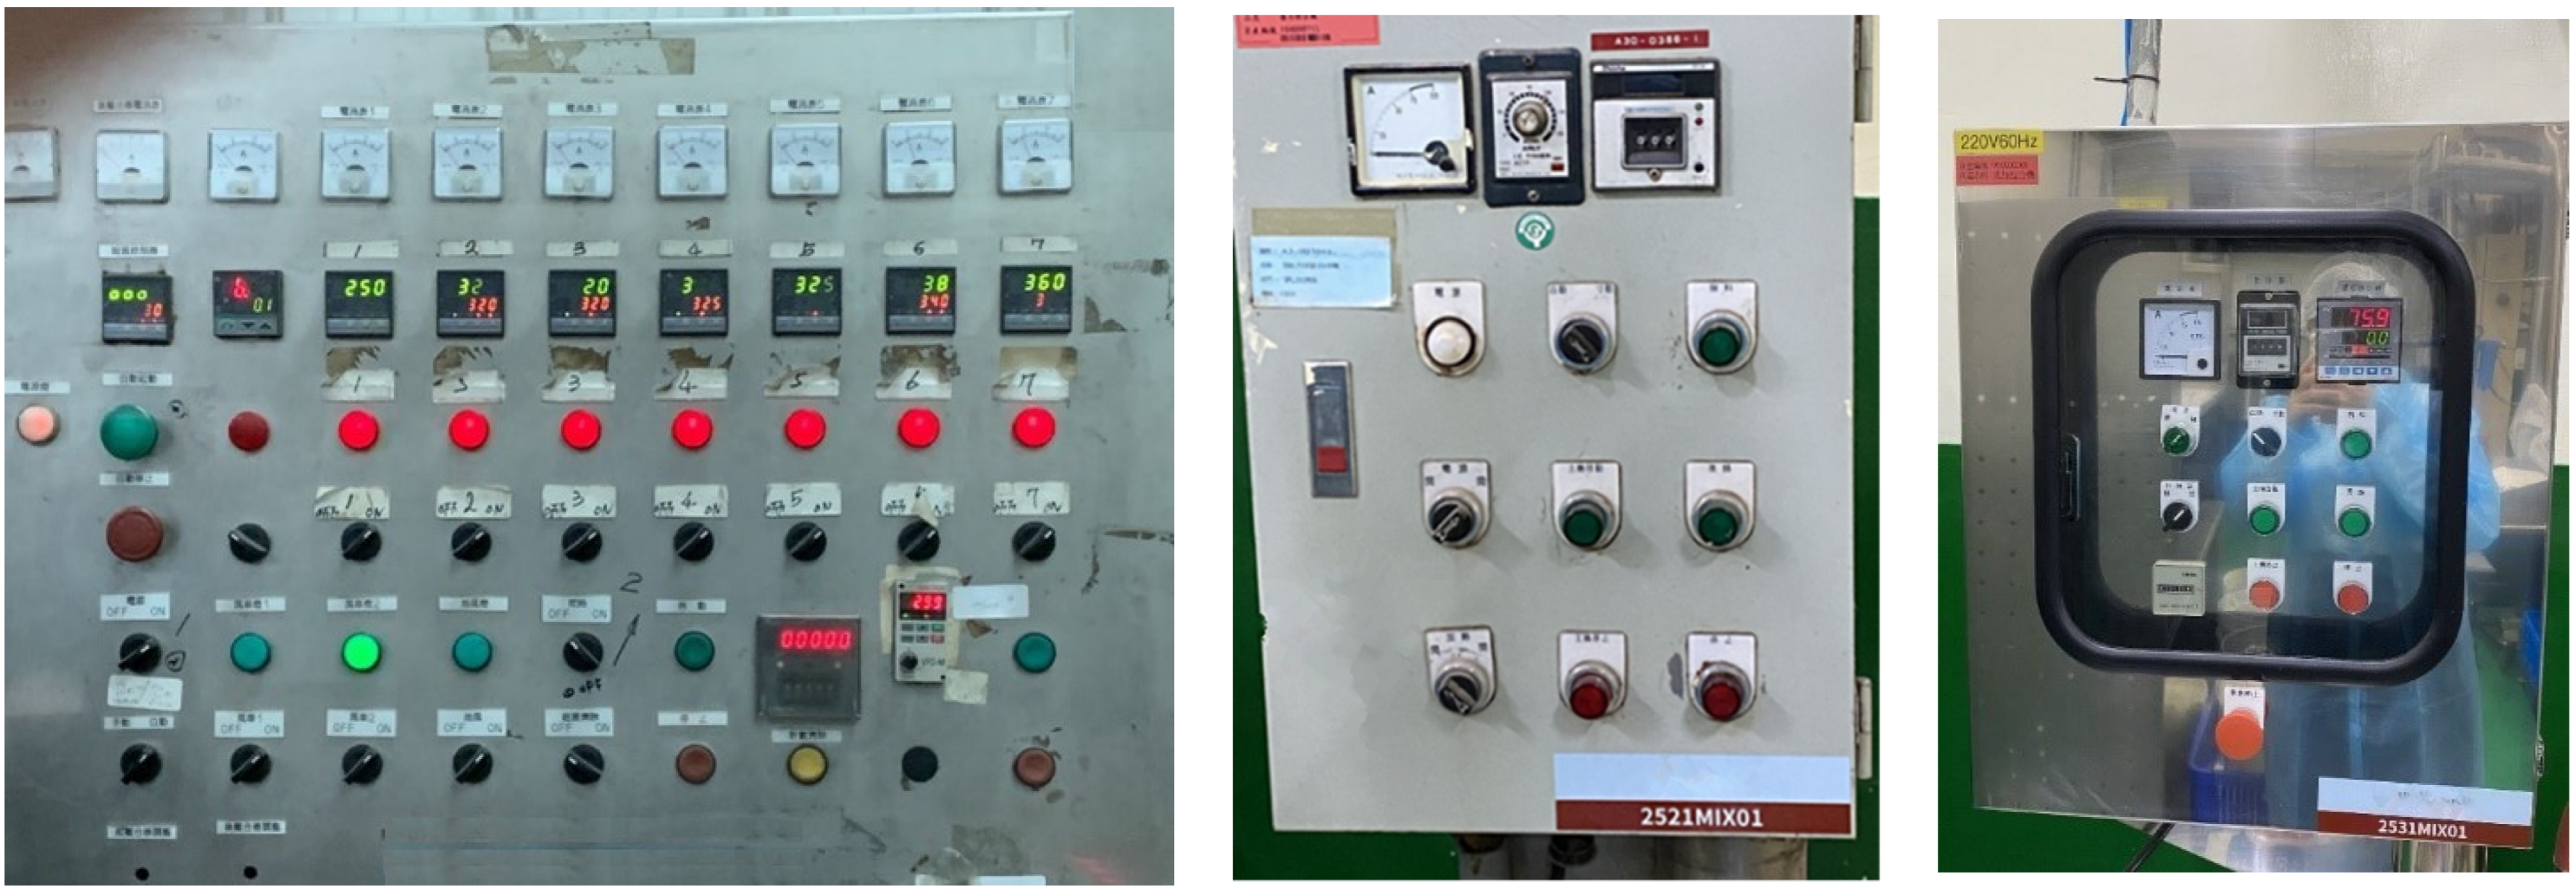
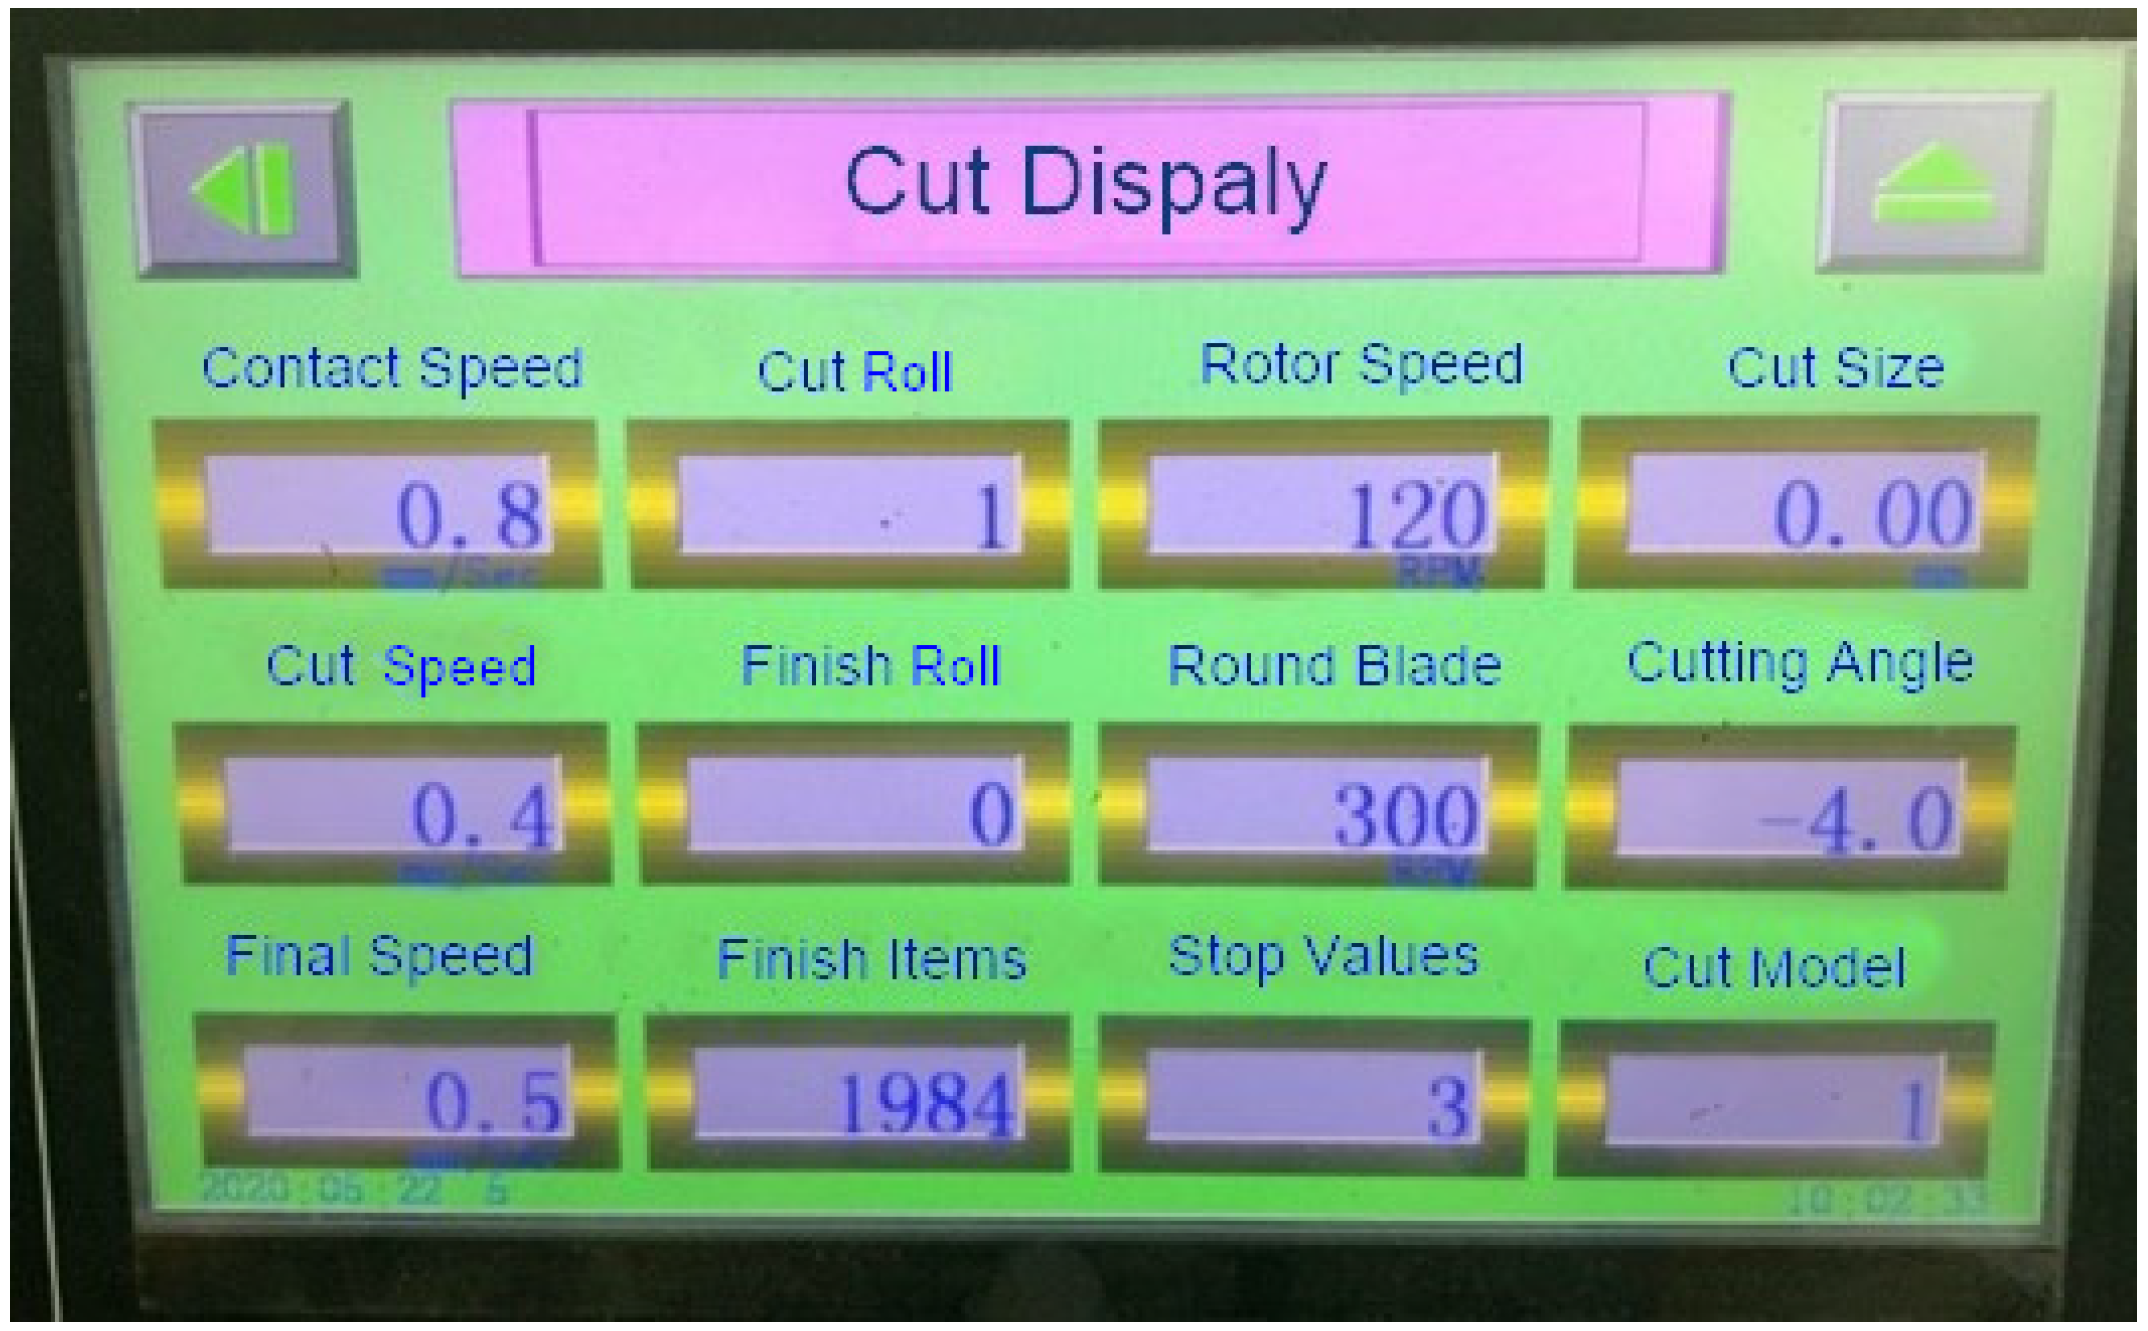
For a plastic injection molding machine, it integrates clamping, injection, dwelling, cooling, mold opening, and the removal of products to produce a plastic product. Parameter settings and the control of each step needs to be strictly controlled. Otherwise, it is easy to produce defective products and cause damage to the machine. Programmable Logic Controller (PLC) has been widely used in various control systems and plays the core control task in factory automation control. The PLC display screens of machines of different generations or models will be very different. Six types of PLC display screens are shown in Figure 2 and Figure 3. Figure 2 shows the control panel of the traditional machine equipment, which includes the knob switch status, pointer meter, status lights, LED digital lights, mechanical counters, and explanatory texts, etc. Figure 3 shows the new control panel of LCD screen. Light signals, numbers, pointers, bar graphs, dynamic code tables, flow charts, and related texts are included on the screen. It is obvious that two kinds of panels are completely different.
The information on the PLC panels generally corresponds to parameters about time, speed, temperature, pressure, and measurement. They are represented by the original threshold setting and the current condition of the machine. If the difference between the current situation and the threshold parameter is too large, it means that an abnormal event occurs. Combining panel information captured by cameras and IoT monitoring mechanism can prevent abnormal events and increase productivity. For example, when the pressure is too high, the plastic material is easy to overflow from the mold and produce deformed products. If the system can immediately detect this situation from the PLC screen and find that the temperature is too low, the system can reduce the feeding pressure and increase mold temperature in time. Increasing the rate of melting plastic materials can effectively prevent the situation of overflow and reduce the probability of defective products.
2.2. The IoT Architecture
Broadly speaking, the IoT includes any “thing” that can be connected to the internet to work together for application requirements. From factory equipment, cars, mobile devices, and smart watches are all members of the IoT. Today’s IoT, however, refers more specifically to interconnected devices that combine sensors, software, and other technologies to transmit and receive data from other devices. Connectivity is primarily achieved through Wi-Fi, and 5G and other types of networking platforms have gradually developed the speed and reliability to handle large data sets [20,21].
Digital image analysis tools have been developed for many years. By using feature modeling, image feature labels can be clearly compared by using a computer for intelligent learning and training. However, in the application of this study, it is still necessary to extract image information in a state of good resolution with no interference in terms of information [22,23,24]. For the environment of traditional large-scale automated production equipment in intelligent manufacturing, traditional LED lights are used to display numerical information, but interference such as flickering lights will affect image recognition results and cause misjudgment. In this study, combined with the deep learning analysis of images, an integrated monitoring system of the Internet of Things was established. After images are taken, the feature sets of each image are extracted and compared with the previous one. The results are returned through cloud and fog computing technology for subsequent business management applications combined with the ERP system.
2.3. Federated Learning
Traditional machine learning algorithms need large computing power such that they usually use a centralized data processing method in the cloud. However, algorithms will fail to meet the requirements of data specifications, such as data privacy and data protection issues. With the development of 5G IoT technology, the performance requirements of distributed computing for transmission bandwidth between devices and the application requirements for fog computing are also increasing. Most factory managers are concerned about leaking confidential information about the production process. The traditional centralized machine learning techniques had to upload all local datasets to the server. Since the cloud of the proposed IoT system is outside the factory, federated learning helped the system hold local data samples without exchanging them while training models. Since federated learning trained the decision model across multiple decentralized system of factories holding local data samples without exchanging them, it could keep data privacy for the real production of the factory.
Federated Learning (FL) is a decentralized deep learning framework that enables privacy-preserving training of models to work with a wide variety of clients in an actual cellular network [25]. The FL protocol iteratively asks random clients to download a trainable model from the server, updates the model with their own data parameters, and then uploads the locally updated model to the server. After receiving different models from clients, the server aggregates multiple client updates to further improve the model. Currently, federated learning helps fog computing in playing a positive role in performance improvement and transmission efficiency of distributed processing [26]. Although clients in this protocol do not need to open their own private data, the overall training process becomes inefficient when some clients require long update times or long upload times because of computation or communication problems. Recently, some modifications of the FL algorithm were proposed to solve the problems. It is believed that more achievements for the solution in the IoT will appear in the future.
The first step is the formulate topology. We have to decide how to centralize or decentralize, which includes the order and rules of communication, the direction of information flow, and model convergence. Next, each node will first perform gradient calculation based on saved local data set of its own. The method of gradient calculation will be very different based on topology and algorithm, and may also require specific data processing first. This is an important research topic for federated learning. After the parameter update step is completed, the gradient is transmitted based on topology. For a centralized model, the gradient is first aggregated in the parameter server and then distributed to each node. In the proposed paper, the parameter server will be the fog node. For the decentralized models, gradients are transmitted to adjacent nodes or designated nodes, and gradients are encrypted before exchanging to ensure that gradients do not lead to privacy problem. After model parameters are sent to the server, a weight is given according to the number of samples contained in the selected local node. Multiply the model for each local node by the weights and sum up the results. The summed model parameters are the new server model. These processes are repeated until the entire federated learning system is trained. When the two models are aggregated and averaged, they have the opportunity to readjust their positions, leaving the local minimum and approaching closer to the global minimum, because they update parameter by following similar paths or directions [27]. Fog computing based on FL deep learning includes both end devices and the cloud server.
Because the factory environment is complex and the production line changes frequently, the noise of the captured images increased. IoT in factory environments require dynamic learning to update models. Using FL deep learning can dynamically learn and update the model according to the dynamic state of the end node in IoT. Under the protection of factory confidential information, the system integrates multiple data and predicts abnormal events on cloud servers.
3. System Design for Edge Computing in IoT
3.1. The Architecture of the Proposed System
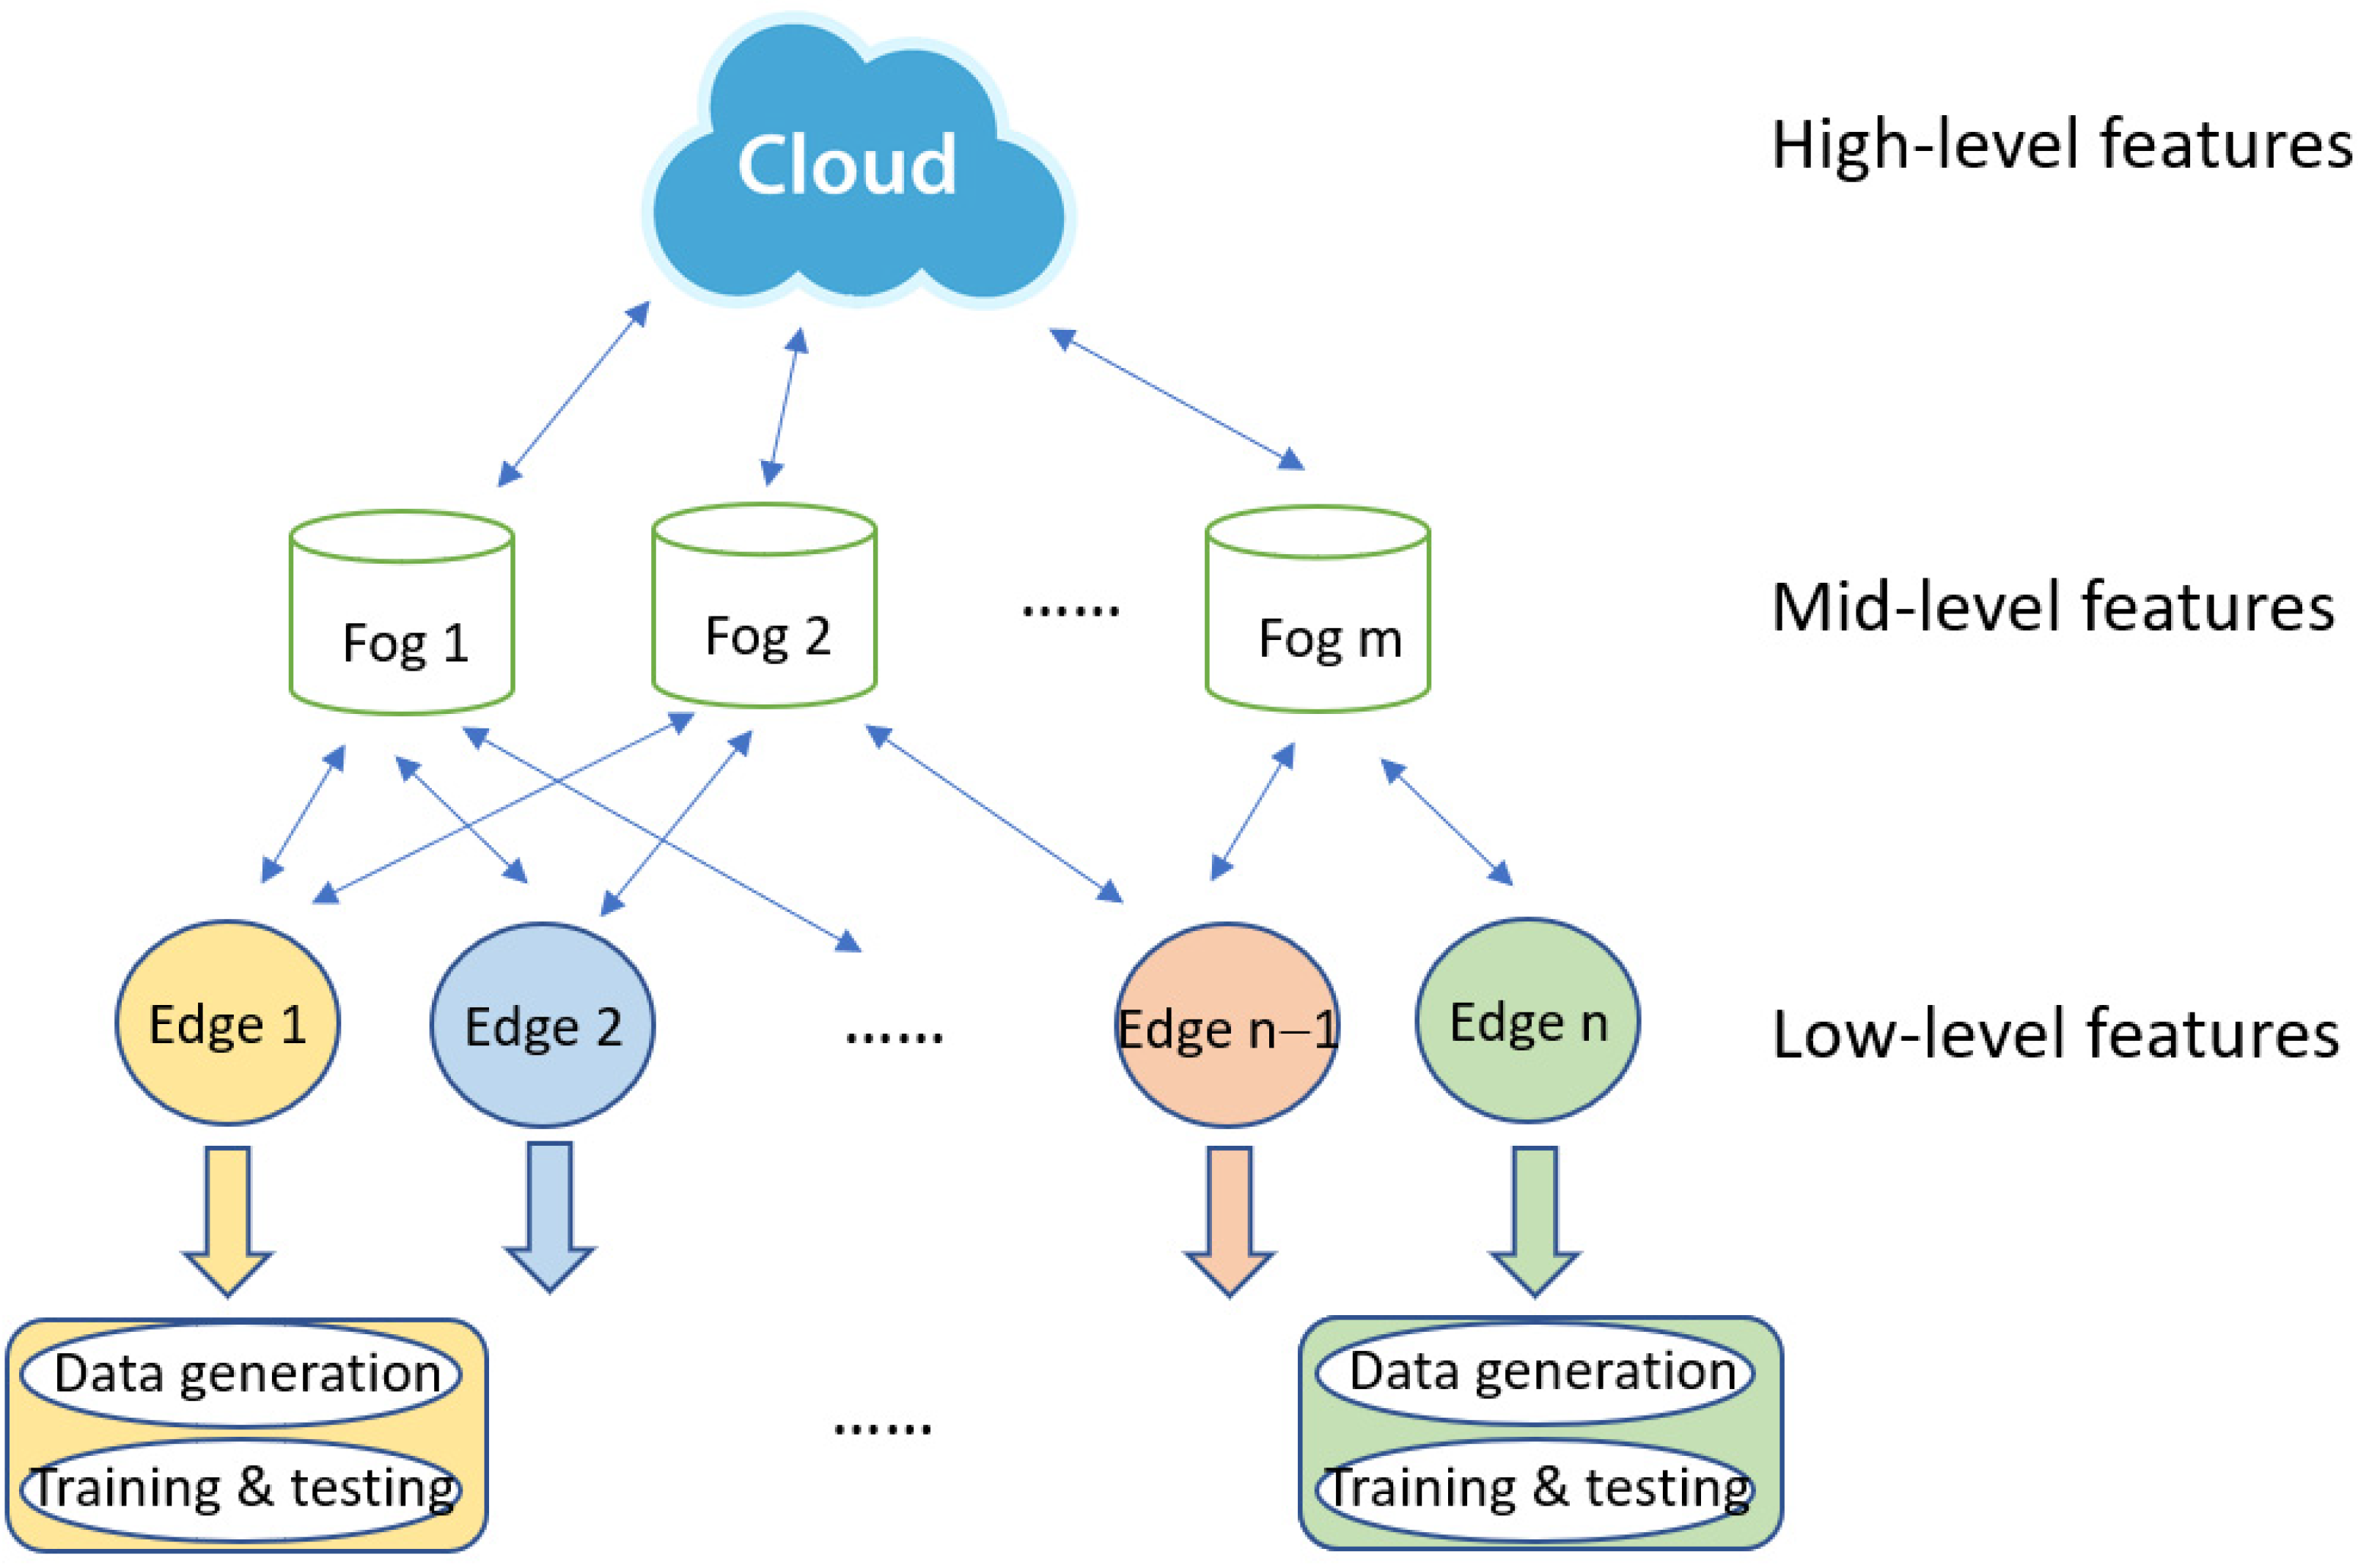
The Industry 4.0 trend is bringing many new applications that require low latency and network independence. This can only be provided through edge processing in IoT. These cases include computer vision for machine monitoring. It can be further accelerated and improved by incorporating machine learning inference on embedded systems. In this paper, we propose a three-layer IoT system to perform computer vision for machine monitoring, which includes edge layer, fog layer, and the cloud layer. The architecture of the proposed system is shown in Figure 4.
The first layer captures images for data generation and training/testing for low-level features. The low-level features in the image include color, texture, line, shape, etc. Although these multiple features can obtain the most direct panel information, the images obtained in the factory environment are highly variable, and the degree of variation will affect subsequent identifications. The large amount of generated data creates a huge burden on the cloud server, e.g., causing latency problems. Therefore, we added the fog node in the IoT as a middle layer placed between the cloud and the edge devices to assist the convergence of training and accelerate the transmission process. The fog node can be set in the factory’s own server. The method divides computing tasks and pushes them down to edge devices. It intelligently decomposes the computation of edge and fog nodes, which not only conforms to the distributed setting but also protects the user’s data privacy. Therefore, the mid-level features in the second layer are logical features in the image that can generate specific types of panel information objects through the identification results of low-level features. These objects can be combined into multiple logical features, including knobs, pointers, bar charts or pie charts, and other objects. The relationship between scale and length can be used for further logical reasoning feature identification. The strategy in the architecture is to reduce the training cost by applying local learning on edge devices and perform federated learning on fog nodes. This method successfully reduces the data samples, the communication costs of training models, and protects the user’s privacy. The final layer of the system is on the cloud with highest computing power, and it is responsible for high-level features in images. It generates semantic conceptual description for the behavior of objects, including digital recognition, text message recognition, or real-time production status flow charts, etc. They can be used to detect abnormal events and integrate multiple information and provide operators and manager the basis for decision making.
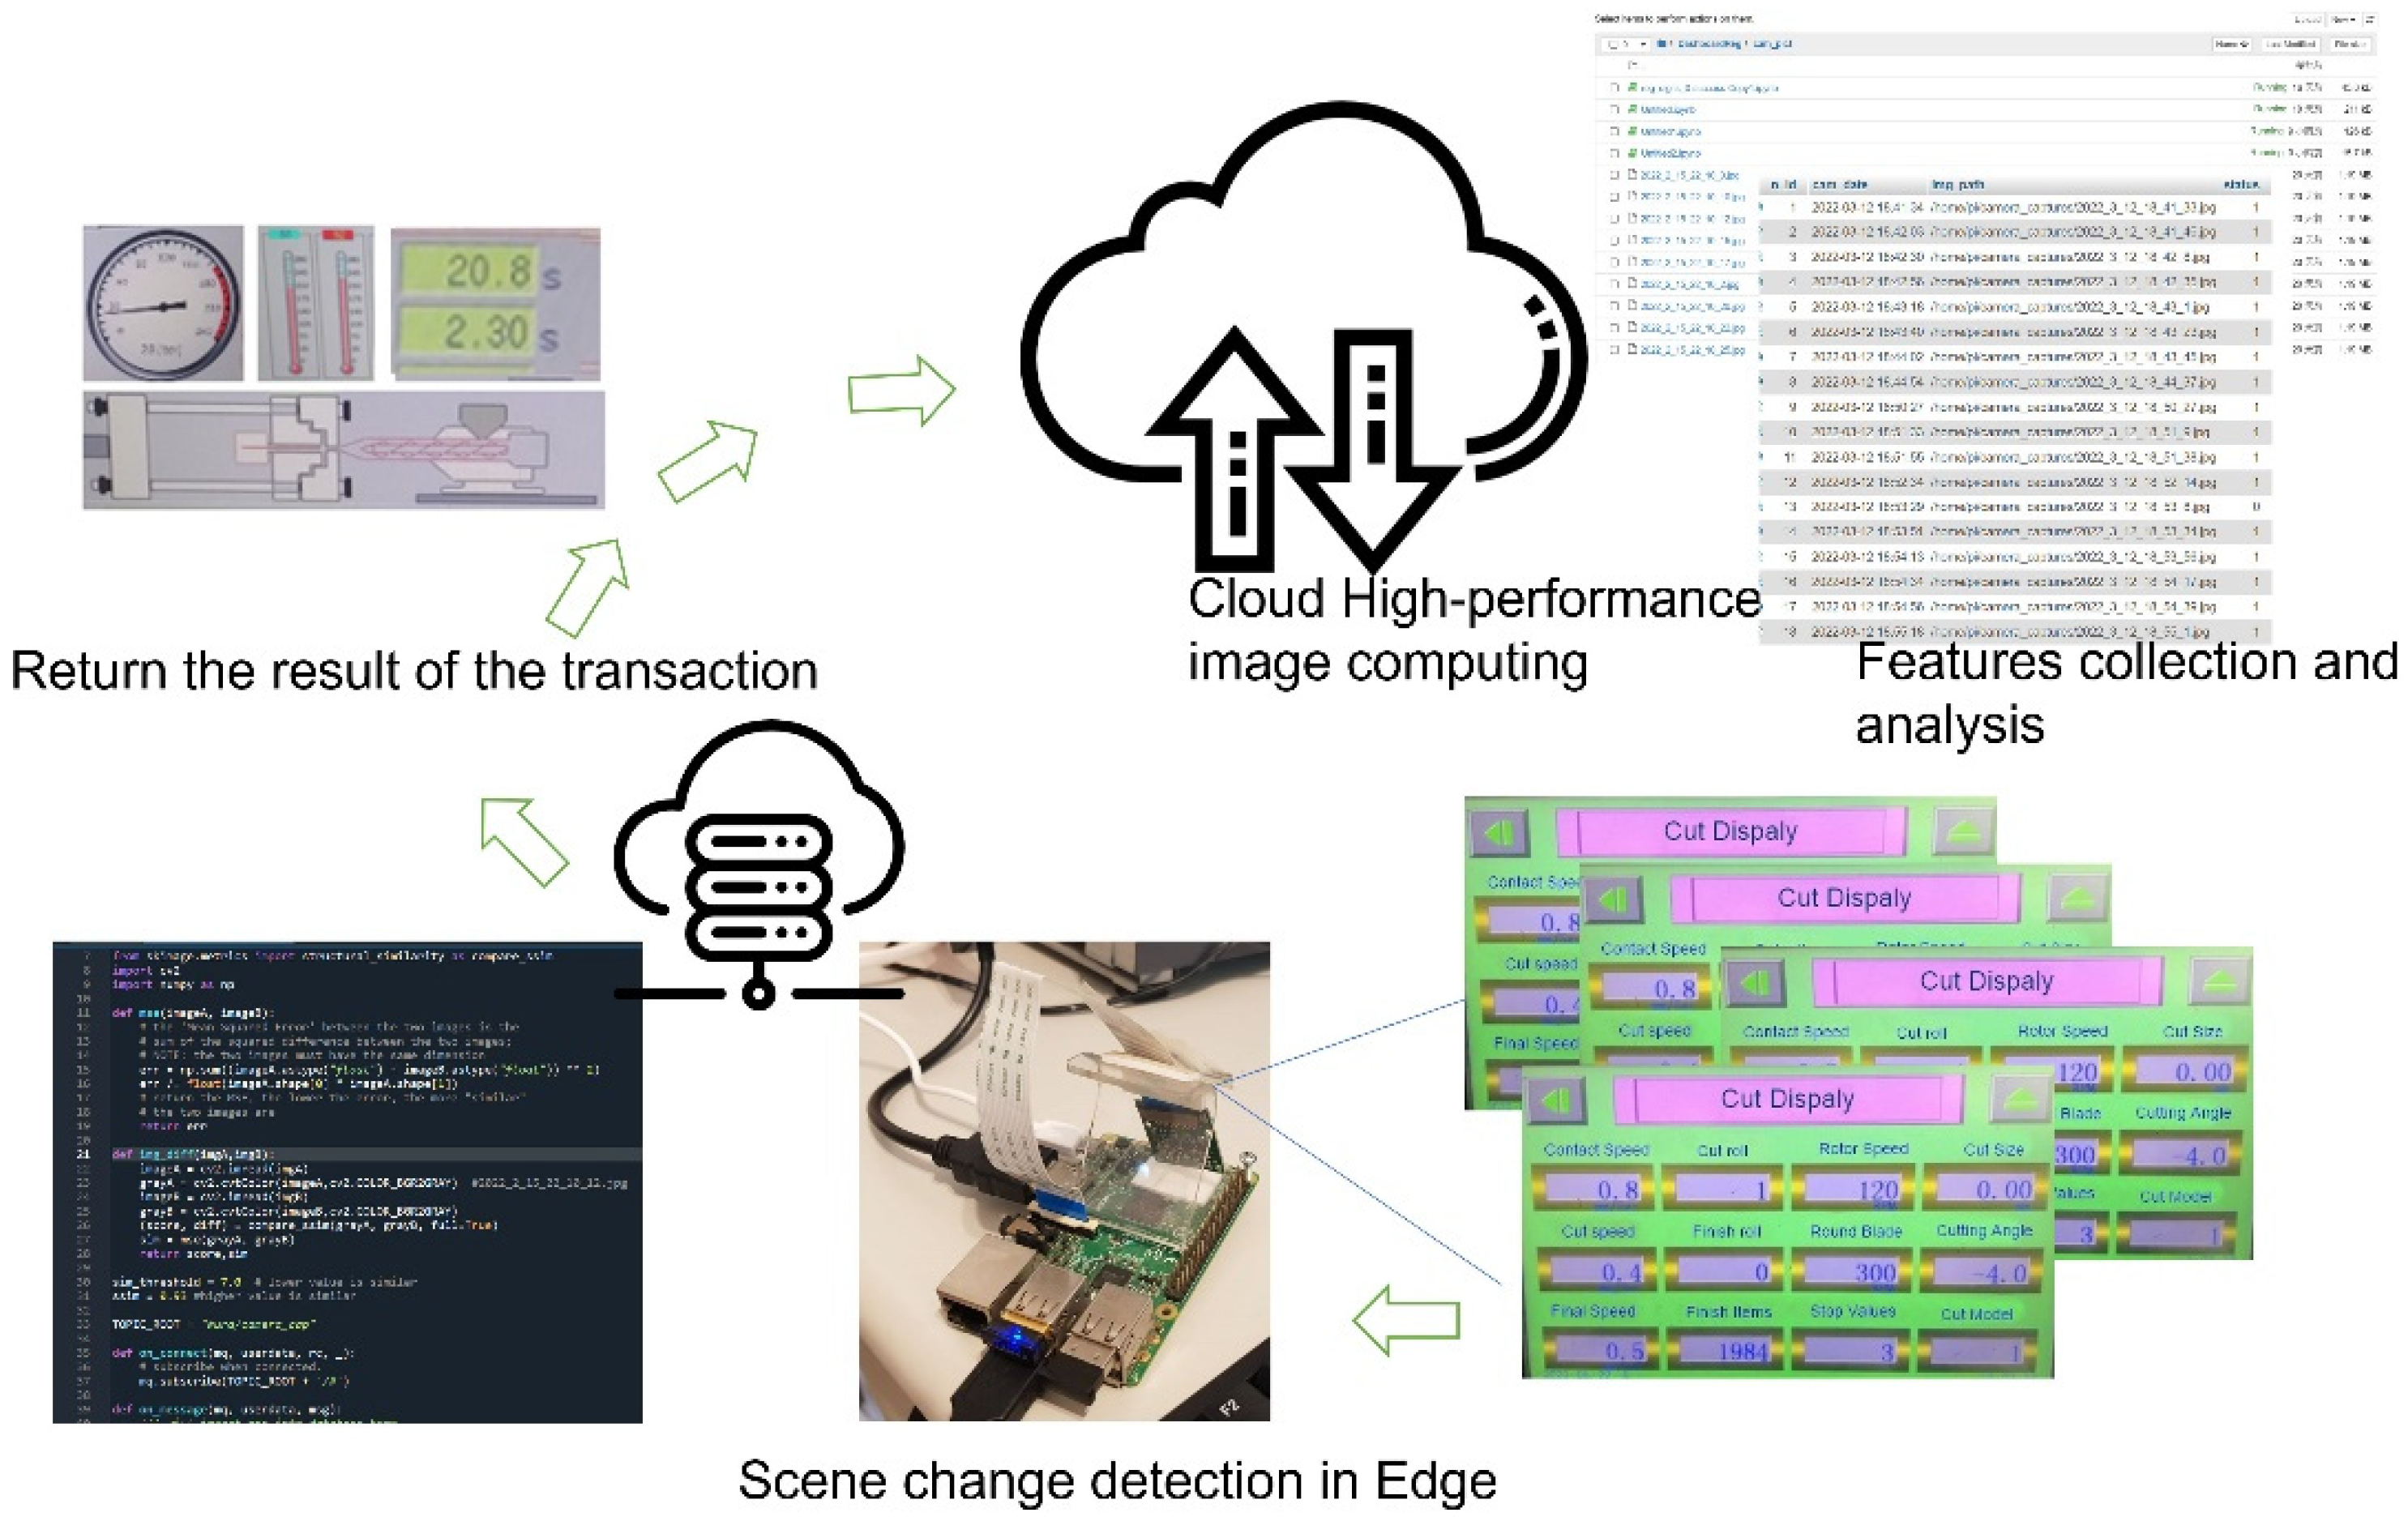
Based on the architecture of the proposed system, Figure 5 shows the IoT system implemented in a plastic factory. The end device performs real time monitoring by scene change detection and extracts low-level features. Fog node gathers low-level features from end devices to form mid-level features and transmits to the cloud. The fog node was set in the factory in the proposed experiment. Finally, decision making is performed by high-level features in the cloud server with its high computing power. Only the abstract data are stored in the cloud database for further analysis, which can avoid the revelation of the factory’s confidential data. Each component in Figure 5 will be described in the following sections.
3.2. Scene Change Detection in End Devices
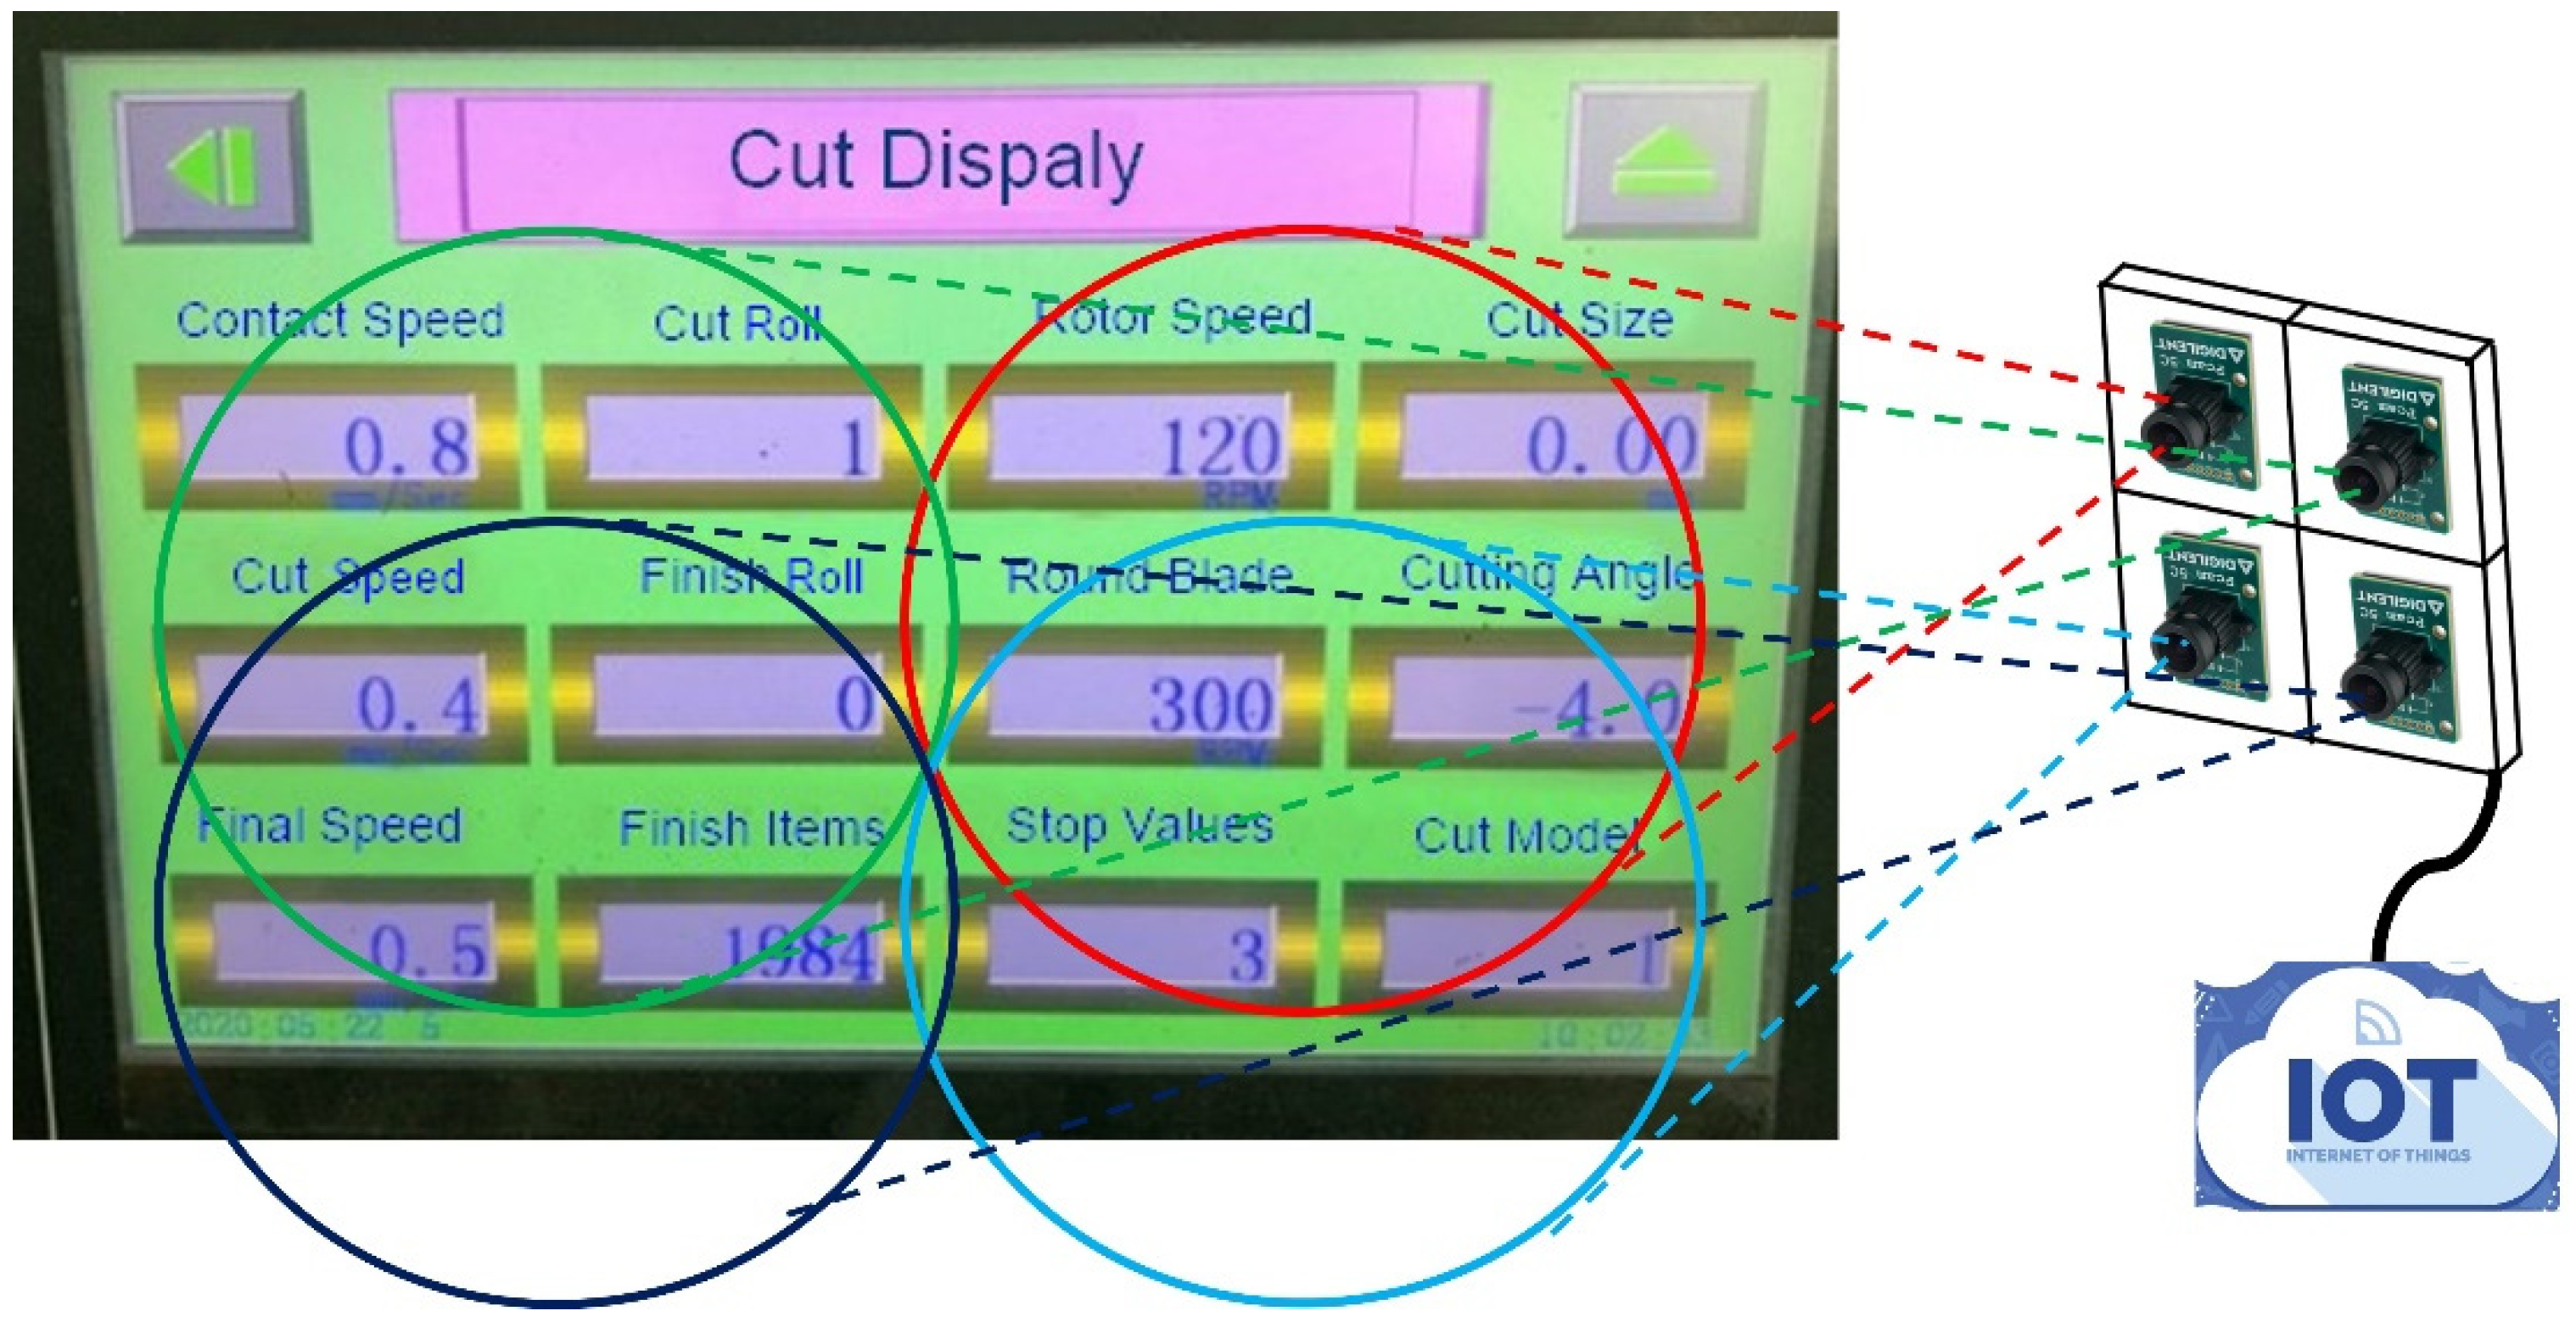
In traditional vision technology, feature extraction and matching methods are used for object recognition. By using deep learning computing technology, the accuracy of image analysis is greatly improved. Relatively, large storage space and computing time are required in the end device such that it is almost impossible for real applications. Sending raw data back to the cloud server for processing can provide powerful computing power but introduce privacy issues. The various components in the IoT work separately and cooperatively to solve real problems. The end device in the proposed IoT was designed by using the common products on the market. The Terasic DE2-115 platform is equipped with an array camera as the end device of the IoT. Each camera is responsible for capturing images of a part of the PLC screen. Figure 6 shows the array camera of the end device and its corresponding captured image region of the PLC screen.
where m and n represent the width and height of the image, respectively, and I and K are the corresponding images. MSE calculates the average of difference between two corresponding pixels. The calculated value indicates the similarity between two images, the smaller the value, the more similar the two images are. It is simple and fast, but has a serious problem that a large difference in pixel values does not necessarily mean a large difference in image content. For example, the images of exactly the same scene under different lighting conditions may result in large MSE values instead of 0. Therefore, the region of interest (ROI) for calculating MSE is a small sliding window with a size of sxs, and threshold T1 is used as the first test. If MSE is smaller than T1, the end device does nothing and keeps watching. Otherwise, it follows the second test by Equation (2), the Structural Similarity Index Measurement (SSIM) [28]. SSIM is an indicator that can be used to measure the similarity between two digital images. There are strong correlations between adjacent pixels in natural images, and such correlations reveal the structural information of objects in the scene. It is more suitable to judge the image quality and detect scene changes such asthe human eye in the monitoring process”
where x and y are two testing images; μx and μy are their means; σx and σy are their variances; σxy is the covariance. c1 and c2 are constants. SSIM ranges from 0 to 1. The larger the value of the SSIM, the higher the similarity between the two images. When the two images being measured are exactly the same, the value of the SSIM is 1. The limitation of SSIM is that it cannot work effectively in the case of image displacement, scaling, and rotation, which are non-structural distortions. These are not the situations we are going to study in this paper, because each end device will be fixed in right position in the factory.
3.3. Feature Extraction in End Devices
TensorFlow Lite [29] is a set of tools that help developers run TensorFlow models on mobile, embedded, and IoT devices. It supports on-device machine learning and recognition. It also has low latency and small binary files. The first one of TensorFlow Lite’s main components is TensorFlow Lite interpreter, which runs specially optimized models on many different types of hardware, including mobile phones, embedded Linux devices, and microcontrollers. The second is TensorFlow Lite converter, which converts TensorFlow models into an efficient form for use by the interpreter and introduces optimizations to reduce binary file size and improve performance. Converters are generally used in computers with efficient computing power. The interpreter is mainly run on embedded devices.
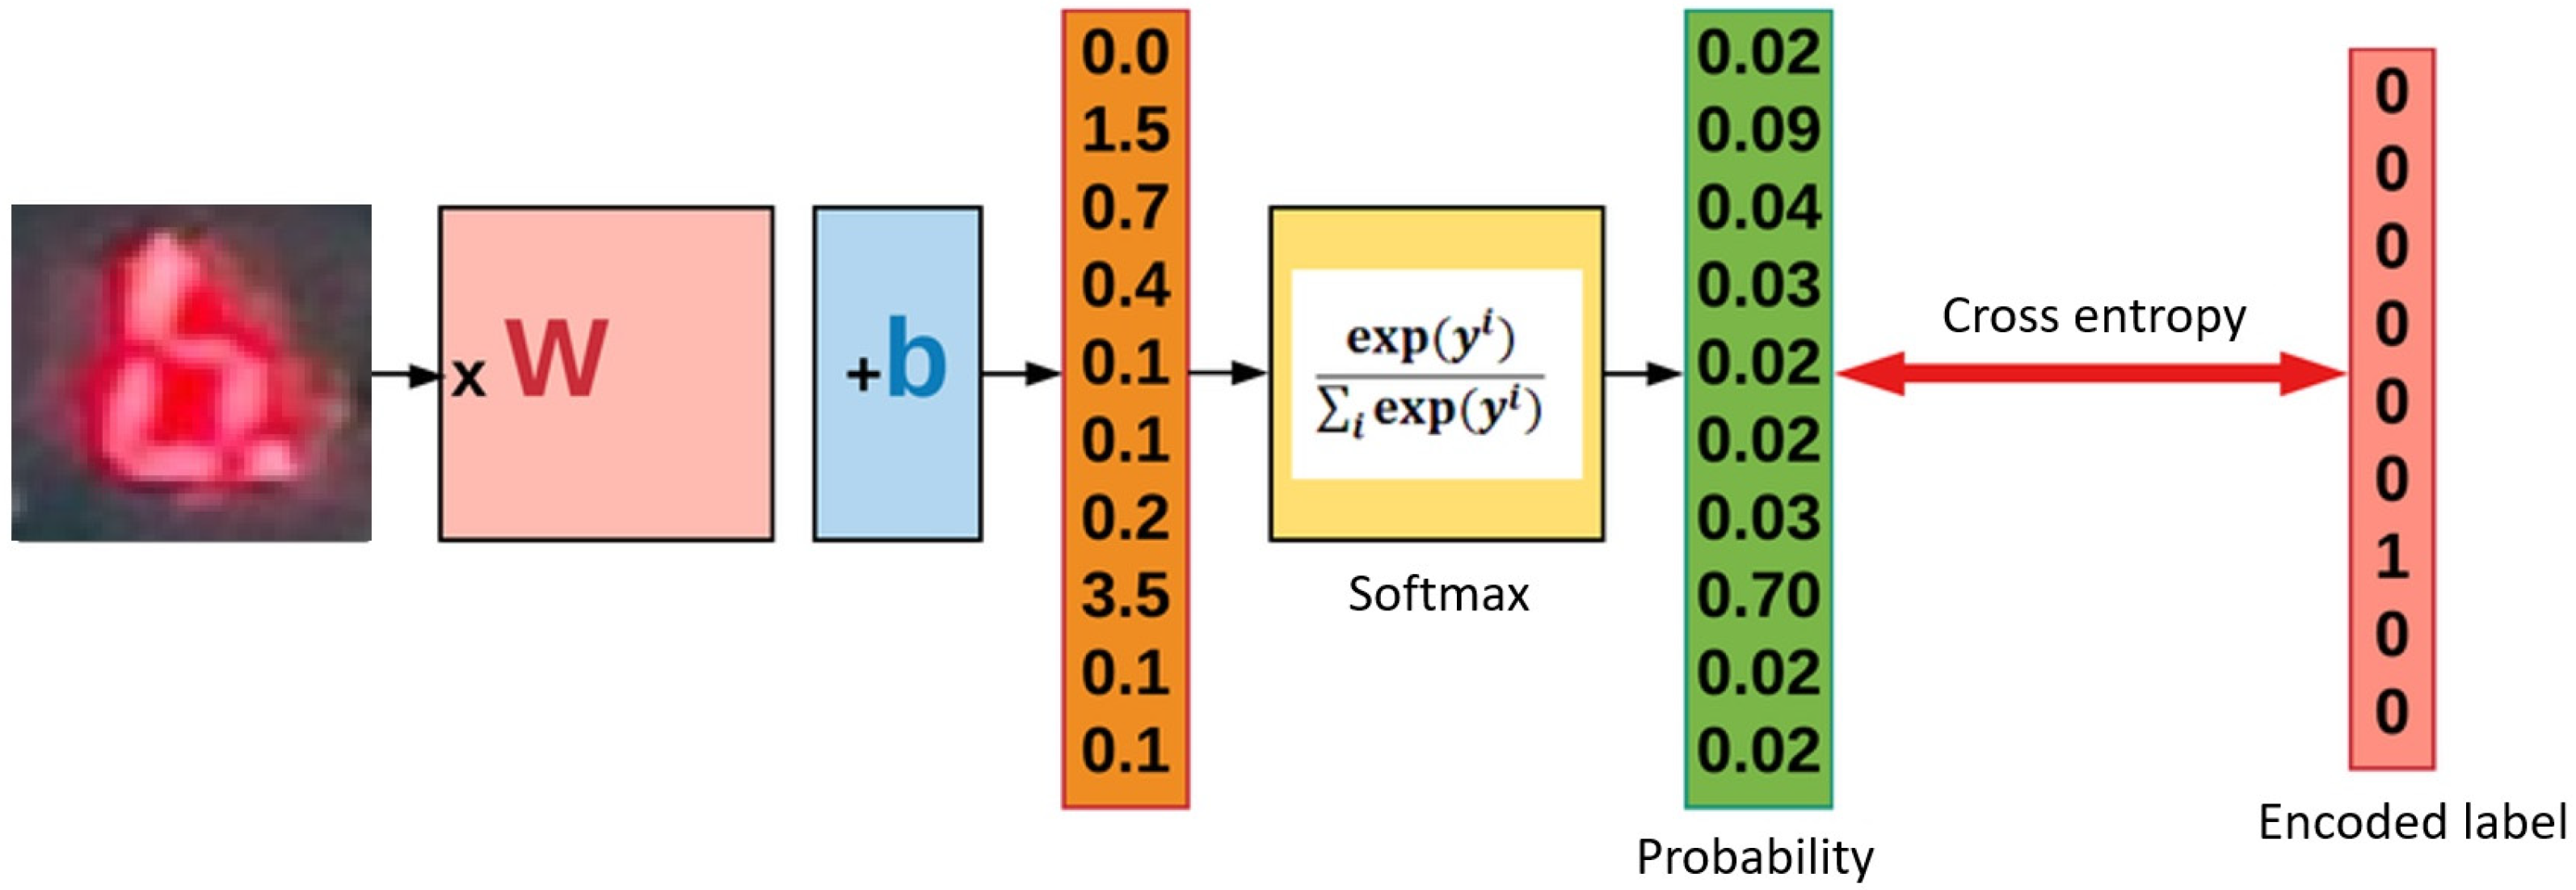
First, the real-time image data of the PLC panel are captured, and edge computing is performed at the IoT end device. Apply TensorFlow Lite to generate low-level features of individual images, which are passed for scene change detection. The low-level features in the image include color, texture, line, shape, and so on. The resulting feature vector is sent to the intermediate nodes. The feature vector will be merged with the results of other terminal nodes into higher order features. Figure 7 presents a diagram to explain the concept of the algorithm for feature extraction on TensorFlow Lite with logistic regression structure. The weight W and bias b generated the linear classifier model. The Softmax generated the probabilities and cross entropy transferred them to the encoded label. The input image size was 28 × 28 such that it would change to a vector of size 784.
3.4. Fog and Cloud Computing
The purpose of high-level deep learning is to build a cloud architecture that can train machine learning models on the premise of protecting user privacy. The specific method for training the model is that each fog node uses the same model definition and initialization parameters. Let {F1, F2, …, FN} be the set of fog nodes, where N is the number of fog nodes. {D1, D2, …, DN} is the set of the corresponding data from fog nodes. Fog Fi trains the model with local data Di, calculates the gradient, and then encrypts and uploads it to the cloud server. Cloud server integrates the gradients from each fog and updates the model. Then, the server returns the updated parameters of the new model to each fog. Fogs update their local model individually according to the updated parameters. Then, the above steps are iterated until the model reaches the convergence criteria.
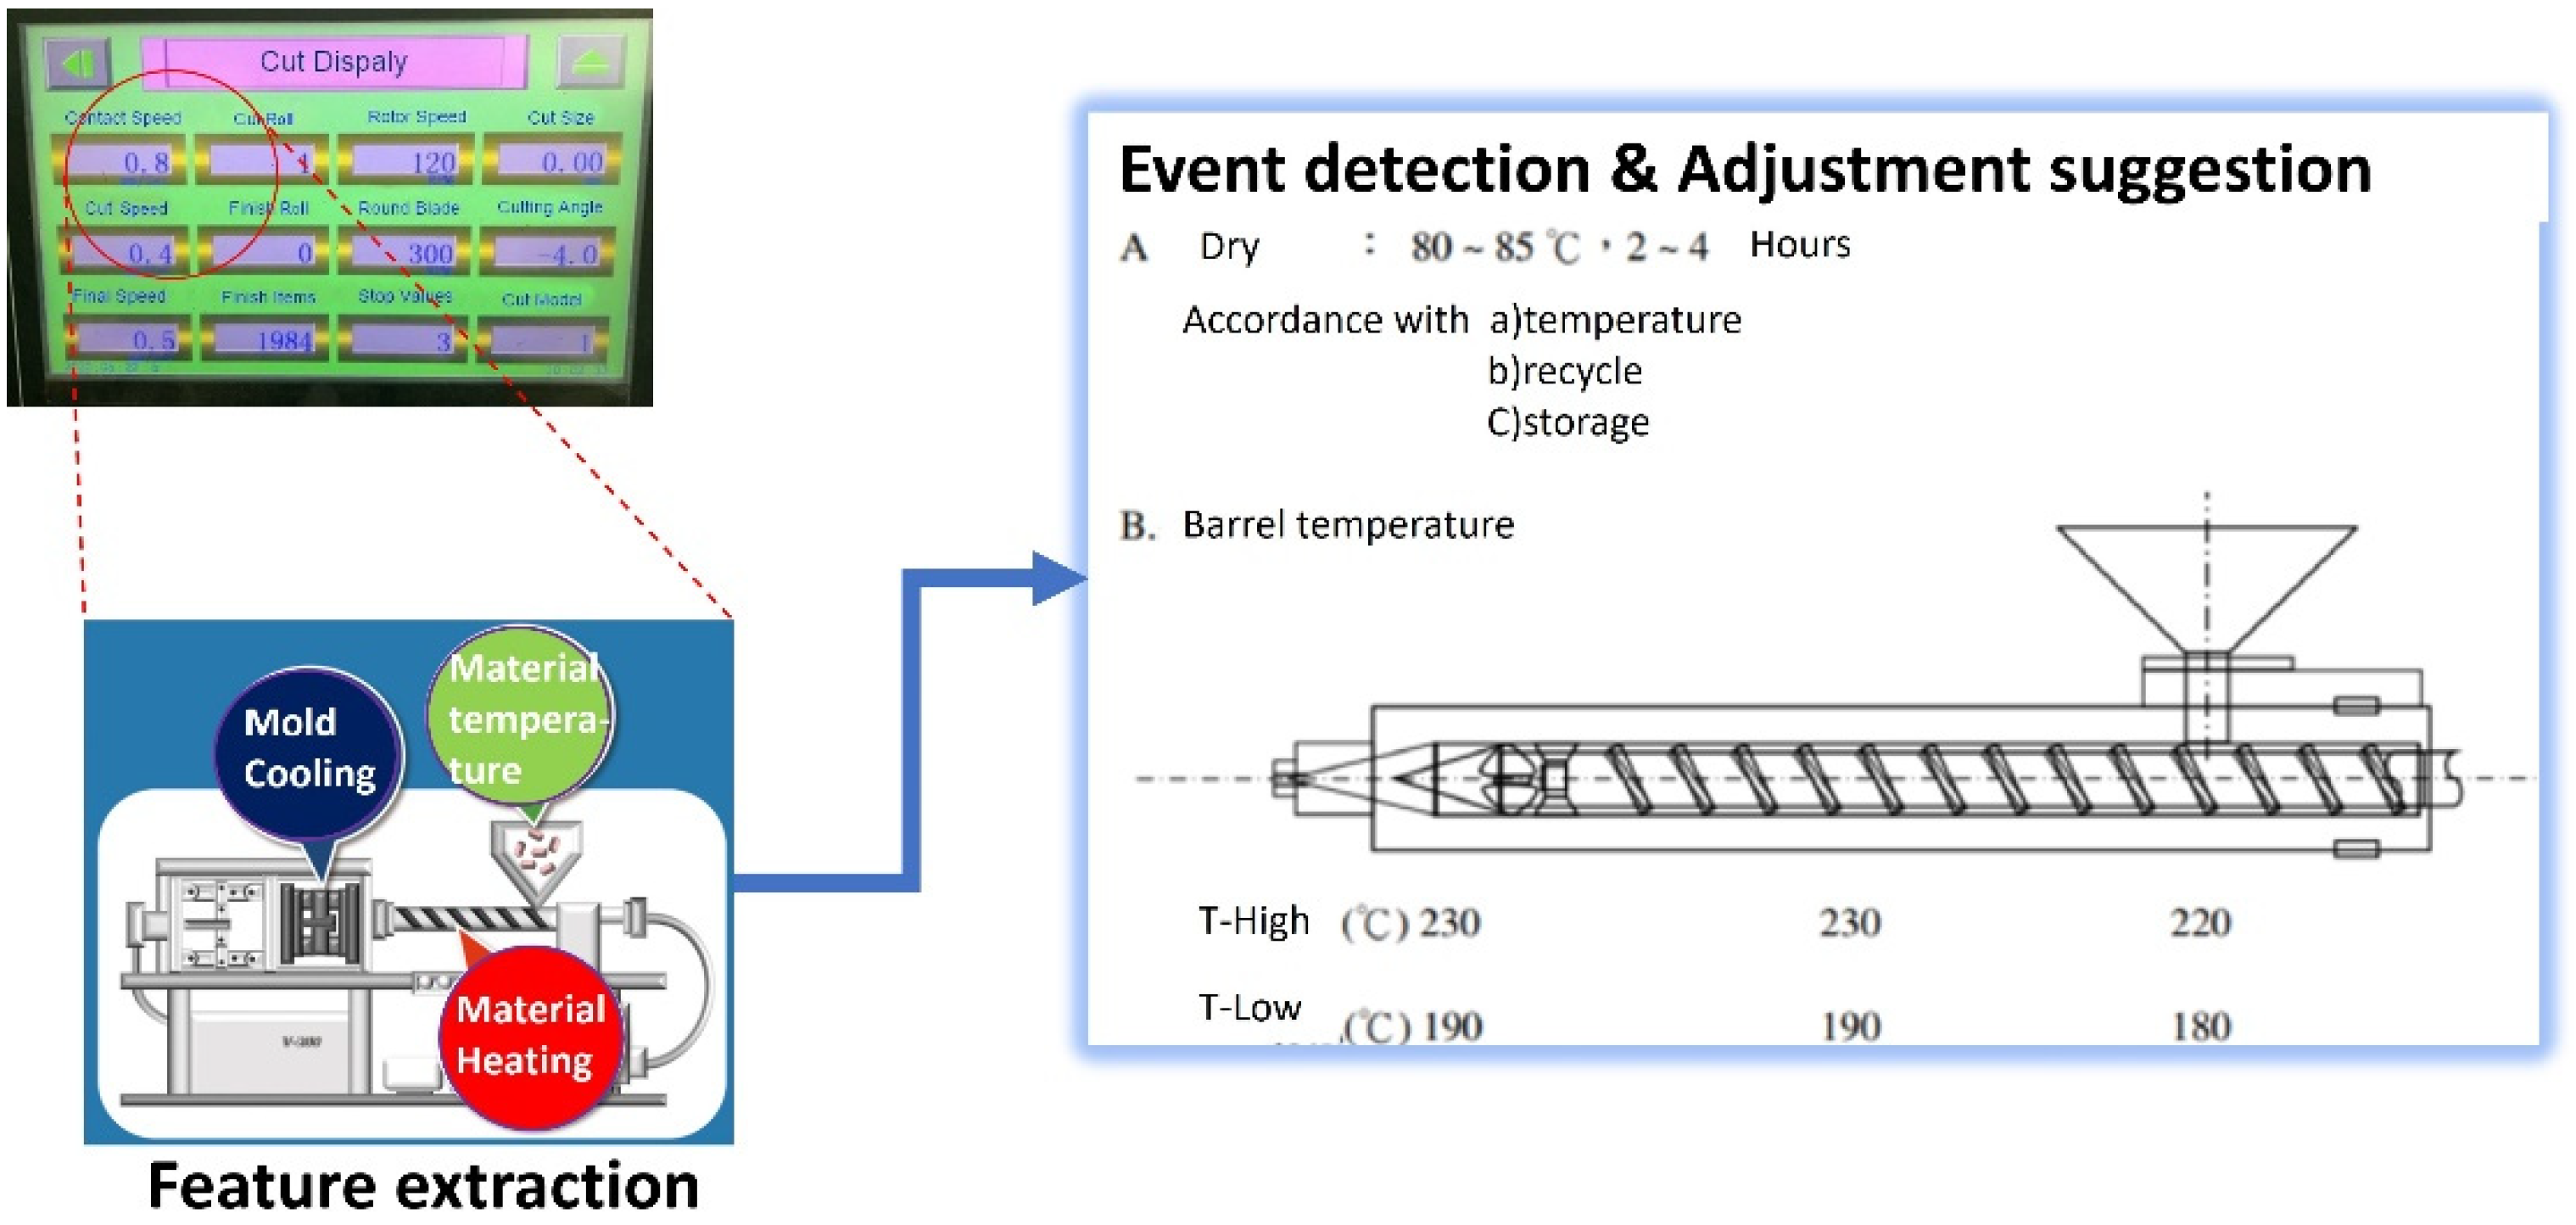
Figure 8 shows the mapping of the proposed models in IoT to real production process. From the upper left corner, low-level features of machine temperature were extracted by the model in edge devices. They will be integrated into mid-level features, corresponding to machine status and have confidential considerations. The right part of Figure 8 is the result of fog and cloud computing, which indicates if there is an abnormal event, which will happen in the near future. At the same time, some adjustment suggestions are returned to the operator and manager of the factory.
By conducting the analysis of abnormal events in this research, it is found that the state characteristics of key components, such as peak injection pressure of the machine, are obtained by comparing the time series data of the relevant parameter settings with the actual value of the production process. There is an opportunity to diagnose abnormal events of the machine equipment and even the aging index. We summarized those to be the static training data. The IoT will continue to collect dynamic data when the system is running. Table 1 shows the relationship between PLC panel features and the corresponding events. The symbol, I/3 (R/1), denotes increasing (reducing) the parameter setting in priority 3 (1), respectively. For example, the intersection of row 1 and column 1 in Table 1 represents the fact that the injection pressure has to increase in priority 2 when underfilling events are detected. These were stored in the local database of the factory. When the local system obtains a notification received from the cloud, the corresponding adjustment suggestion will send to the operator and manager to make a quick decision about the production process. Only features and parameters are communicated in the IoT outside of the factory such that each factory can keep its own confidential information for production.
4. Experimental Results
This section describes the experimentation of the proposed method, which was built in a plastic injection factory. The edge node was implemented by a simple camera, Pcam 5C, embedded on Terasic DE2-115 board to monitor machines and only process low-level data and part of the fog computing. The video streaming formats of Pcam 5C was set to be 1080 p at 30 frames per second to fit the real-time monitoring requirement. TensorFlow Lite was initially trained with a database including 58,688 images generated under the environment of the plastic injection factory. Normalization process resized each image to be 32 × 32 pixel in the training process.
The real-time image capturing provides input images for scene change detection. Figure 9 illustrated the result of scene change in six continues frames Figure 9A–F. For Figure 9A,B, There is no change between them such that the SSIM value is almost equal to 1. However, the SSIM value between Figure 9C,D (Figure 9E,F) is 0.51 (0.2), respectively. It represents that scene change happens in those frames and that the TensorFlow Lite model is further applied to extract low-level features.
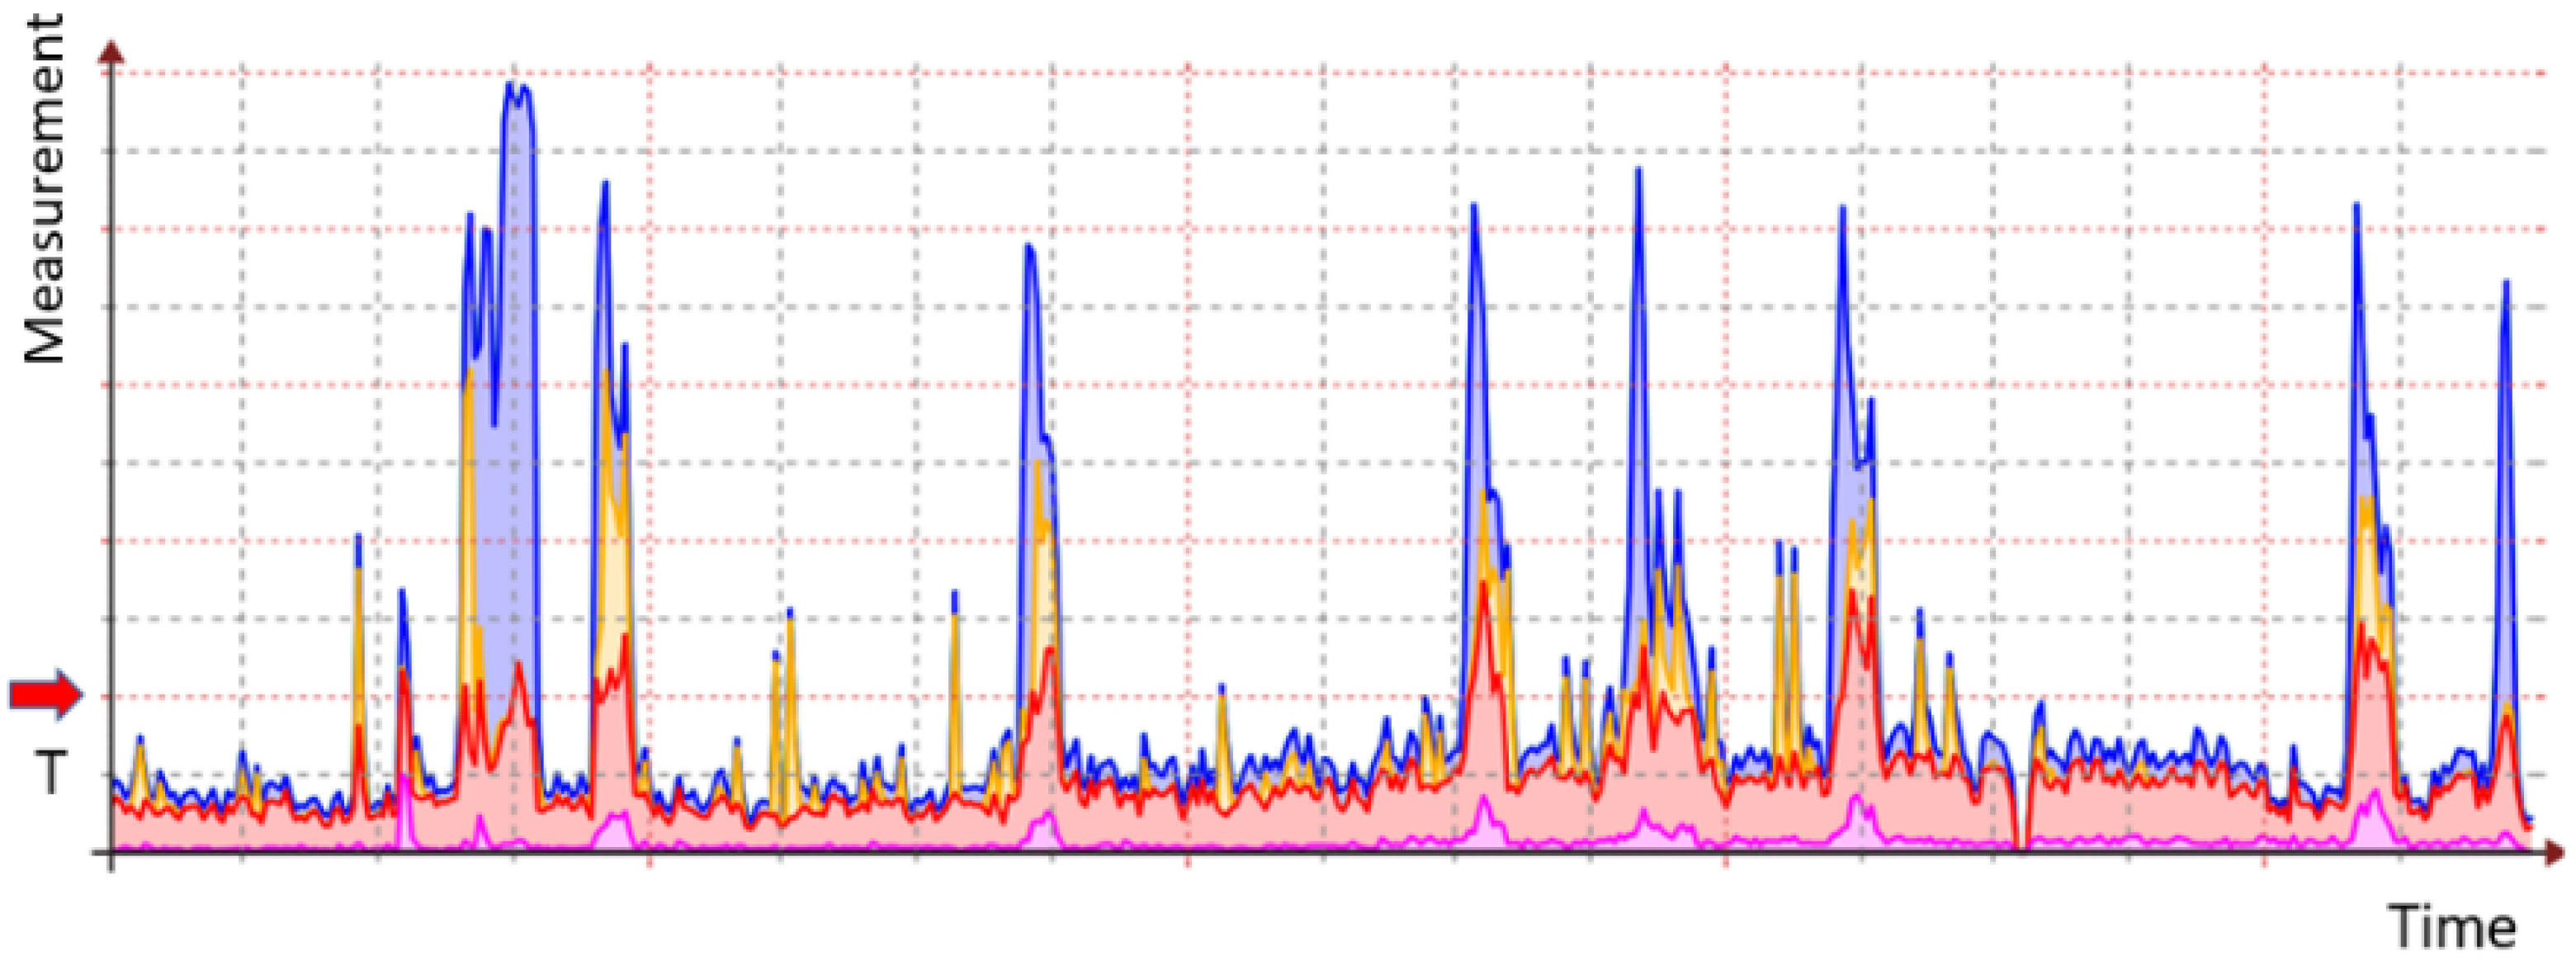
The monitoring process of the actual operation of plastic injection machines is captured for 18 s and presented in Figure 10. The horizontal axis in the figure represents time, and each unit scale is 1 s. The vertical axis indicates the reciprocal of the SSIM measurement index, which varies from 0 (no change) to 1 (scene change) and each scale is 0.1. The figure contains four machines presented as lines in different colors. It is observed that most SSIMs are less than 0.2 such that it is set to be the threshold value T for determining scene change. There is a dramatic change in SSIM between the third and fourth seconds, which represents the temperature change of all machines caused by the unstable power at that time. After the product was completed, the residual temperature of the mold opening caused temperature changes and reflected that SSIM changes in the seventh, eleventh, and seventeenth seconds at the same time. There are 21 image pairs exceeding the T value in the image sequence, which contains 540 images. Fog computing integrated end devices for further verifications, and 17 data changes were excluded. Cloud computing can clarify the cause of the four signals to determine the possibility of abnormal event.
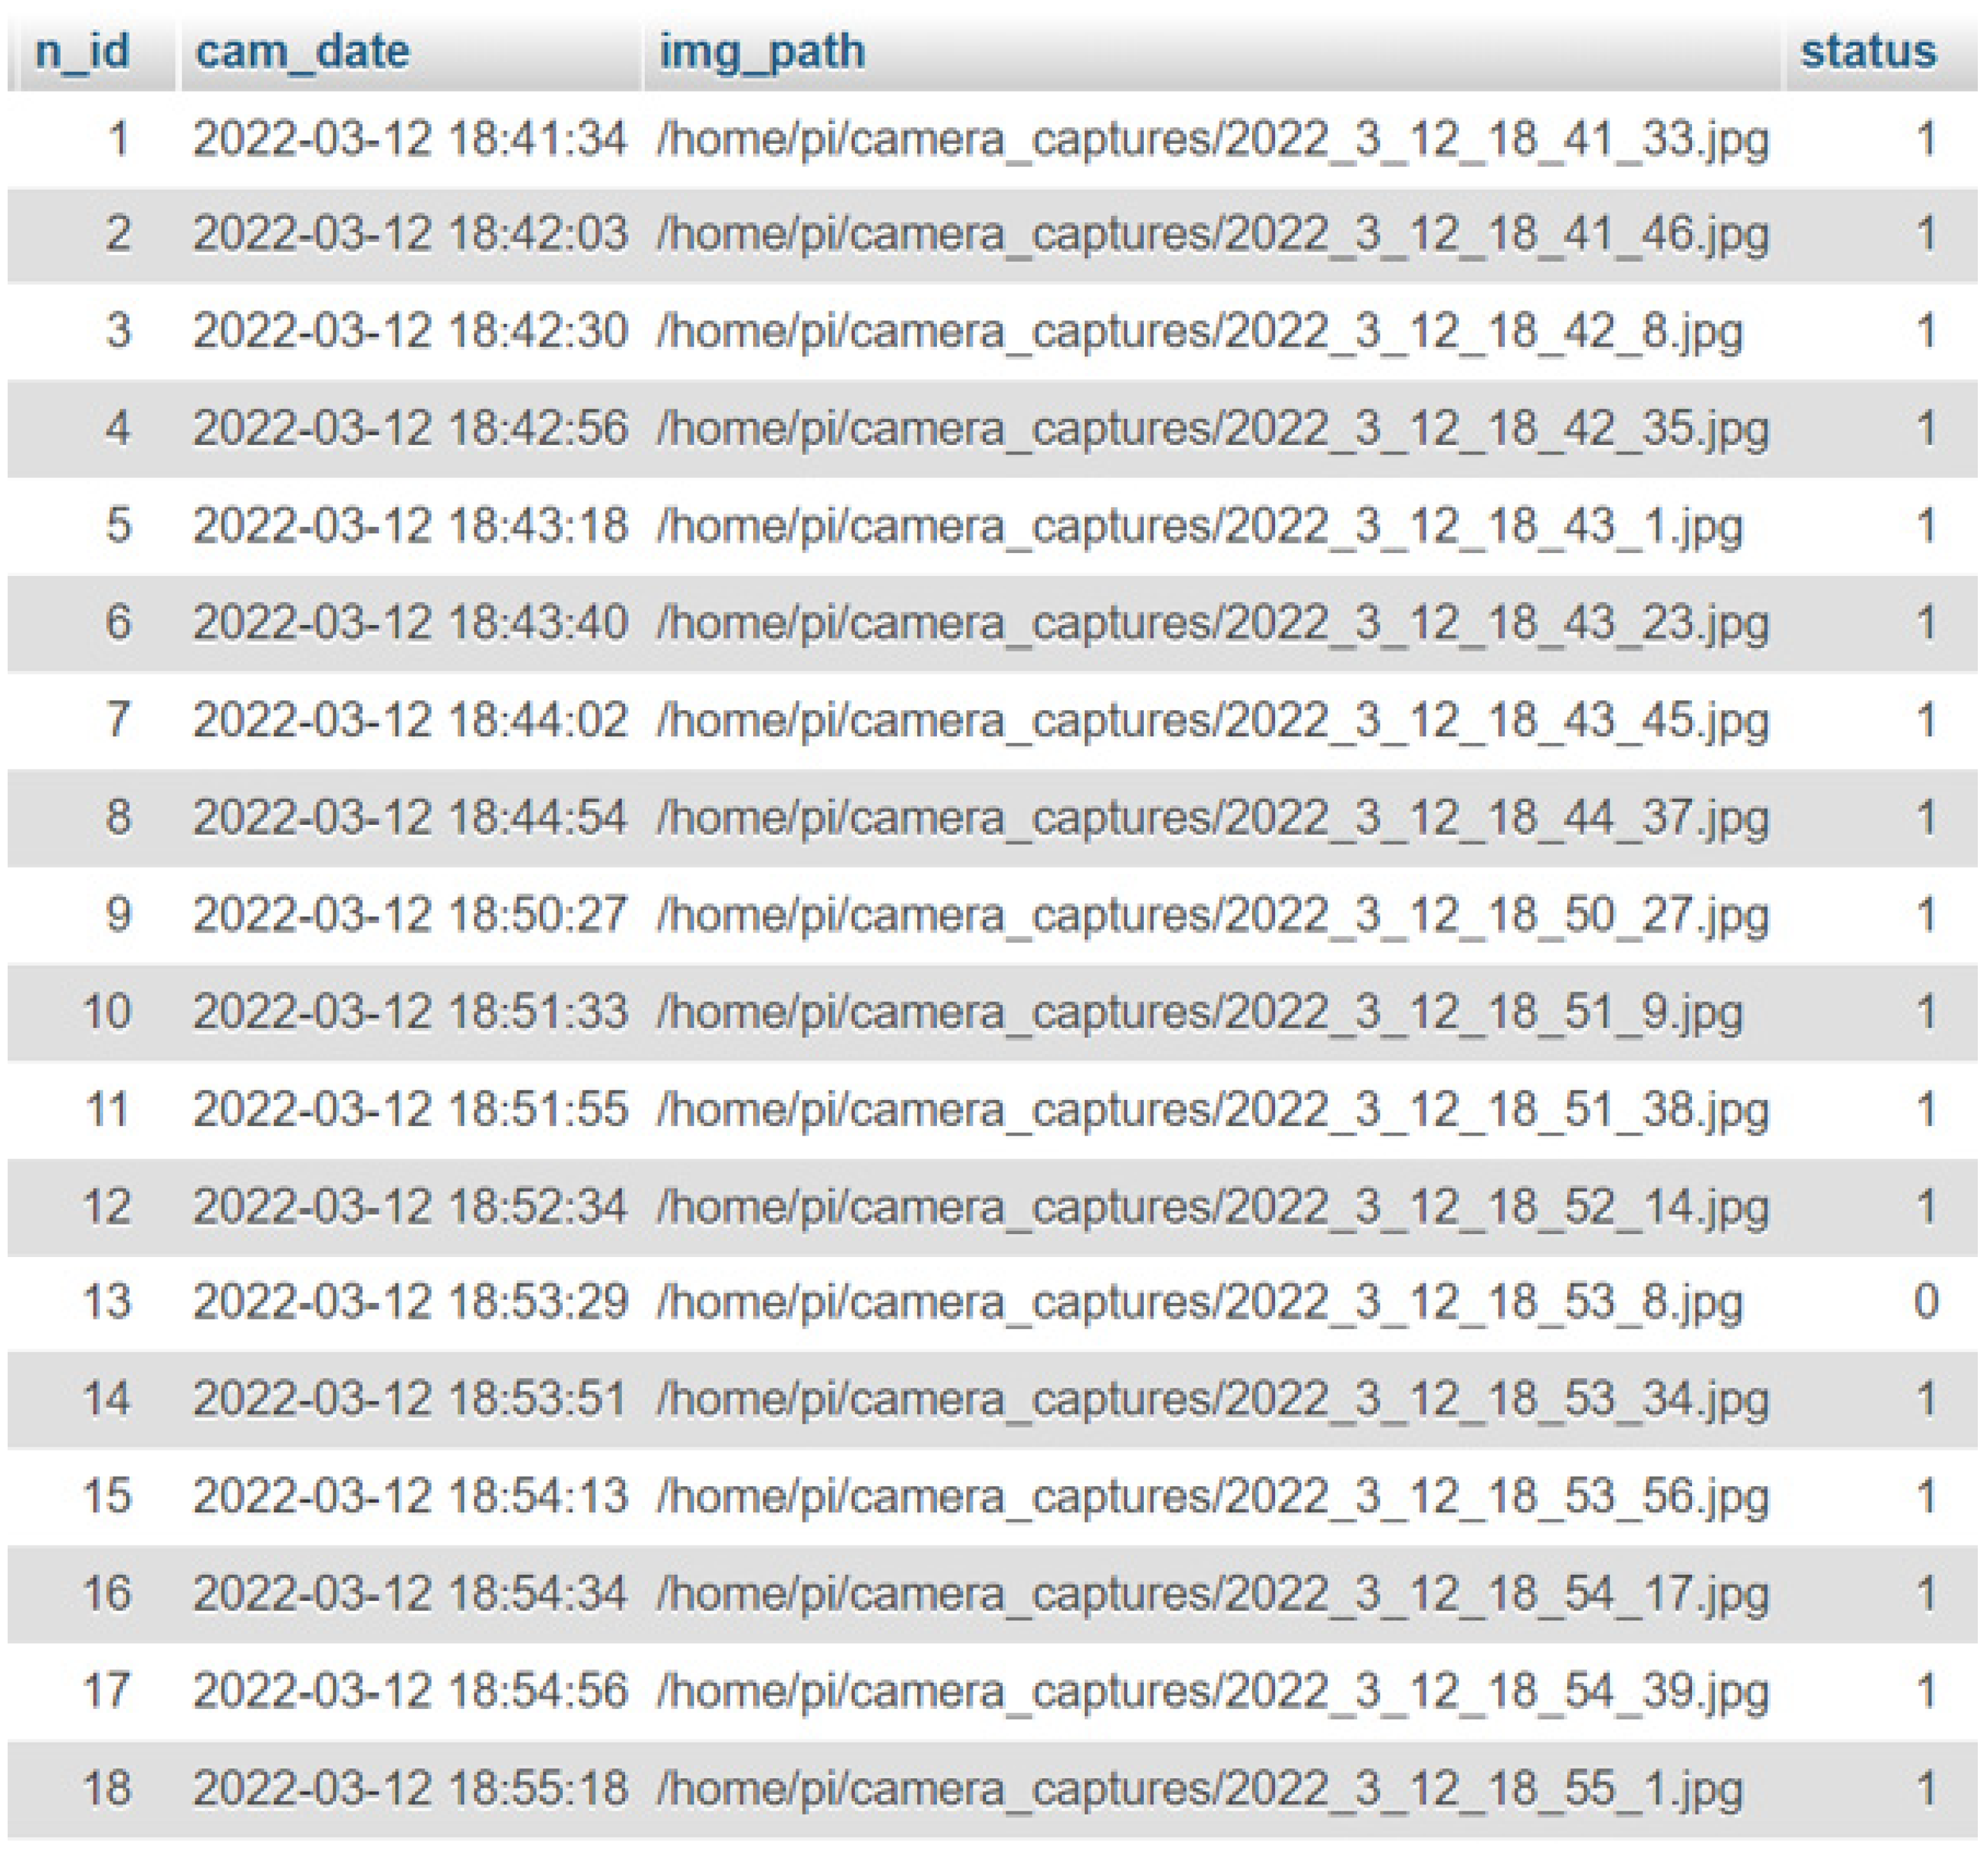
When SSIM exceeds threshold T, edge computing performed on Terasic DE2-115 board extracts image features using the image pre-analysis model and transmit it to fog computing. The status of edge node is used to note the scene change result and stores in the database. When scene change detection is true, its status is changed from 0 to 1. When the image is the same as the previous one under the test by SSIM, the edge computing environment does not change, and the state remains 0. The fog node receives features from end nodes and performs multiple feature analysis, according to the machine state information. Otherwise, it does nothing and waits for the next state change. Because duplicate images are not processed, computing performance and visual accuracy of images can be improved. In Figure 11, the status is 1 for event 1 to event 12 and event 14 to event 18, but image 13 is 0.
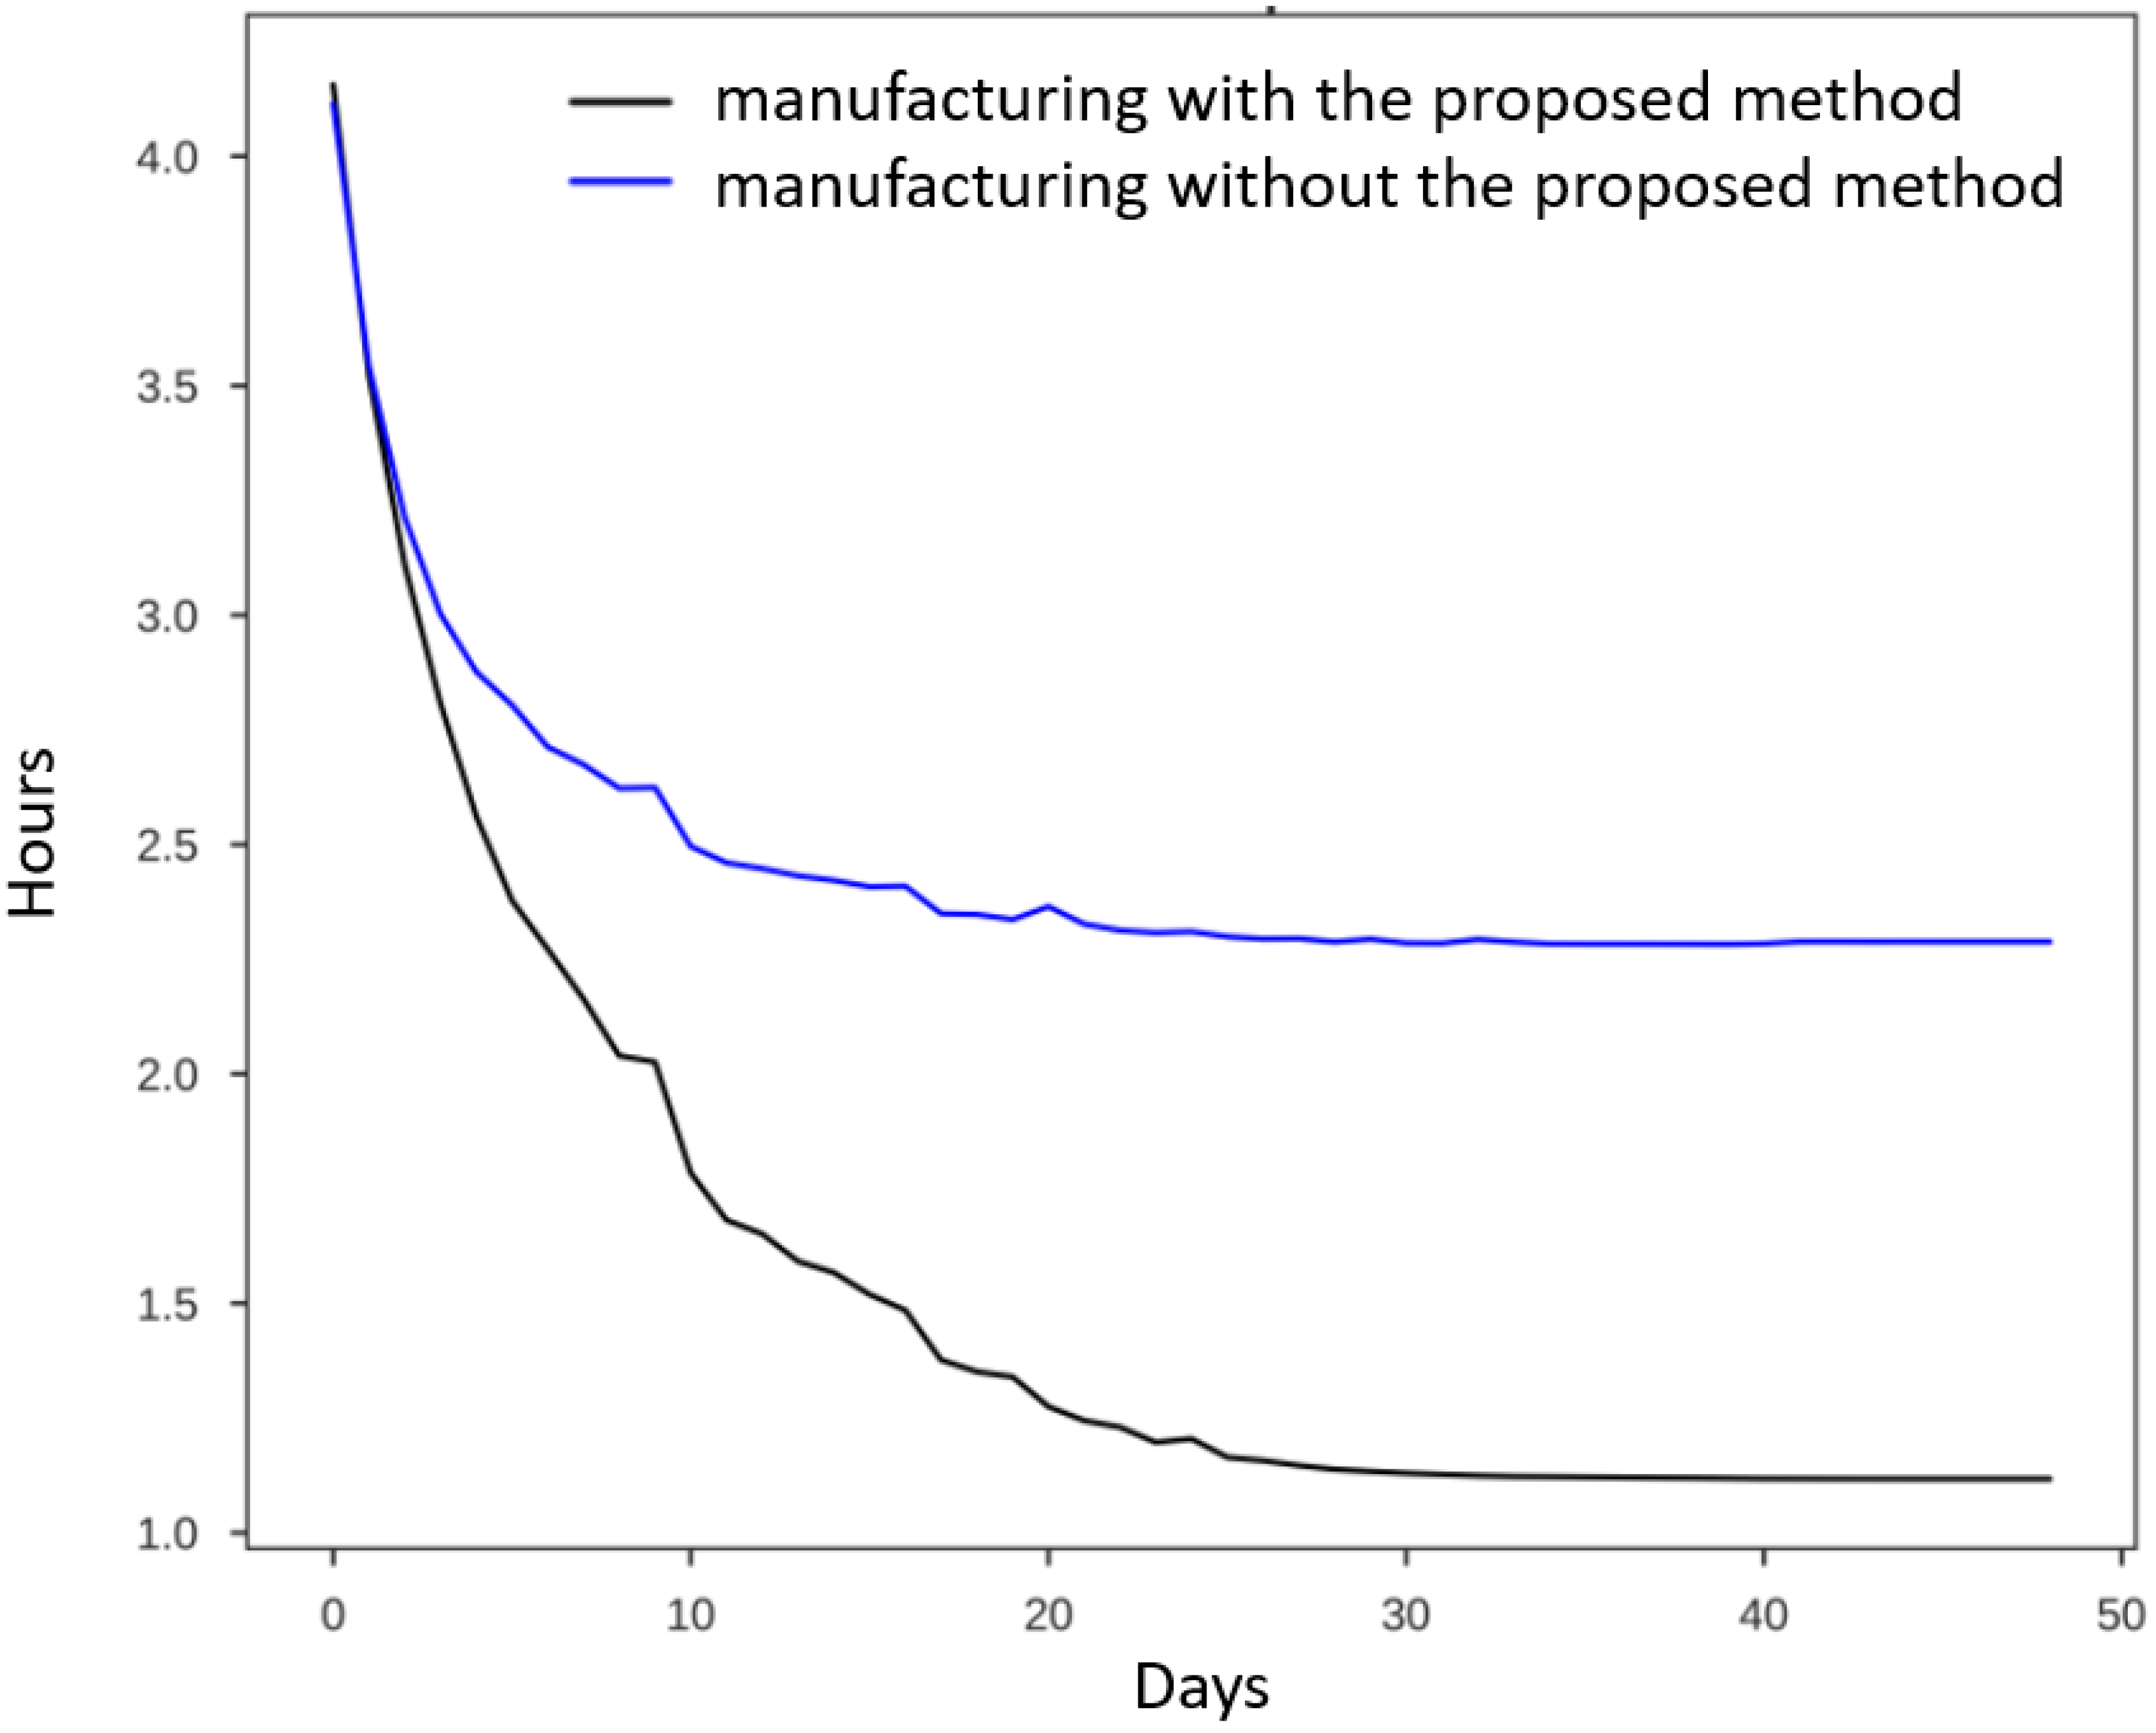
In the scenario, when the digit number of temperature information on the PLC panel screen changes, SSIM will detect the scene change on the edge computing. The edge node also extracted low-level features of images in which SSIM exceeded T and transmits features to fog computations. The average accuracy of the image capturing based on the trained TensorFlow Lite model approached 99.8% under the online test in a plastic injection factory for a week. Although it did not reach a perfect result, the errors could be eliminated in the following fog and cloud computations. Combining SSIM and classification processes in the edge device, the frame rate of the system for capturing images reached 45 per second in average. The fog node integrates multiple features from end devices and extracts mid-level features with TensorFlow Lite model. In this study, fog node is a mini-cloud containing several end devices. After receiving data from end devices, fog node recognizes digit numbers and transmits the result to the cloud server. Cloud server was responsible for abnormal event detection of temperature change and adjustment suggestion about how to control the temperature to the normal range. The experimentation had been performed for 50 days on two machines in a real plastic injection factory in Taiwan to verify the performance of the proposed method. For performance analysis, the delayed time of each machine was accumulated and the starting time was set to be infinite. As time goes on, the average delayed time decreased. Figure 12 shows the average delayed time for manufacture with/without the proposed method Experimental results showed that the IoT system with the proposed method delayed 1.1 h on average for 50 days of continuous operation. However, the conventional system without the proposed method almost delayed 2.5 h in the same experimentation.
5. Conclusions and Future Work
A general solution based on edge computing and cloud computing in IoT for machine monitoring in the manufacture of small- and medium-sized factory is provided in this study. Real-time consideration is an important issue for most factories. Edge computing and cloud computing models were seamlessly cooperated to perform information capture, event detection, and adaptive learning in production process. Low-level features of images for event detection and recognition are processed in edge nodes. Fog and cloud computing is responsible for mid- and high-level features by using federated learning model. The real experimentation in the factory implemented edge nodes by using a simple camera embedded on a Terasic DE2-115 board to monitor machines and process real-time data. Fog and cloud computing used the data sent from edge node and combined mid- and high-level feature generation with the nonlinear classifier to have identification results. Therefore, it was successfully tested in a plastic injection factory to monitor the real-time condition of machines without operators and retain its data privacy. Experimental results showed that the IoT system with the proposed method delayed 1.1 h on average for 50 days of continuous operation.
Author Contributions
Conceptualization, Y.-H.T. and T.-C.H.; methodology, T.-C.H.; software, T.-C.H. and D.-M.C.; validation, Y.-H.T., D.-M.C. and T.-C.H.; formal analysis, T.-C.H.; investigation, D.-M.C.; resources, Y.-H.T. and T.-C.H.; data curation, D.-M.C.; writing—original draft preparation, T.-C.H.; writing—review and editing, Y.-H.T.; visualization, D.-M.C.; supervision, T.-C.H.; project administration, T.-C.H.; funding acquisition, Y.-H.T. All authors have read and agreed to the published version of the manuscript.
Funding
This research was funded by Ministry of Science and Technology of the Republic of China grant number MOST 110-2221-E-364-001.
Conflicts of Interest
The authors declare no conflict of interest.
References
- He, L.; Xue, M.; Gu, B. Internet-of-things enabled supply chain planning and coordination with big data services: Certain theoretic implications. J. Manag. Sci. Eng. 2020, 5, 1–22. [Google Scholar] [CrossRef]
- Jiang, P.; Dong, L.; Pang, X. Deployment Strategy of Wireless Sensor Networks: A Survey. In Proceedings of the 2016 6th International Conference on Machinery, Materials, Environment, Biotechnology and Computer, Tianjin, China, 11–12 June 2016; Atlantis Press: Paris, France, 2016; pp. 1400–1408. [Google Scholar]
- Jackson, H.; Mirza, N.; Ryan, H.; Smith, J. The Use of Social Media Analytics to Investigate Consumer Behavior and Build Marketing Strategies. Sentimental Analysis Used to Mitigate Risk Management during the COVID-19 Pandemic. Available online: https://papers.ssrn.com/sol3/papers.cfm?abstract_id=3710024 (accessed on 12 October 2020).
- Baker, S.B.; Xiang, W.; Atkinson, I. Internet of Things for Smart Healthcare: Technologies, Challenges, and Opportunities. IEEE Access 2017, 5, 26521–26544. [Google Scholar] [CrossRef]
- Babar, M.; Khan, F.; Iqbal, W.; Yahya, A.; Arif, F.; Tan, Z.; Chuma, J.M. A Secured Data Management Scheme for Smart Societies in Industrial Internet of Things Environment. IEEE Access 2018, 6, 43088–43099. [Google Scholar] [CrossRef]
- Rocha, N.P.; Dias, A.; Santinha, G.; Rodrigues, M.; Rodrigues, C.; Queirós, A.; Bastardo, R.; Pavão, J. Systematic literature review of context-awareness applications supported by smart cities’ infrastructures. SN Appl. Sci. 2022, 4, 90. [Google Scholar] [CrossRef]
- Abbas, U.N.; Ullah, F.; Zafar, N.A. Formal Model of Smart Traffic Monitoring and Guidance System. Int. J. Comput. Sci. Inf. Secur. 2016, 14, 241. [Google Scholar]
- Pouryazdan, M.; Fiandrino, C.; Kantarci, B.; Soyata, T.; Kliazovich, D.; Bouvry, P. Intelligent Gaming for Mobile Crowd-Sensing Participants to Acquire Trustworthy Big Data in the Internet of Things. IEEE Access 2017, 5, 22209–22223. [Google Scholar] [CrossRef]
- Gupta, A.K.; Shanker, U. Prediction and Anticipation Features-Based Intellectual Assistant in Location-Based Services. Int. J. Syst. Dyn. Appl. 2021, 10, 1–25. [Google Scholar] [CrossRef]
- Lopez, P.G.; Montresor, A.; Epema, D.; Datta, A.; Higashino, T.; Iamnitchi, A.; Barcellos, M.; Felber, P.; Riviere, E. Edge-centric Computing: Vision and Challenges. SIGCOMM Comput. Commun. Rev. 2015, 45, 37–42. [Google Scholar] [CrossRef]
- Ahmad, M.I.; Yusof, Y.; Daud, E.; Latiff, K.; Kadir, A.Z.A.; Saif, Y. Machine monitoring system: A decade in review. Int. J. Adv. Manuf. Technol. 2020, 108, 3645–3659. [Google Scholar] [CrossRef]
- Hou, B.; Wang, D.; Xia, T.; Wang, Y.; Zhao, Y.; Tsui, K.-L. Investigations on quasi-arithmetic means for machine condition monitoring. Mech. Syst. Signal Process. 2020, 151, 107451. [Google Scholar] [CrossRef]
- Karami, E.; Shehata, M.; Smith, A. Image identification using sift algorithm: Performance analysis against different image deformations. arXiv 2017, arXiv:1710.02728. [Google Scholar]
- Bay, H.; Tuytelaars, T.; Van Gool, L. Surf: Speeded up robust features. In European Conference on Computer Vision; Springer: Berlin/Heidelberg, Germany, 2006; pp. 404–417. [Google Scholar]
- Karami, E.; Prasad, S.; Shehata, M. Image matching using sift, surf, brief and orb: Performance comparison for distorted images. arXiv 2017, arXiv:1710.02726. [Google Scholar]
- Cerman, M.; Shalunts, G.; Albertini, D. Albertini, D. A Mobile Recognition System for Analog Energy Meter Scanning. In International Symposium on Visual Computing; Springer: Cham, Switzerland, 2016; pp. 247–256. [Google Scholar] [CrossRef]
- Kay, A. Tesseract: An Open-Source Optical Character Recognition Engine. Linux J. 2007, 2007, 159. [Google Scholar]
- Yun, H.; Kim, H.; Kim, E.; Jun, M.B. Development of internal sound sensor using stethoscope and its applications for machine monitoring. Procedia Manuf. 2020, 48, 1072–1078. [Google Scholar] [CrossRef]
- Chang, D.-M.; Tsai, Y.-H.; Hsu, T.-C.; Tseng, H.-W. Novel OneM2M Communication Mechanism Based on Labeling of IoT Devices. Sensors Mater. 2021, 33, 775–788. [Google Scholar] [CrossRef]
- Yadav, P.; Vishwakarma, S. Application of Internet of Things and Big Data towards a Smart City. In Proceedings of the 3rd IEEE International Conference Internet of Things: Smart Innovation and Usages (IoT-SIU), Bhimtal, India, 23–24 February 2018. [Google Scholar] [CrossRef]
- Ishino, M.; Koizumi, Y.; Hasegawa, T. Leveraging proximity services for relay device discovery in user-provided IoT networks. In Proceedings of the 2015 IEEE 2nd World Forum on Internet of Things (WF-IoT), Milan, Italy, 14–16 December 2015; pp. 553–558. [Google Scholar] [CrossRef]
- Murshed, M.G.S.; Murphy, C.; Hou, D.; Khan, N.; Ananthanarayanan, G.; Hussain, F. Machine Learning at the Network Edge: A Survey. ACM Comput. Surv. 2022, 54, 1–37. [Google Scholar] [CrossRef]
- Shi, W.; Cao, J.; Zhang, Q.; Li, Y.; Xu, L. Edge Computing: Vision and Challenges. IEEE Internet Things J. 2016, 3, 637–646. [Google Scholar] [CrossRef]
- Khan, R.; Yang, Y.; Liu, Q.; Qaisar, Z.H. Divide and conquer: Ill-light image enhancement via hybrid deep network. Expert Syst. Appl. 2021, 182, 115034. [Google Scholar] [CrossRef]
- Li, T.; Sahu, A.K.; Talwalkar, A.; Smith, V. Federated Learning: Challenges, Methods, and Future Directions. IEEE Signal Process. Mag. 2020, 37, 50–60. [Google Scholar] [CrossRef]
- Wang, S.; Tuor, T.; Salonidis, T.; Leung, K.K.; Makaya, C.; He, T.; Chan, K. Adaptive Federated Learning in Resource Constrained Edge Computing Systems. IEEE J. Sel. Areas Commun. 2019, 37, 1205–1221. [Google Scholar] [CrossRef] [Green Version]
- Sattler, F.; Wiedemann, S.; Muller, K.-R.; Samek, W. Robust and Communication-Efficient Federated Learning from Non-i.i.d. Data. IEEE Trans. Neural Netw. Learn. Syst. 2019, 31, 3400–3413. [Google Scholar] [CrossRef] [Green Version]
- Wang, Z.; Bovik, A.; Sheikh, H.; Simoncelli, E. Image Quality Assessment: From Error Visibility to Structural Similarity. IEEE Trans. Image Process. 2004, 13, 600–612. [Google Scholar] [CrossRef] [Green Version]
- TensorFlow Lite. Available online: https://www.tensorflow.org/lite/ (accessed on 20 March 2022).
Figure 1.
Plastic injection machines.

Figure 2.
Traditional PLC panels.

Figure 3.
LCD screen of PLC panels.

Figure 4.
The architecture of the proposed system.

Figure 5.
The IoT system implemented in a plastic injection factory.

Figure 6.
Array camera of the end device in IoT.

Figure 7.
The algorithm of feature extraction on TensorFlow Lite with a simple logistic regression structure.
Figure 7.
The algorithm of feature extraction on TensorFlow Lite with a simple logistic regression structure.

Figure 8.
The mapping of the proposed IoT to real production process.

Figure 9.
The result of scene changes in six continuous frames (A)frame 1; (B) frame 2; (C) frame 3; (D) frame 4; (E) frame 5; (F) frame 6.
Figure 9.
The result of scene changes in six continuous frames (A)frame 1; (B) frame 2; (C) frame 3; (D) frame 4; (E) frame 5; (F) frame 6.

Figure 10.
The real-time monitoring process of the actual operation of plastic injection machines.

Figure 11.
The record of the status of scene change detection in the database.

Figure 12.
The experimental results.


Table 1.
The relationship between PLC panel features and corresponding events.
| Event | Underfilling | Shrinkage | Overflow | Rupture | Sticky | Matt | Spots | Embrittlement | |
|---|---|---|---|---|---|---|---|---|---|
| Feature | |||||||||
| Injection pressure | I/2 | I/2 | R/1 | R/1 | R/1 | I/2 | I/2 | ||
| Injection Speed | I/3 | I/3 | R/3 | R/3 | R/3 | I/3 | I/3 | ||
| Injection time | I/3 | I/3 | R/3 | R/3 | R/3 | I/3 | I/4 | ||
| Injection amount | I/1 | I/1 | R/2 | R/2 | R/2 | R/2 | I/4 | ||
| Second Injection P | I/4 | I/4 | R/4 | R/4 | R/4 | R/4 | I/4 | ||
| Second Injection T | I/4 | I/4 | R/4 | R/4 | R/4 | R/4 | I/5 | ||
| Mold temperature | I/2 | R/5 | R/1 | R/4 | R/5 | R/5 | I/1 | ||
| Nozzle temperature | R/1 | ||||||||
| Material temperature | I/5 | R/6 | R/1 | ||||||
| … | … | … | … | … | … | … | … | … | |
Publisher’s Note: MDPI stays neutral with regard to jurisdictional claims in published maps and institutional affiliations. |
© 2022 by the authors. Licensee MDPI, Basel, Switzerland. This article is an open access article distributed under the terms and conditions of the Creative Commons Attribution (CC BY) license (https://creativecommons.org/licenses/by/4.0/).
Share and Cite
MDPI and ACS Style
Tsai, Y.-H.; Chang, D.-M.; Hsu, T.-C. Edge Computing Based on Federated Learning for Machine Monitoring. Appl. Sci. 2022, 12, 5178. https://0-doi-org.brum.beds.ac.uk/10.3390/app12105178
AMA Style
Tsai Y-H, Chang D-M, Hsu T-C. Edge Computing Based on Federated Learning for Machine Monitoring. Applied Sciences. 2022; 12(10):5178. https://0-doi-org.brum.beds.ac.uk/10.3390/app12105178
Chicago/Turabian StyleTsai, Yao-Hong, Dong-Meau Chang, and Tse-Chuan Hsu. 2022. "Edge Computing Based on Federated Learning for Machine Monitoring" Applied Sciences 12, no. 10: 5178. https://0-doi-org.brum.beds.ac.uk/10.3390/app12105178
Note that from the first issue of 2016, this journal uses article numbers instead of page numbers. See further details here.