Article

Application of Territorial Laser Scanning in 3D Modeling of Traditional Village: A Case Study of Fenghuang Village in China

1
Department of Civil, Environmental and Architectural Engineering, University of Padua, 35131 Padova, Italy
2
Malaysia Campus, Xiamen University Malaysia, Sepang 43900, Malaysia
3
Department of Civil, Architectural and Environmental Engineering, University of Naples Federico II, 80125 Napoli, Italy
4
Department of Urban Planning, Shenzhen University, Shenzhen 518061, China
*
Author to whom correspondence should be addressed.
ISPRS Int. J. Geo-Inf. 2021, 10(11), 770; https://0-doi-org.brum.beds.ac.uk/10.3390/ijgi10110770
Submission received: 13 September 2021 / Revised: 20 October 2021 / Accepted: 7 November 2021 / Published: 12 November 2021
(This article belongs to the Special Issue Cultural Heritage Mapping and Observation)

Abstract

:
Historical villages bear historical, cultural, architectural, aesthetic, and landscape values, but they are facing a series of dangers and problems during the process of urbanization. Digital survey for traditional villages plays a crucial role in the preservation, planning, and development of this kind of heritage. The introduction of the terrestrial laser scanning technique is essential for heritage surveying, mapping, and modeling due to its advantages of noncontact measurement, accurate sensing of complex objects, and efficient operation. In recent years, TLS and related processing software (“SCENE”) have been widely presented as effective techniques for dealing with the management and protection of historical buildings in Fenghuang village. Thus, this paper highlights the process of using laser scanning to obtain architectural data, process point clouds, and compare the characteristics of historical buildings in Fenghuang village. The cloud-to-cloud registration technique is applied to build point clouds. As a result of model construction, some architectural patterns are summarized in this village, such as the spatial sequence of ancestral halls, the dominant position of memorial halls, and the character of building decorations and roof slopes. Furthermore, a BIM model is also explained to fulfill the statistical function for architectural components. In the future, more research can be fulfilled based on the built point cloud model, which will be beneficial for the development of the whole village.

1. Introduction

In the age of fast economic development and urbanization, traditional villages and rural lifestyles are confronted with a series of crises, especially in developing countries such as China. Some phenomena have been observed, such as migration from rural areas to cities, the disappearance of rural culture, damaging of architectural buildings, abandonment, and occupation of agricultural lands, which have caused detrimental impacts on rural development. Moreover, the values of historical villages have been gradually reconsidered. In China, more than 4000 villages are acknowledged as national traditional villages due to their historical, cultural, architectural, aesthetic, and landscape values [1]. There is an increasing number of scholars involved in studies on the protection of traditional villages [2], rural landscape [3], tourism of historical villages [4], and revitalization of the rural economy [5]. In particular, the protection of rural architectural heritage remains a topical issue among architects, landscape architects, and urban planners. Compared with urban areas, rural areas are peculiar owing to their characteristics in architectural forms. Building materials such as wood, stone, and earth are common for rural buildings but also very vulnerable. Thus, preserving the architectural heritage in rural areas is an important factor for stimulating the local economy, promoting rural tourism, and facilitating cultural inheritance [6,7]. It is imperative to protect the authenticity and integrity of these villages as part of cultural assets for future generations.
With the advancements of the internet and spatial technologies, more techniques are introduced into the identification, documentation, protection, and restoration of the heritage of traditional villages, such as building information modeling (BIM), augmented reality (AR), and geographic information system (GIS). In practice, GIS is used for studying the management of rural heritage based on its geodatabase [8], analyzing spatially the evolution of the rural landscape [9], and helping make decisions associated with the analytic hierarchy process (AHP) [10]. Furthermore, remote sensing (RS) techniques are also applied to monitor and assess rural sites, predicting the hazards in their surrounding areas [11], classifying the resource types of rural tourism [12], etc. Among those, light detection and ranging (Lidar), digital photogrammetry, and territorial land scanning (TLS), as some of the latest techniques applied in surveying and mapping, are considered to be efficient and powerful in heritage, archaeological, ecological, and landscape studies [13], especially in the process of data acquisition, site survey, mapping, and modeling [14]. As known, different remote sensing methods have different characteristics and are used in various fields to obtain real-time data. It is necessary to select a suitable surveying and mapping method according to the specific characteristics and requirements of the objectives and tasks.
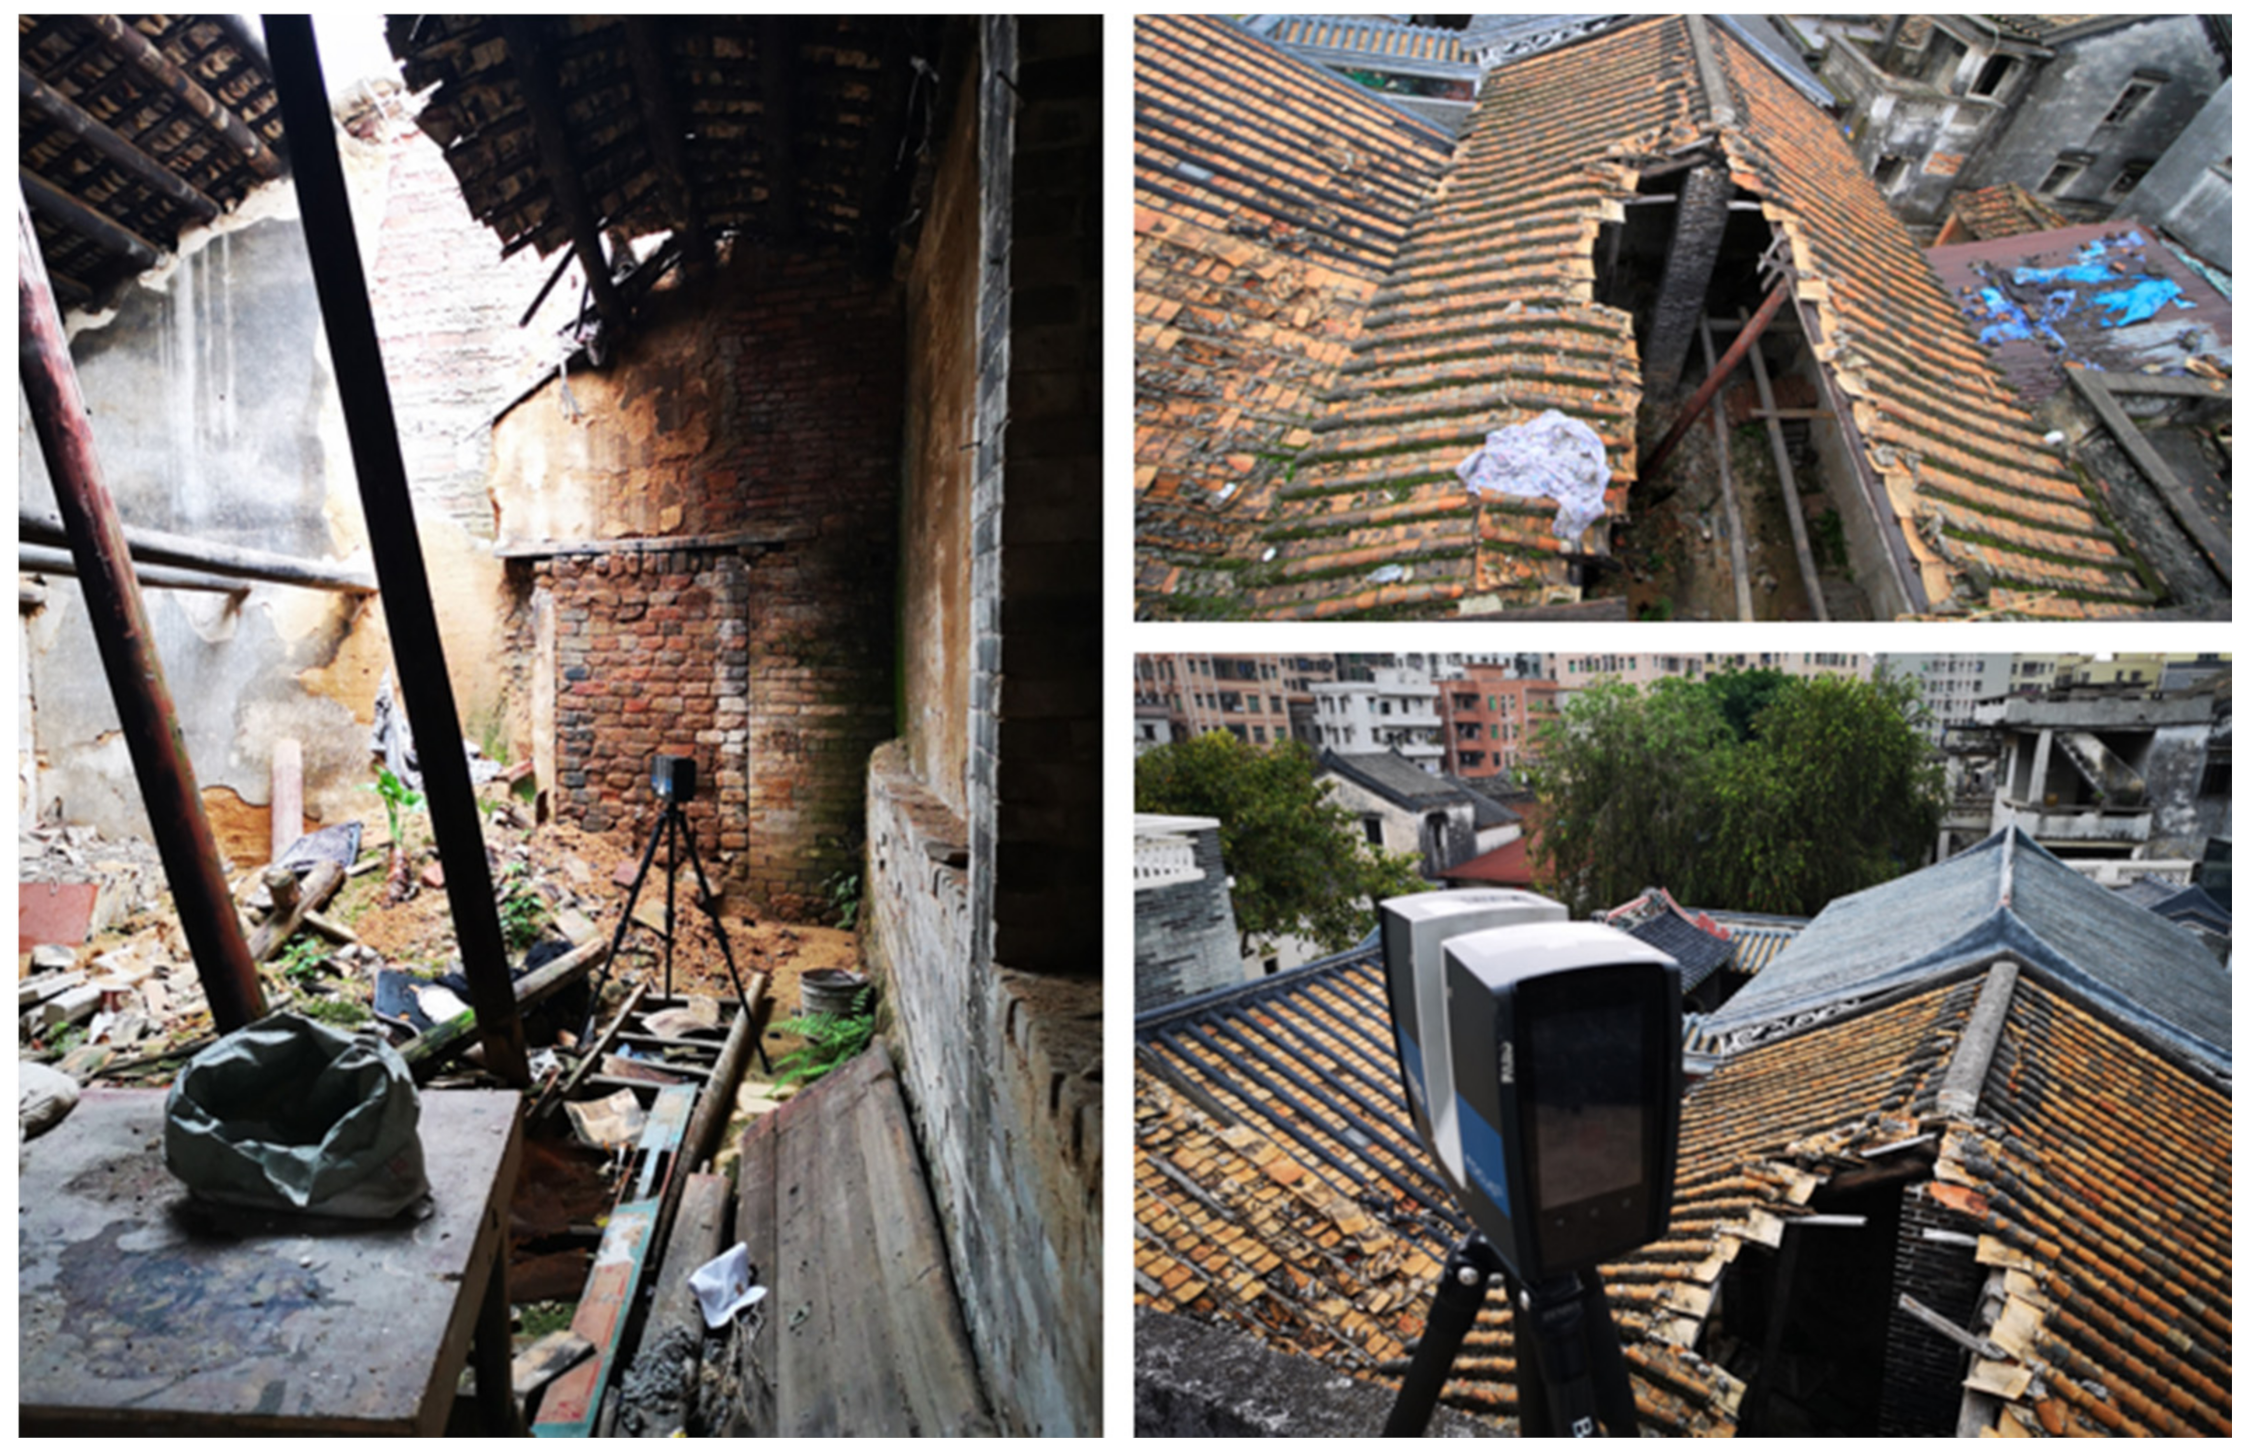
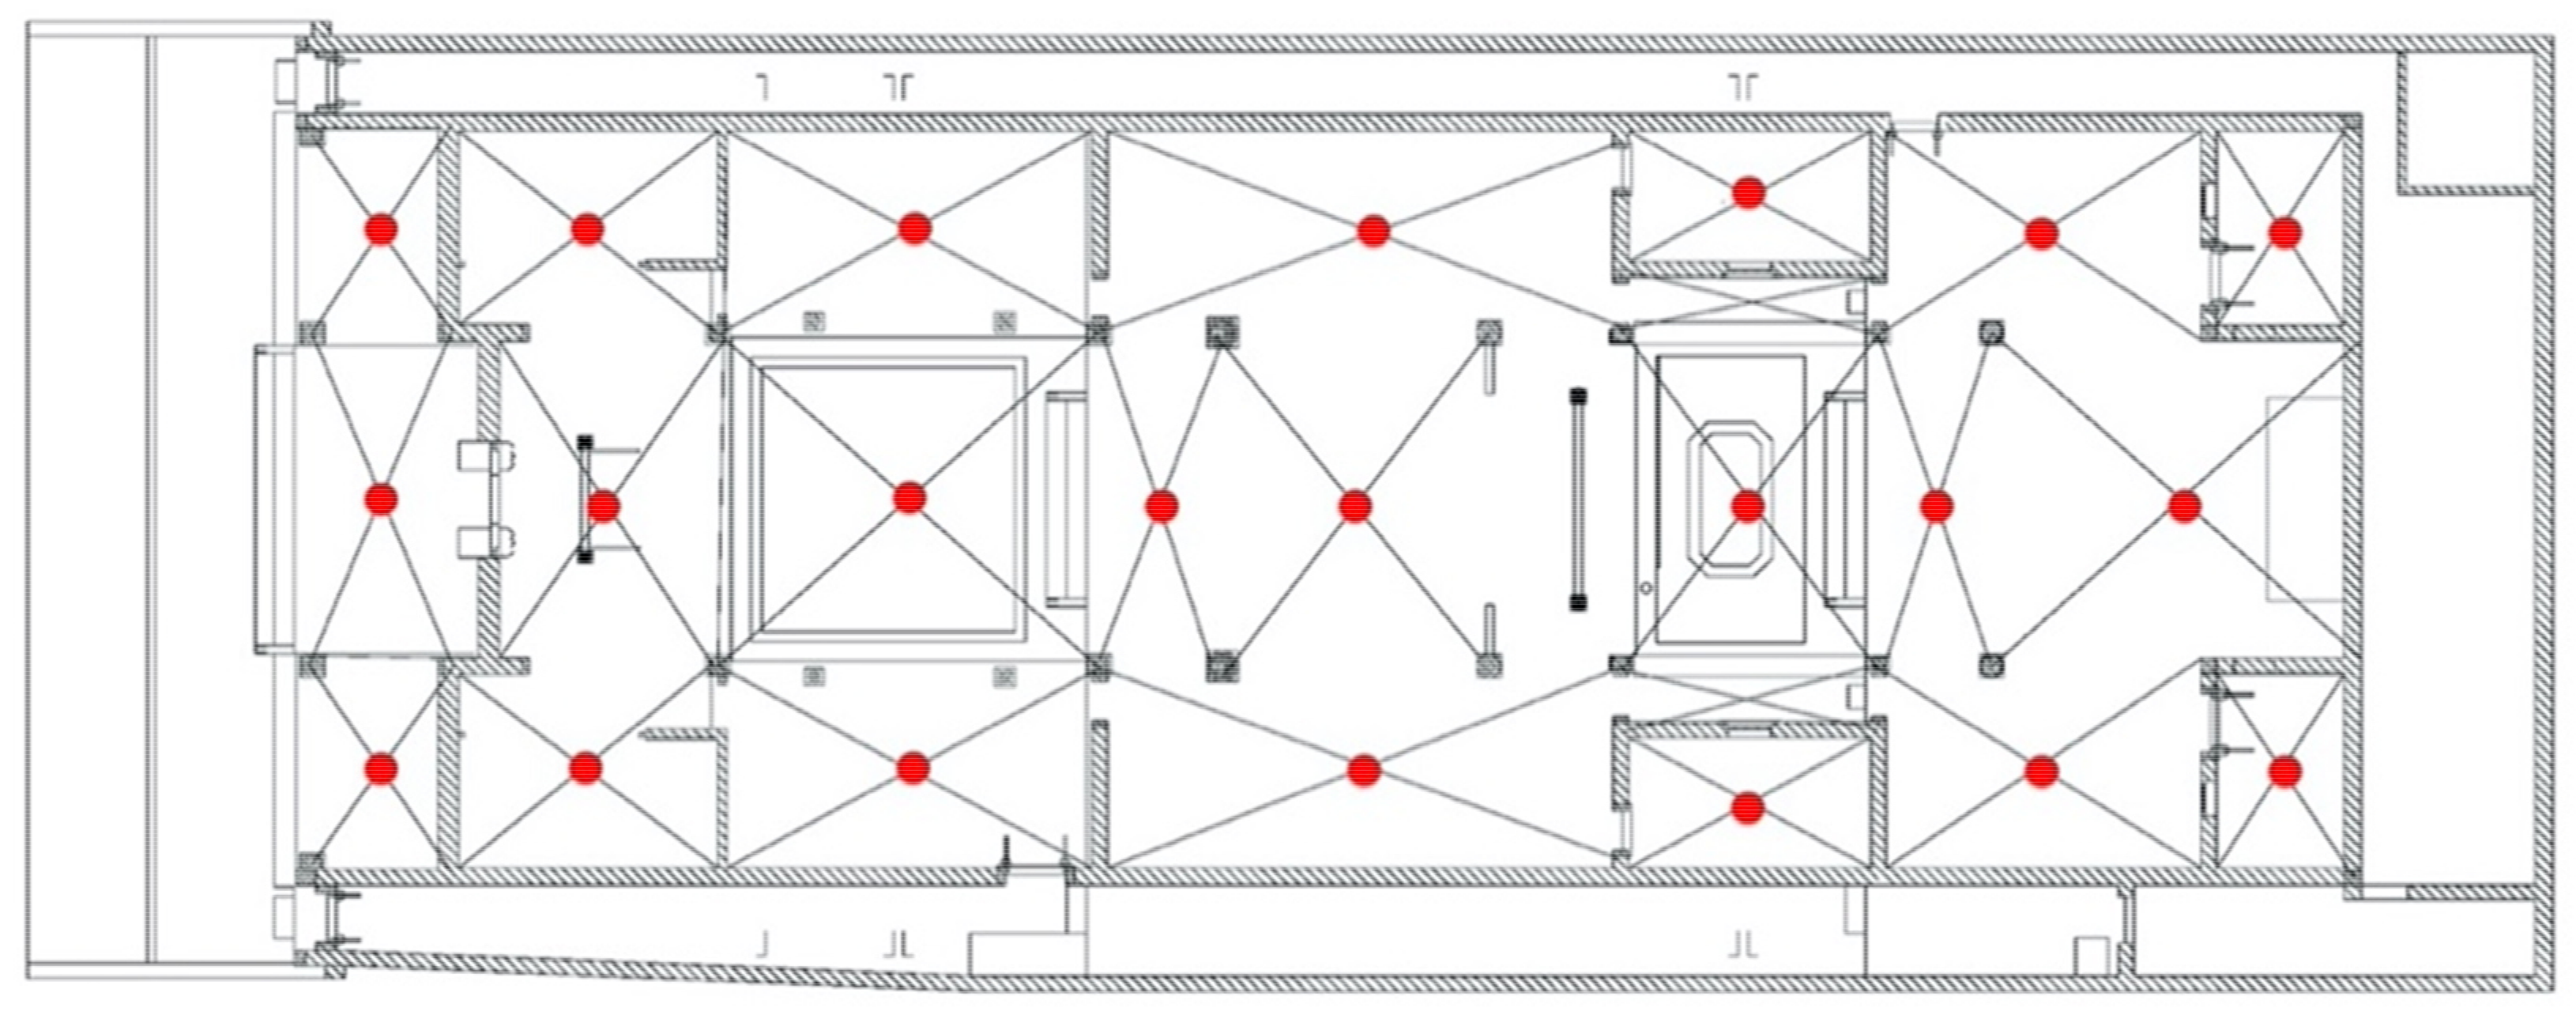
Compared with traditional measuring techniques, TLS technology is an automatic, noncontact, and accurate method for measuring the coordinates of object surfaces systematically, providing precise 3D information of the environment [15], which has the advantages of sensing detailed data (building appearance, structures, colors, field of view, noise level, incidence angle, waveform, texture, and surroundings with high accuracy); simple, faster, and efficient operation; less physical damage to objects; and being effective for scanning irregular surfaces and complicated structures. Ancient Chinese architectural buildings abundant in details and decorations can easily be damaged by survey instruments. Therefore, TLS is a powerful instrument to support related projects for surveying ancient buildings and structures. Additionally, the images of high spatial resolution obtained by coordinate systems can be simply used to build model visualizations based on point clouds from TLS and connected with other GIS data, which facilitate the observation of architectural details and enable viewing heritage sites from different angles, distances, and scales [16]. However, TLS still has several shortcomings awaiting further improvement, e.g., height limitations of the sensor to record the roof of buildings and other environmental influences on the sensing process. For example, light and shadow conditions will change the color and texture of an architectural surface, influencing the accuracy of obtained data.
As seen, TLS has both advantages and disadvantages in diversified applications. Regardless, it has been introduced into cultural heritage projects globally. For instance, the combination of UAS photogrammetry and TLS allows generating dense and accurate 3D models of historical buildings [17], the integration of TLS and image-based data allows developing metric documentation of historical objects in museums based on orthophoto generation [18], and the fusion of Amyotrophic Lateral Sclerosis (ALS) and TLS, with the help of reference points, is used to extract and document cultural heritage [19]. There are also many other case studies in various countries focusing on the recording and documentation of historical buildings, such as Haut-Andlau Castle in France [20], the Al-Khazneh heritage in Jordan [21], and Roman sarcophagi in Italy [22].
However, the application of TLS in rural heritage and traditional village protection has seldom been discussed [23]. The sensing of a whole village varies from the process of surveying single architectural buildings, which means that more conditions need to be considered comprehensively, including the characteristics and relationships between the measuring objects; the purpose of measurement, architectural elements, and contents; technical requirements; internal and external space; time; and cost. The collected sensing results can be applied in digital documentation, interpretation, protection, transformation, and redevelopment design. Specifically, the TLS data and built point cloud models of traditional villages can be used to compare the historical buildings inside a village, such as the difference in their architectural layout, internal areas, heights, decorations, and roof slopes, which will serve the future management, planning, and development of traditional villages, as well as rural tourism activities.
Point clouds are the main outputs of TLS, which refer to a set of coordinated points with geometric and colorimetric information. Point clouds are usually obtained from the process of photogrammetry and laser scanning surveys, which are broadly diffuse. Three-dimensional (3D) point clouds of cultural heritages and sites are quite important for the later modeling process because they can identify and differentiate structural and ornamental architectural components, map various stages of conservation and materials, and allow automatic recognition of comparable architectural features as preparation for building information modeling. Methods to classify point clouds have been discussed in previous research. For example, for the supervised categorization of point clouds for heritage, machine and deep learning methods are introduced [24], as well as other image segmentation approaches [25]. Other perspectives for the application of point clouds have also been discussed over the years, such as the reconstruction of structural surface models of heritage [26], vault realization, and irregular surface modeling [27]. However, to apply point clouds into rural heritage studies, there are more possibilities to discuss further. The creativity of this paper lies in its combination between point clouds and large-scale traditional villages, compared with single building modeling in the past.
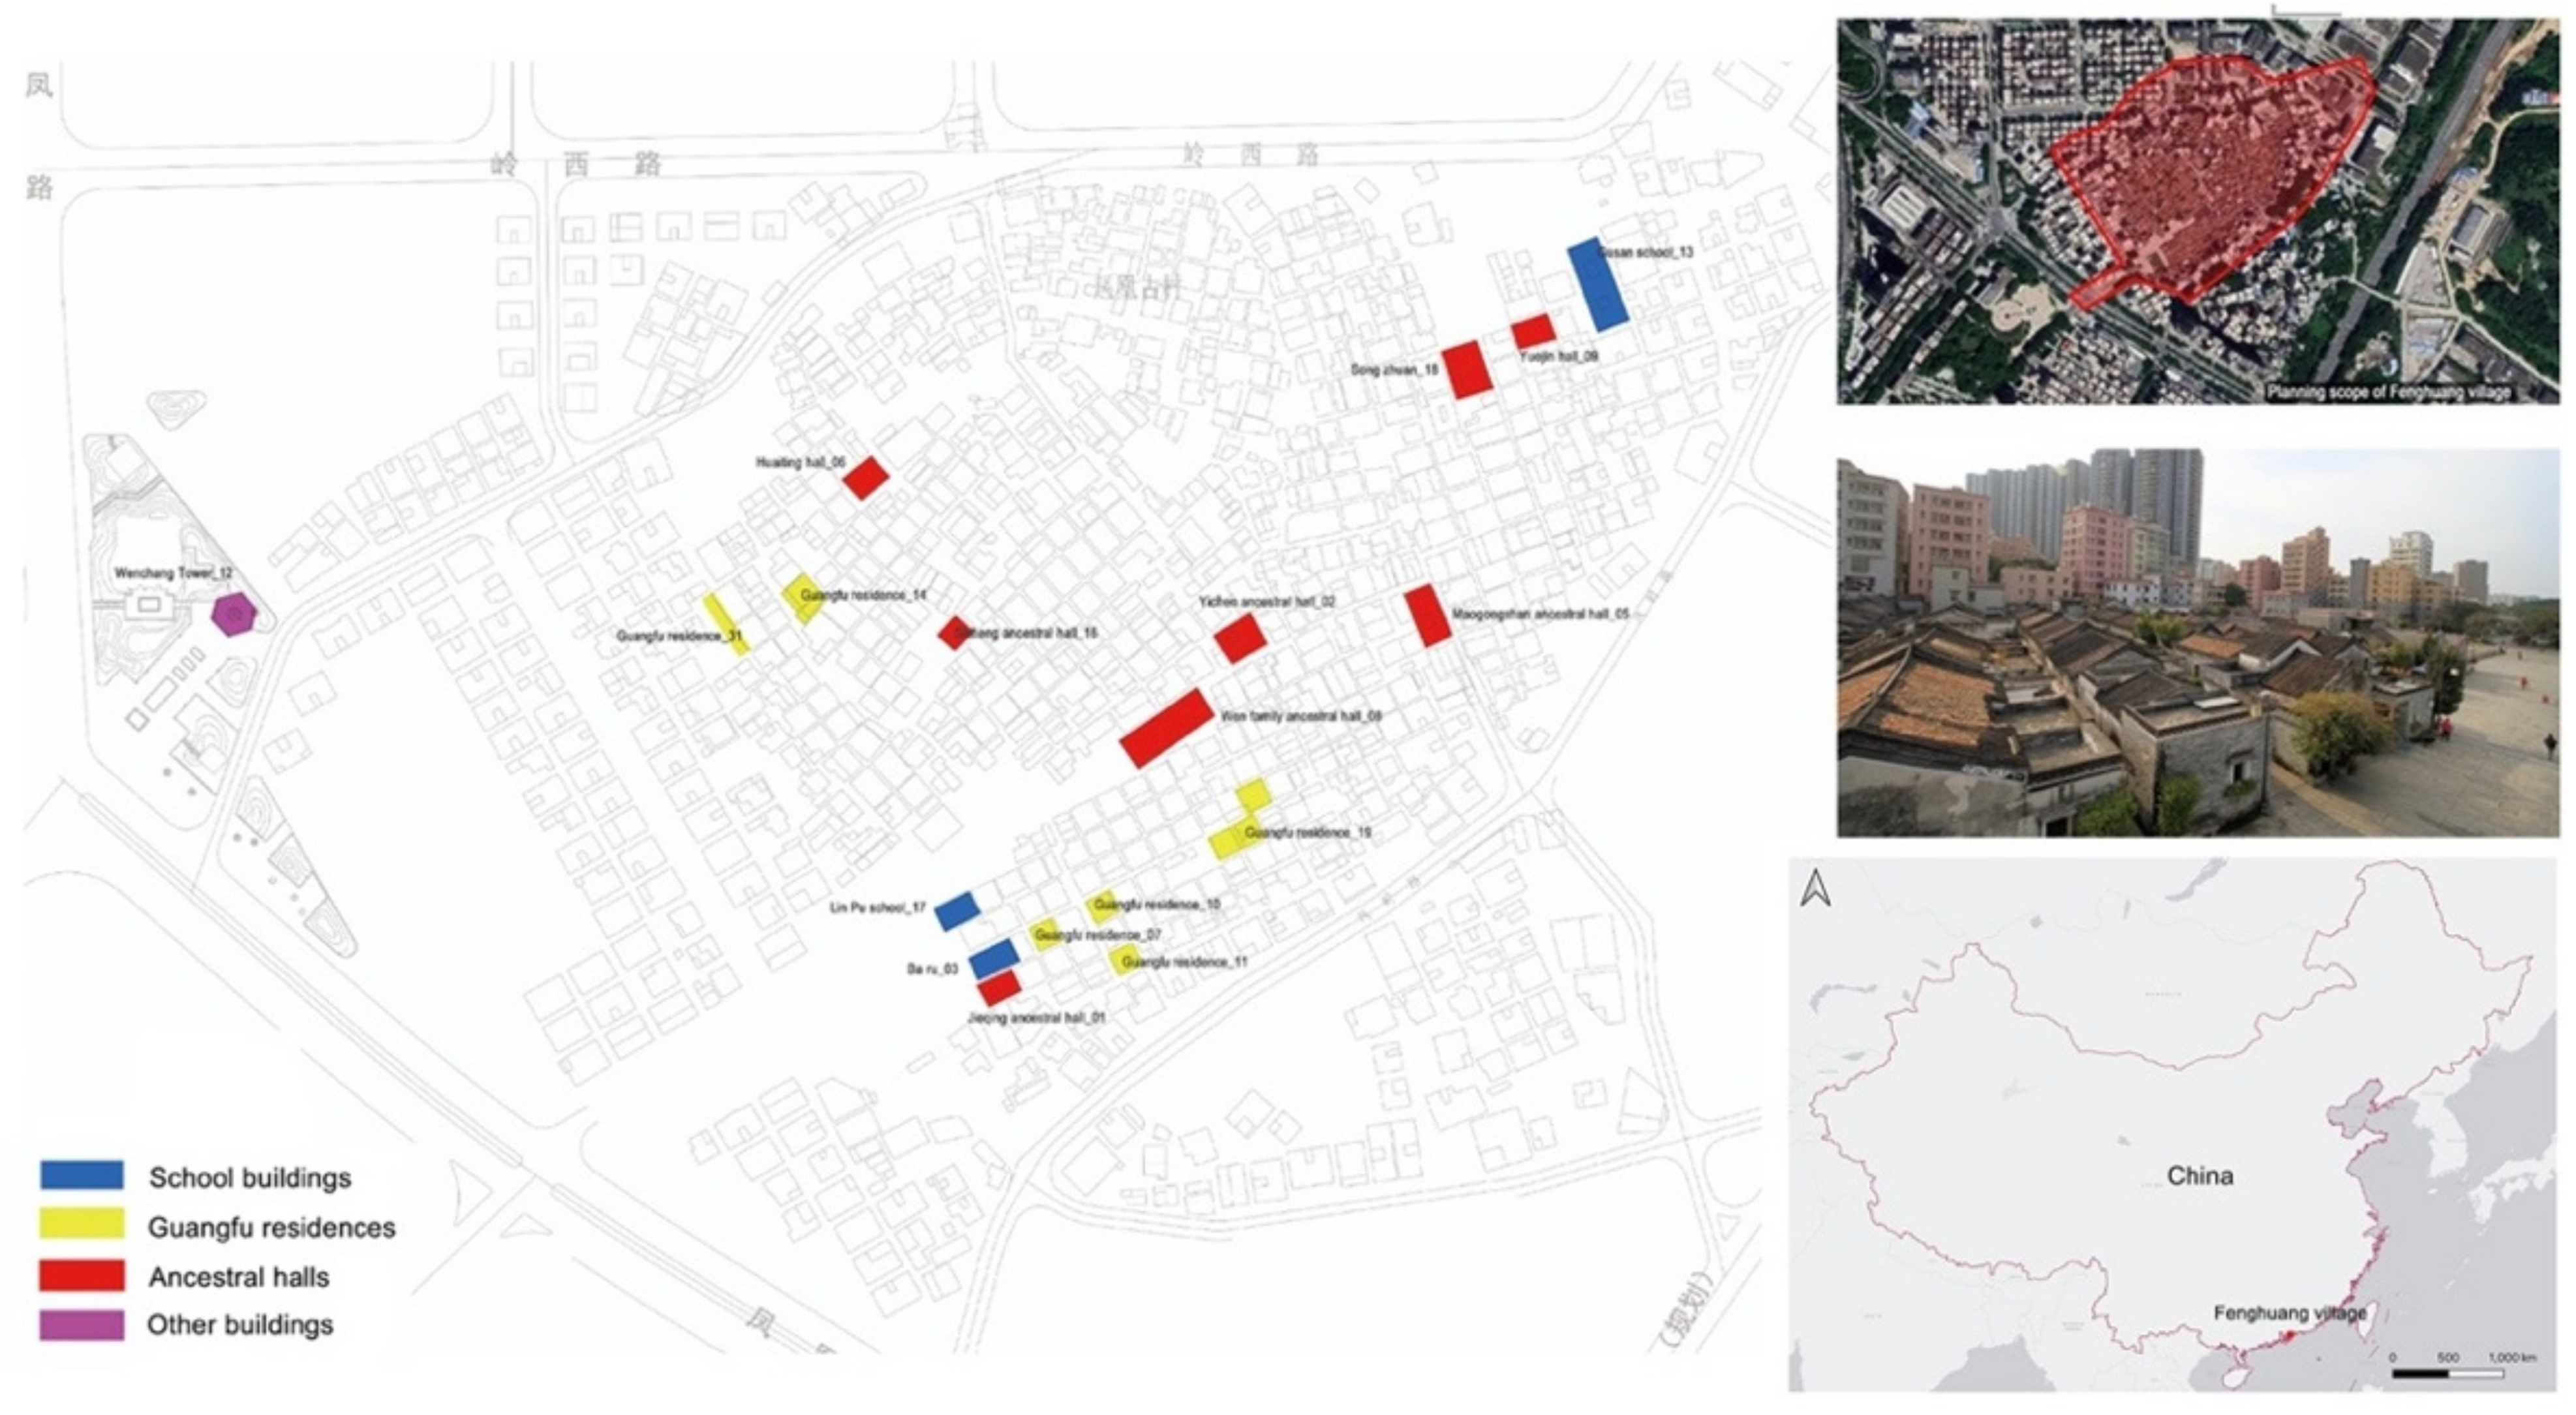
Based on the discussion above, this paper takes the historical buildings in Fenghuang village as research subjects, introducing TLS and point cloud modeling as the main methodology. The survey method focuses on using TLS to acquire comprehensive architectural data of the diverse elements of historical buildings in Fenghuang, including five steps: designing the scanning scheme, obtaining site data, processing point clouds, and comparing the historical buildings. The internal and external parts of the buildings are both recorded by TLS, and the roof parts are scanned. The workflow in this paper, especially the scanning of roofs with TLS, is beneficial for overcoming the problems caused by insufficient ground information in traditional methods. After registration and denoising of point clouds, the point cloud models are built, which is an important process to update the documentation of historical buildings in Fenghuang village.

2. Materials and Methods

2.1. Study Area

Fenghuang Ancient Village is located in Shenzhen, Guangdong province, in the South of China. It covers an area of about 300,000 square meters, with a built-up area of 180,000 square meters. Dated back to the end of the Song Dynasty in China in the 1300s, a family named WEN moved to this region to avoid wars and successfully constructed their community there. Thus, this village has a history of more than 700 years. The terrain near the village is undulated and has thus determined the fan-shaped layout of the village. There are several ancient buildings well preserved in the village, which can be mainly classified into three groups according to their functions: ancestral halls for worshipping ancestors, school buildings for education, and Guangfu residences (also known as Cantonese houses) for living. These three types of buildings are characteristic of this village (Figure 1). Fenghuang is regarded as one of the typical and representative Cantonese residential buildings in Guangdong province. As a result, the whole village is listed as a cultural heritage by the local authority. However, its current status of protection is not very optimistic, facing both dangers and opportunities for its future.
Until now, there have been very limited studies concerning this village dissociating from its local culture and the economic redevelopment strategies. Nevertheless, the architectural value of its ancient buildings has been ignored. With the rapid development of the urbanization process in Shenzhen, a number of indigenous people gradually moved out, and some old houses began to be abandoned, which led to problems such as building aging and the destruction of historical features of the traditional village. Additionally, relevant historical documents recording the history of Fenghuang village have not been well preserved, which means that an overall heritage investigation is urgently needed. Currently, there are in all nearly 360 ancient buildings remaining in Fenghuang village, of which 21 are listed as protective cultural relics in Shenzhen, awaiting further study and development. A comprehensive survey and mapping need to be performed to assess the current condition of the historical buildings in Fenghuang village, and a conservation and redevelopment strategy needs to be carried out for the whole area. However, it will consume a lot of time and human resources to survey all the 360 ancient buildings in the village, and more cooperation with other scholars and institutions will also be needed. Due to the limitation of funds and time, only 19 traditional buildings with high historical and cultural values were selected as objects to be scanned and modeled for this village.

2.2. Methodology

According to distance measurement, the scanning technology can be classified into three types, time of flight (TOF), triangulation, and phase shift, among which the TOF technique is widely used in outdoor surveys [28]. Among these, the TOF sensor emits a laser pulse, and a portion of the pulse reflected from the building surface can be received by the scanner. Then, the distance to the object’s surface can be calculated by the flight time of the pulse. In contrast to other techniques, TOF can directly estimate and measure the distance of pixels. Thus, the depth map can always be complete, and the latency time remains minimal. Additionally, a significant benefit of the TOF camera is its capacity to withstand variable light conditions and the fact that no picture contrast is required to identify the fork pockets. Based on these advantages, TOF is utilized in this project.
Inspired by previous research on TLS and cultural heritage [29], the workflow of TLS and 3D modeling in this paper is divided into two sections, external and internal operations (Figure 2), further developed into five steps, including designing the scanning scheme, obtaining site data, and processing point clouds (registration, denoising, and feature extraction). Finally, the built models are applied to compare the historical buildings in the village from four aspects: layout, height, decorations, and roof slope. The specific steps are shown in Figure 2, and the guidelines for processing these point cloud data mainly refer to previous studies [30,31].

2.2.1. Designing Scanning Scheme and Data Collection

During the process of data collection, laser pulses can only be transmitted in a straight line. To fully measure objects, the arrangement of scanners is crucial for 3D digital scanning, which influences the accuracy, efficiency, and quality of the data processing and output. The distribution and structure of buildings in Fenghuang village are complex, requiring a series of scanning stations to cooperate with each other to scan from different angles and improve the coverage and completeness of the data. It is necessary to arrange the scanning stations accurately to greatly increase survey speed and data integrity while at the same time reducing workload.
As for the measuring device, an appropriate scanner is significant to control scanning accuracy and efficiency. There are several factors to consider when selecting a scanner for surveying Fenghuang village. The equipment needs to meet the needs of scanning various scales of the site from the overall, single building, and building component levels. Then, owing to site conditions, such as the difference between the maximum and minimum scanning distances, scanning angles, and the limitation of space, the size and weight of the instrument are also necessary to take into consideration. The number of surveying personnel, the quality of output data, and their usage also need to be included in research costs.
Based on the aforementioned conditions, this research introduces the “Faro S350 scanner” (Figure 3) (https://www.faro.com) (accessed date: 10 September 2021) to survey and model the ancient buildings in the village, as well as other information on the architectural details. Specifically, this instrument has a measurement rate of about 976,000 points/s, and the maximum scanning range is about 350 m, covering 360 degrees horizontally and 300 degrees vertically. The error of the collected data is smaller than 6 mm. This scanner has a spherical digital camera that can take six photos (1920 × 1080 pixels) to record the RGB color and texture information of the scanned object during each scan. The Faro scanner has the characteristics of light weight, small size, simple operation, and easy adjustment. The scanner station can be moved quickly, and it is suitable for sensing building clusters with high density. Finally, this scanner is equipped with its own processing software “SCENE” (https://www.faro.com/en/Products/Software/SCENE-Software) (accessed date: 10 September 2021), which can automatically process point cloud data, and users can create 3D visualizations of real objects and environments in multiple data formats.
When deploying scanning stations for buildings in Fenghuang village, auxiliary equipment is also needed to support the process. For example, when scanning the Gushan school in the village, the roof part of the building could not be reached with the normal height of the Faro scanner. Thus, a liftable tripod was used to raise the height of the scanner to increase its scanning range. In Figure 4, the control points of the scanning stations are marked in red color, with numbers 1–38 indicating that, in all, 38 scans were introduced to record the Gushan school. The blue points in the figure indicate the lifted stations. During the scanning process, the corresponding feature points were combined, such as the turning angles of the roof, to complete the splicing of point clouds from each site. When scanning the interior spaces, the complicated structures, including the overlapped and interspersed beams, and layered columns, buckets, arches, trusses, rafters, and purlins caused some challenges for data acquisition. After several tests, we used the columns as reference points to improve the scanning coverage and working efficiency. As shown in Figure 5, in all, 20 scanning stations were set up to scan the Gushan school.

2.2.2. Point Cloud Processing

The point clouds collected from the laser scanner contain a large amount of data, which may contain errors called “noise”. Noise is caused by the measurement methods and equipment, the surface of the scanned building, and obstructions such as pedestrians, debris, and trees. Before modeling the point clouds, it is necessary to first denoise the data. In this way, the point clouds will be filtered to be smoother and less dense, which facilitates the modeling and packaging process. A manual process was added to reduce the errors in the computer.
After denoising, the obtained data from different scanning stations need to be unified with each other, namely the registration of point cloud data from multiple sites. To unify the data from various angles, a coordinate system (WGS 84) was fixed as a benchmark to unify all the independent coordinates into one coordinate system. In this research, three methods of registration were applied: based on targets (identify the matching target, fit the target point, and use the spatial relationship of the target points to transform their coordinates), common feature points, and control network.
For the original point clouds obtained by TLS, this study uses the software “SCENE” to register, map, and clean the data. This method consists of several steps, including selecting the base points, rotating their axis, setting rotation angles, moving the point clouds in space, and merging them. During this process, the “cloud-to-cloud” technique for registration was applied. The targets of objects were not necessary, but directly, the point clouds were aligned to each other by the software through the extracted features within the overlapped areas among point clouds. The color information of the point cloud was also recorded by the digital camera on TLS. Due to a high overlap rate in this process (higher than 40%), a dense point cloud could be generated by this technique. Therefore, the point cloud in this research has a high spatial resolution (1 cm), which means a high accuracy of modeling information. They were also registered with the three spherical target references.
The result of registered point clouds of the Gushan school is shown in Figure 6. In this case, the maximum registration deviation of all TLS data was lower than 4 mm, which is within the required tolerance of 6 mm. Through the mapping operation, the photos taken by the scanner’s camera during the scanning process were used to assign colors to each point cloud so that all the point clouds were visually distinguished. Finally, the redundant data, including noise, isolated points, and overlapped points, were filtered and manually removed.

3. Results

3.1. Model Comparisons

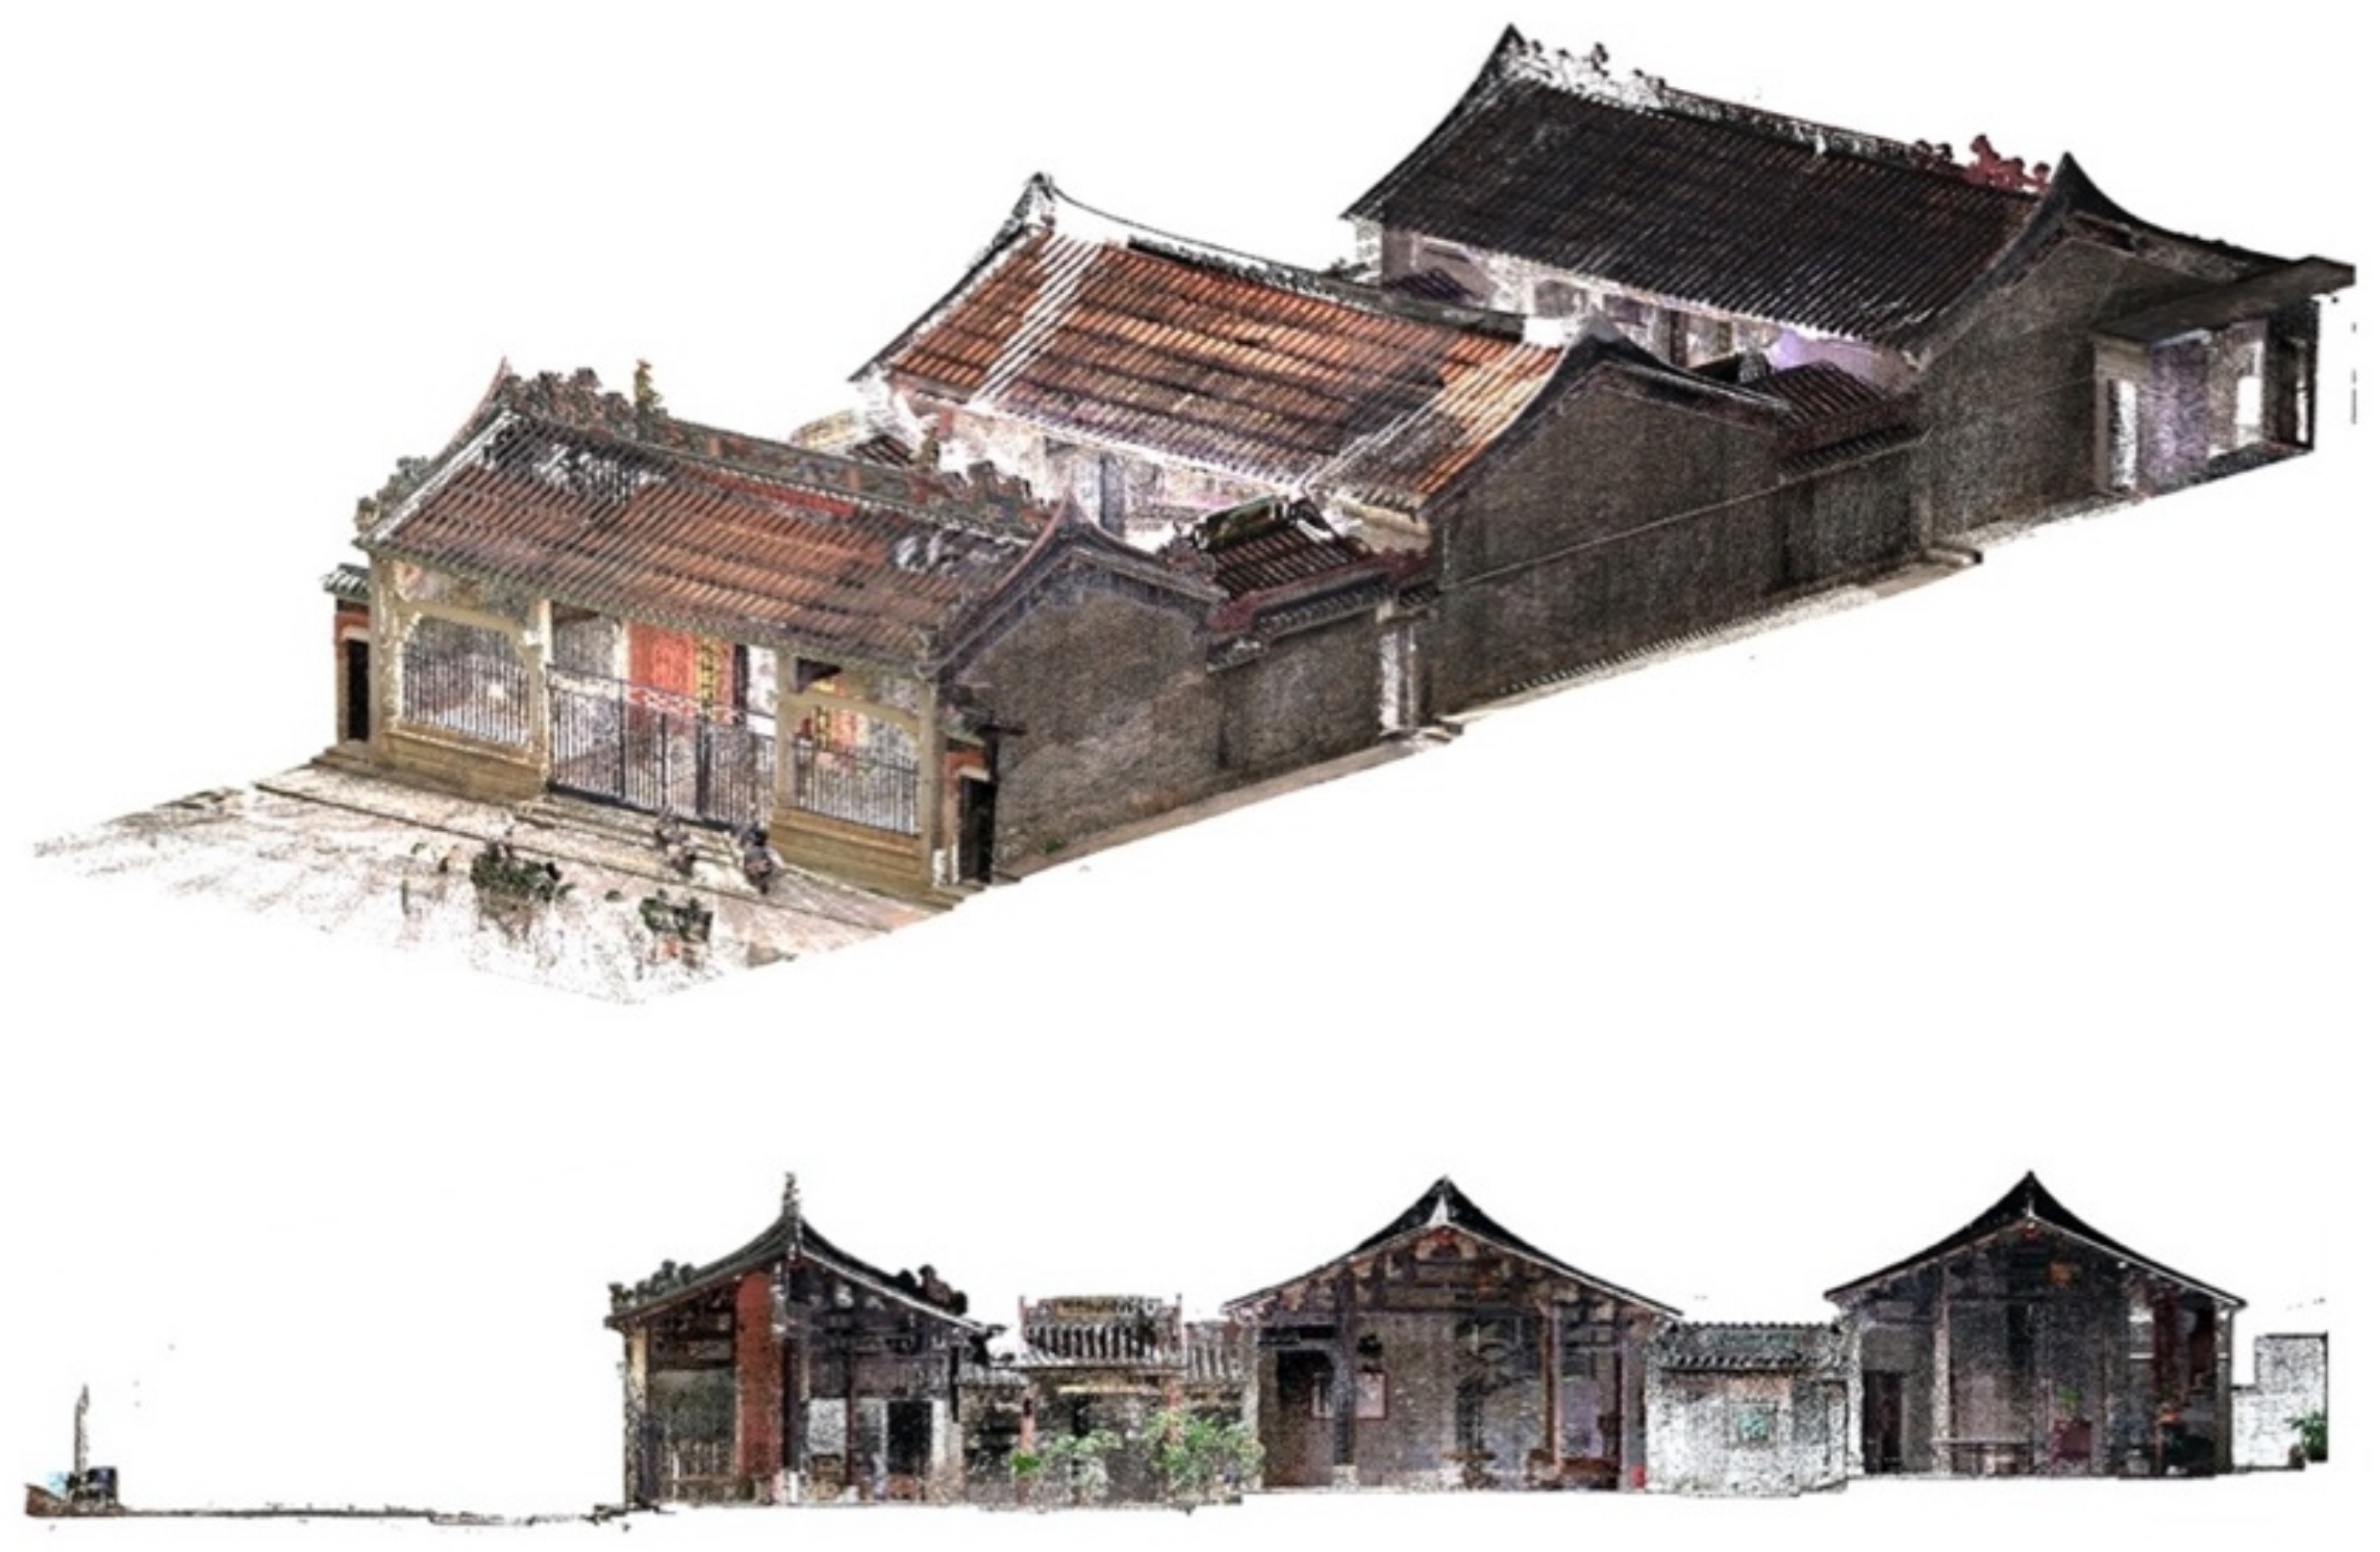
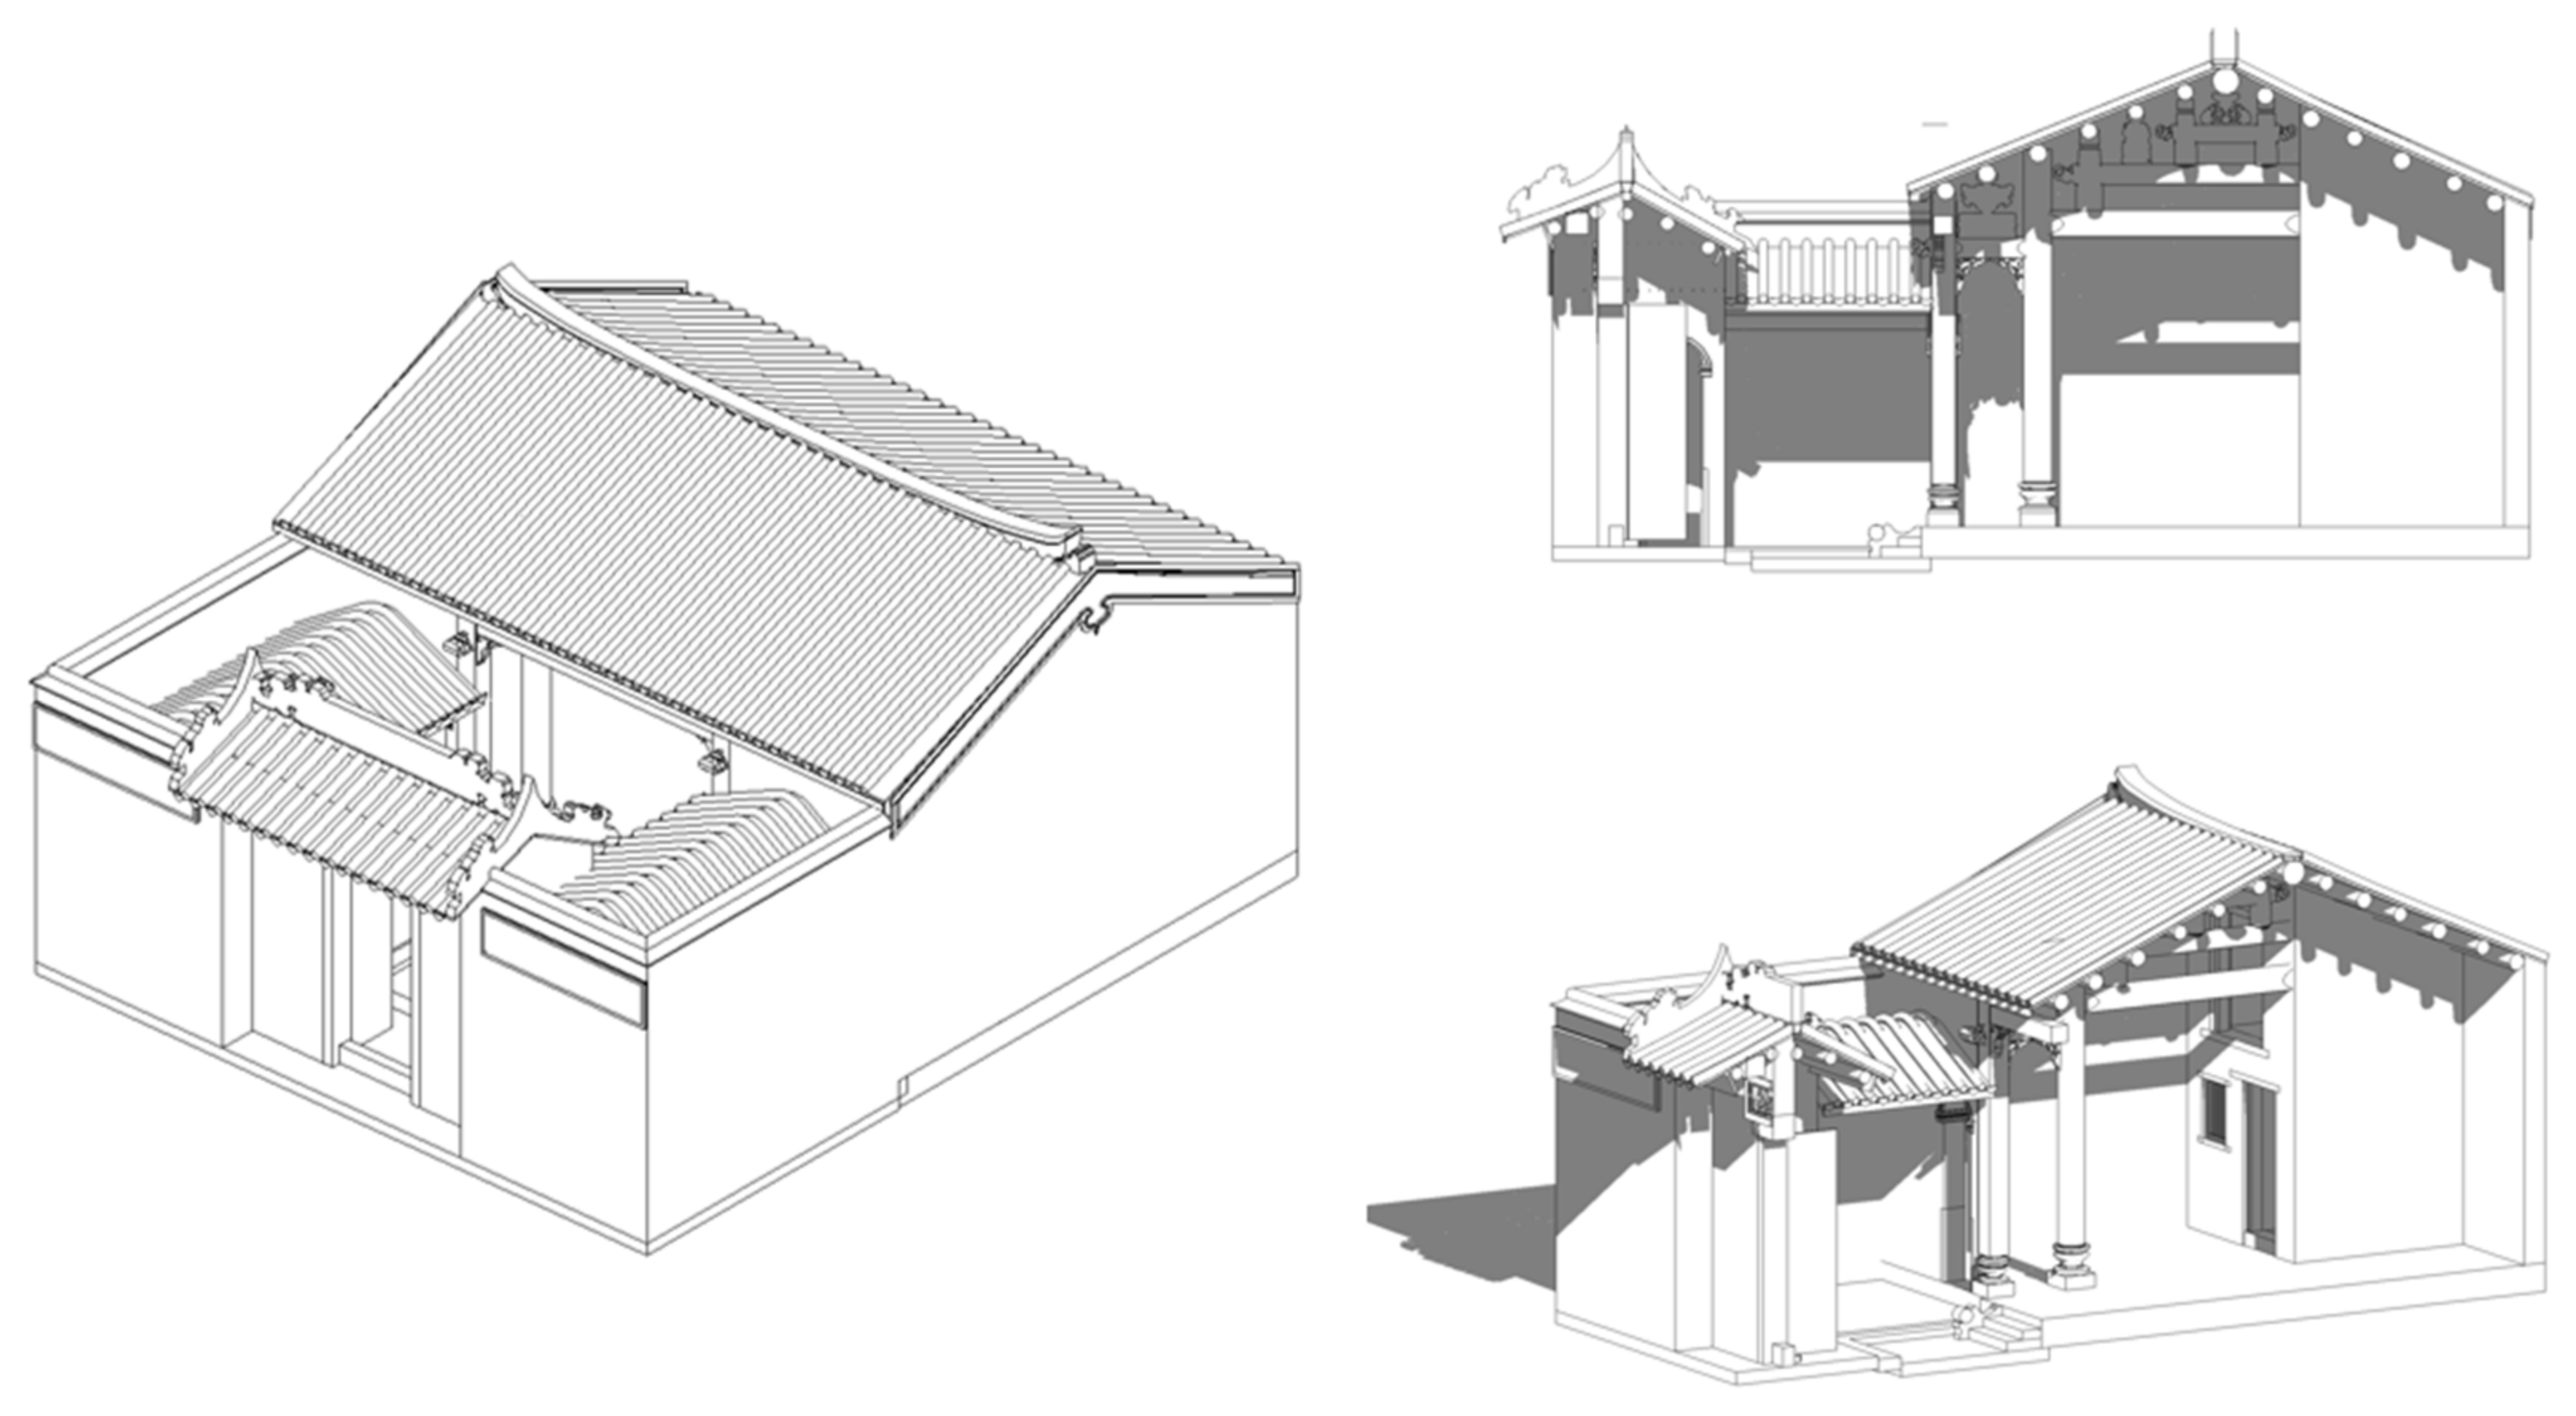
After scanning all the 19 buildings in the village, the point models of these buildings were constructed. Then, these models were compared with each other within the three groups of the ancestral halls, school buildings, and Guangfu residences. In this section, some examples of the ancestral halls are used to explain the research results and their comparisons, including Wen Family Ancestral Hall, Songzhuang Ancestral Hall, Yichen Ancestral Hall, and Sisheng Ancestral Hall. They are analyzed from the perspectives of the architectural layout (internal spaces), decorations, heights, and roof slopes.
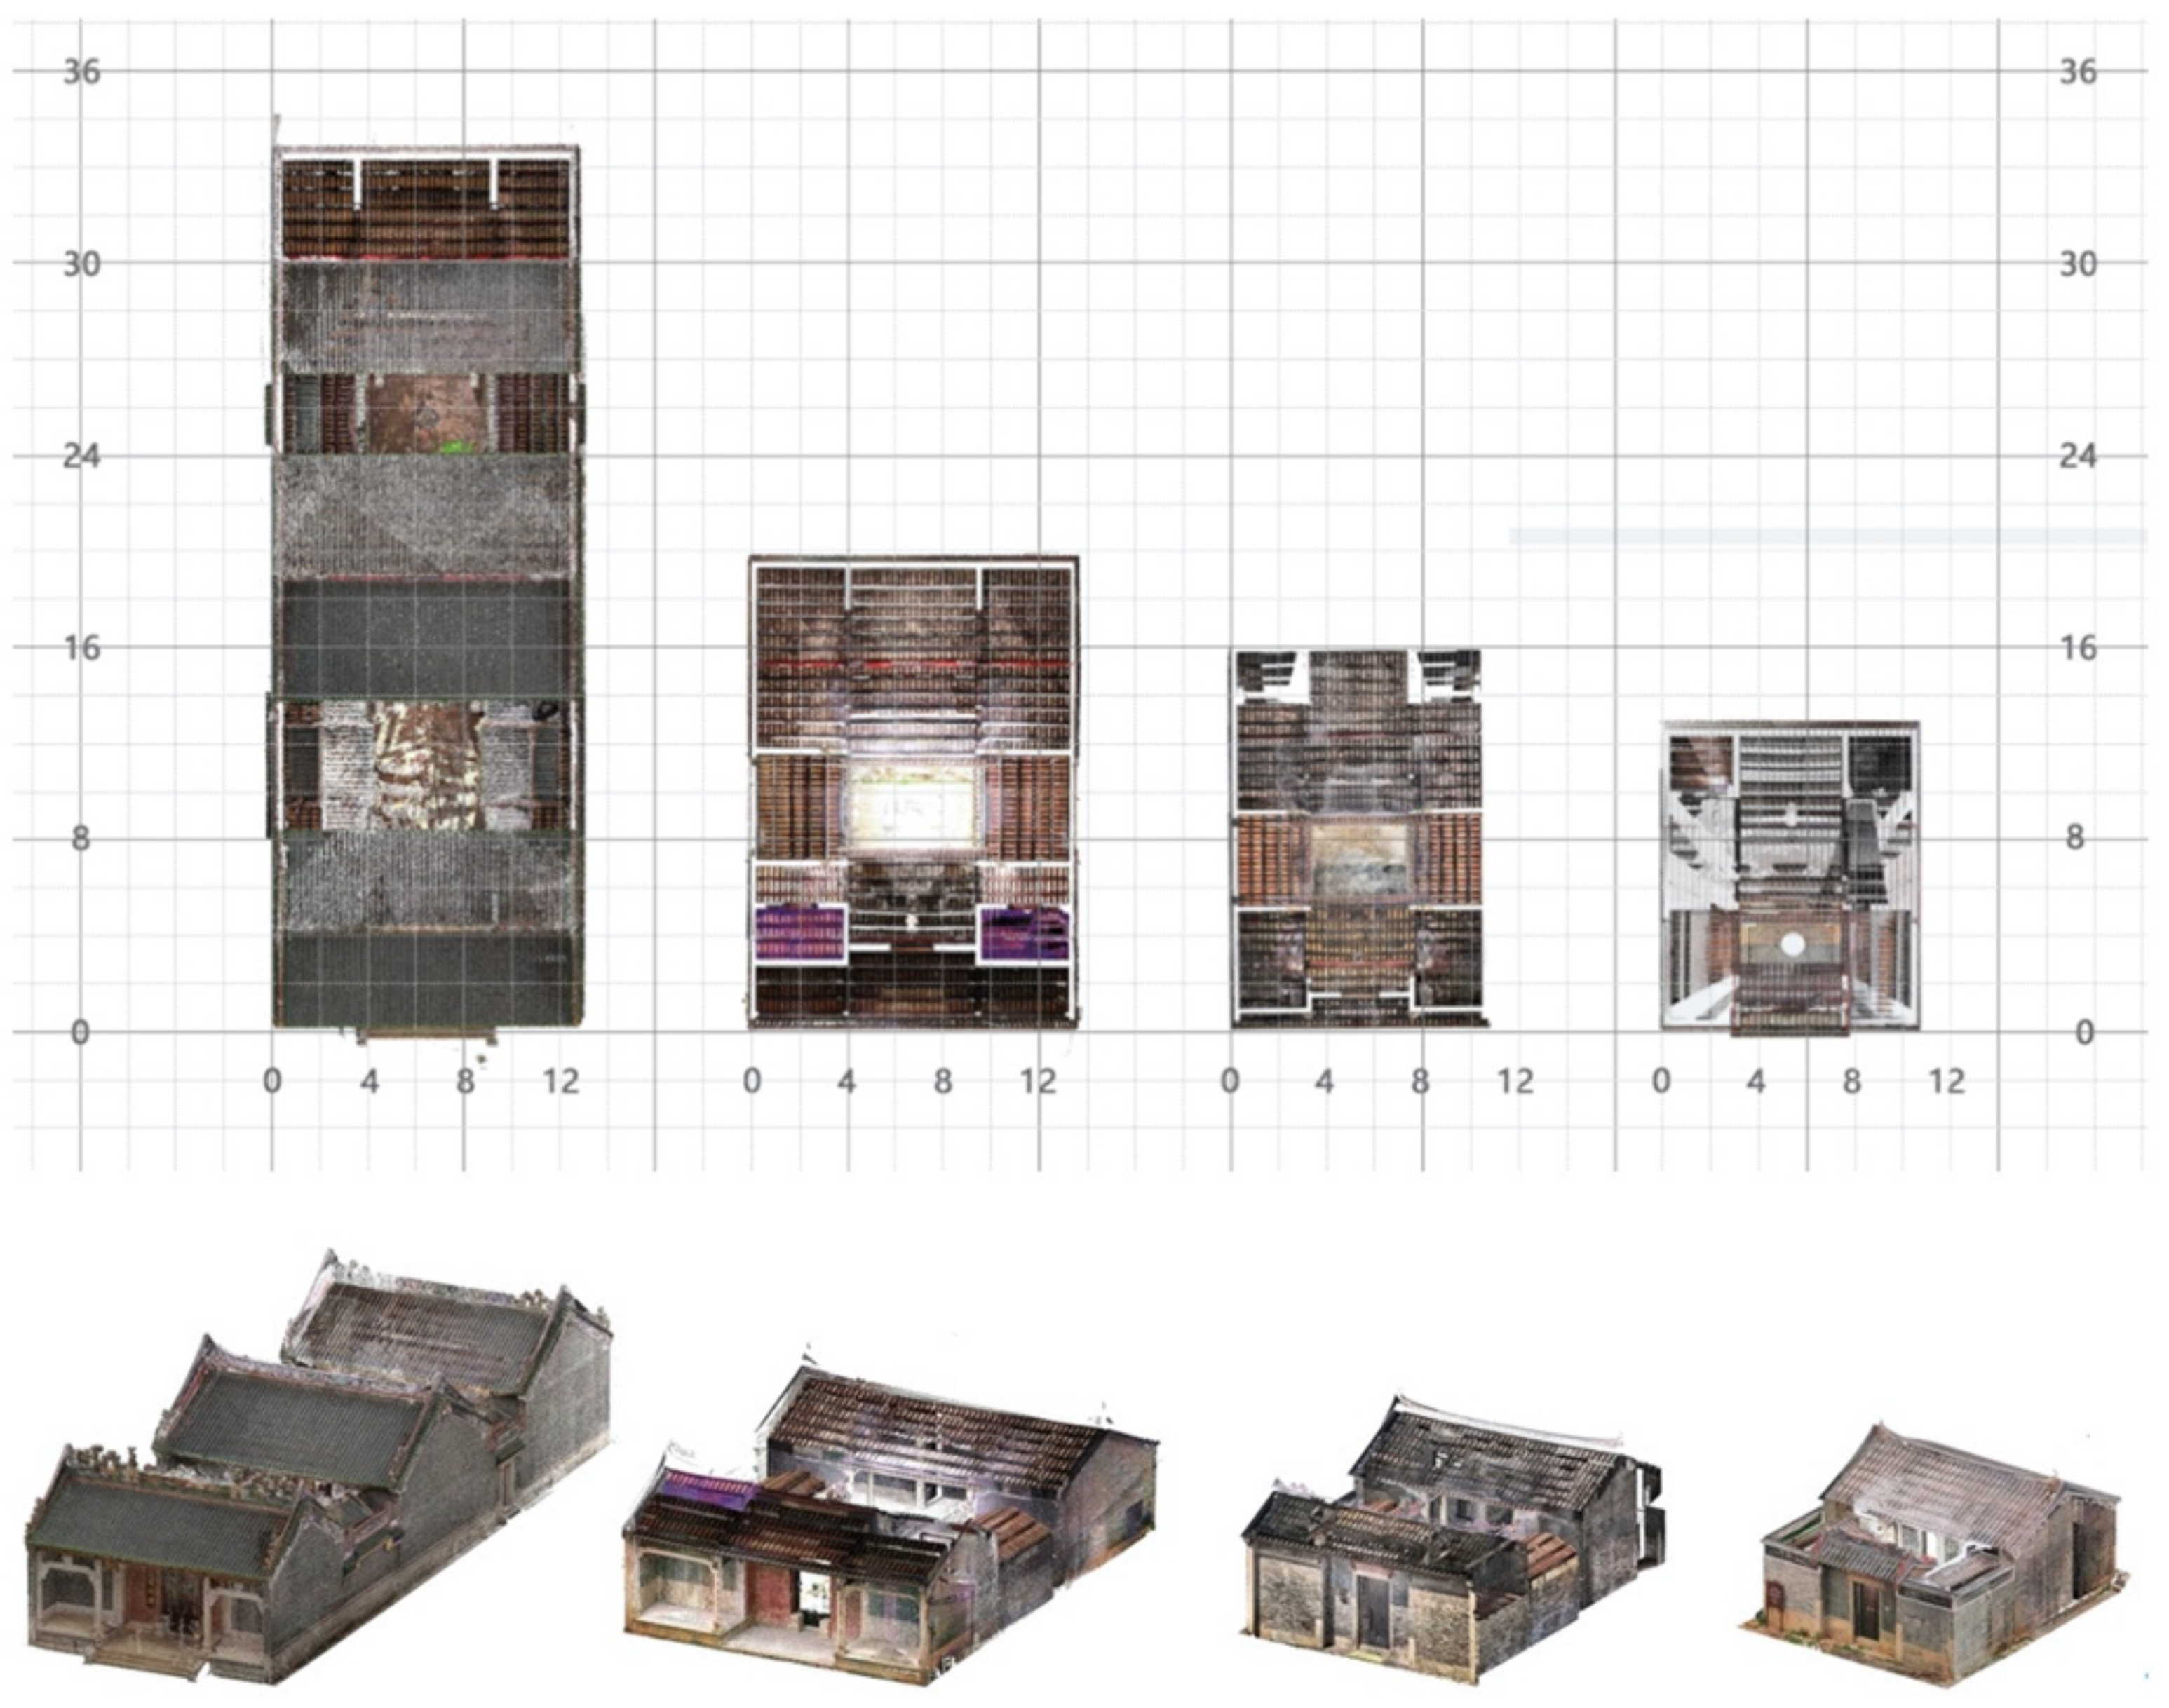
As seen in Figure 7, it can be found that the width of the four ancestral halls is more than 10 m. Songzhuang Ancestral Hall is more spacious, with a width of 13.8 m, and its frontal courtyard is equipped with a private courtyard. The length of Songzhuang Ancestral Hall is 16.9 m. In comparison, the length of Wen Family Ancestral Hall is 33 m. The layouts of Yichen Ancestral Hall and Sisheng Ancestral Hall are relatively compact, with smaller sizes. Functionally speaking, the ancestral halls are generally composed of a first hall, a medium hall, and a memorial hall. Take Wen Family Ancestral Hall as an example, which is a typical compound house consisting of halls, rooms, corridors, and courtyards. The medium hall is located in the center, dedicated to holding ceremonies and meetings. The memorial hall is located in the furthest part of the yard, dedicated to worshipping ancestors (Figure 8).
The point cloud model can also be used to analyze the decoration elements of the buildings for a detailed recording of the whole building. Roof decorations are characteristic of this village. The roof ridges of the ancestral halls are diversified. Most of them use decorative techniques, such as gray sculptures and colored paintings. Three types of roof ridges were observed in this village: boat ridge, antique ridge, and pottery ridge. The boat ridges are more common in history, the antique ridge is regarded as a symbol of wealth, while the pottery ridge was a new decoration that emerged in the 1900s (Figure 9). Thus, from the building decorations, the different classes of the traditional buildings can be observed.
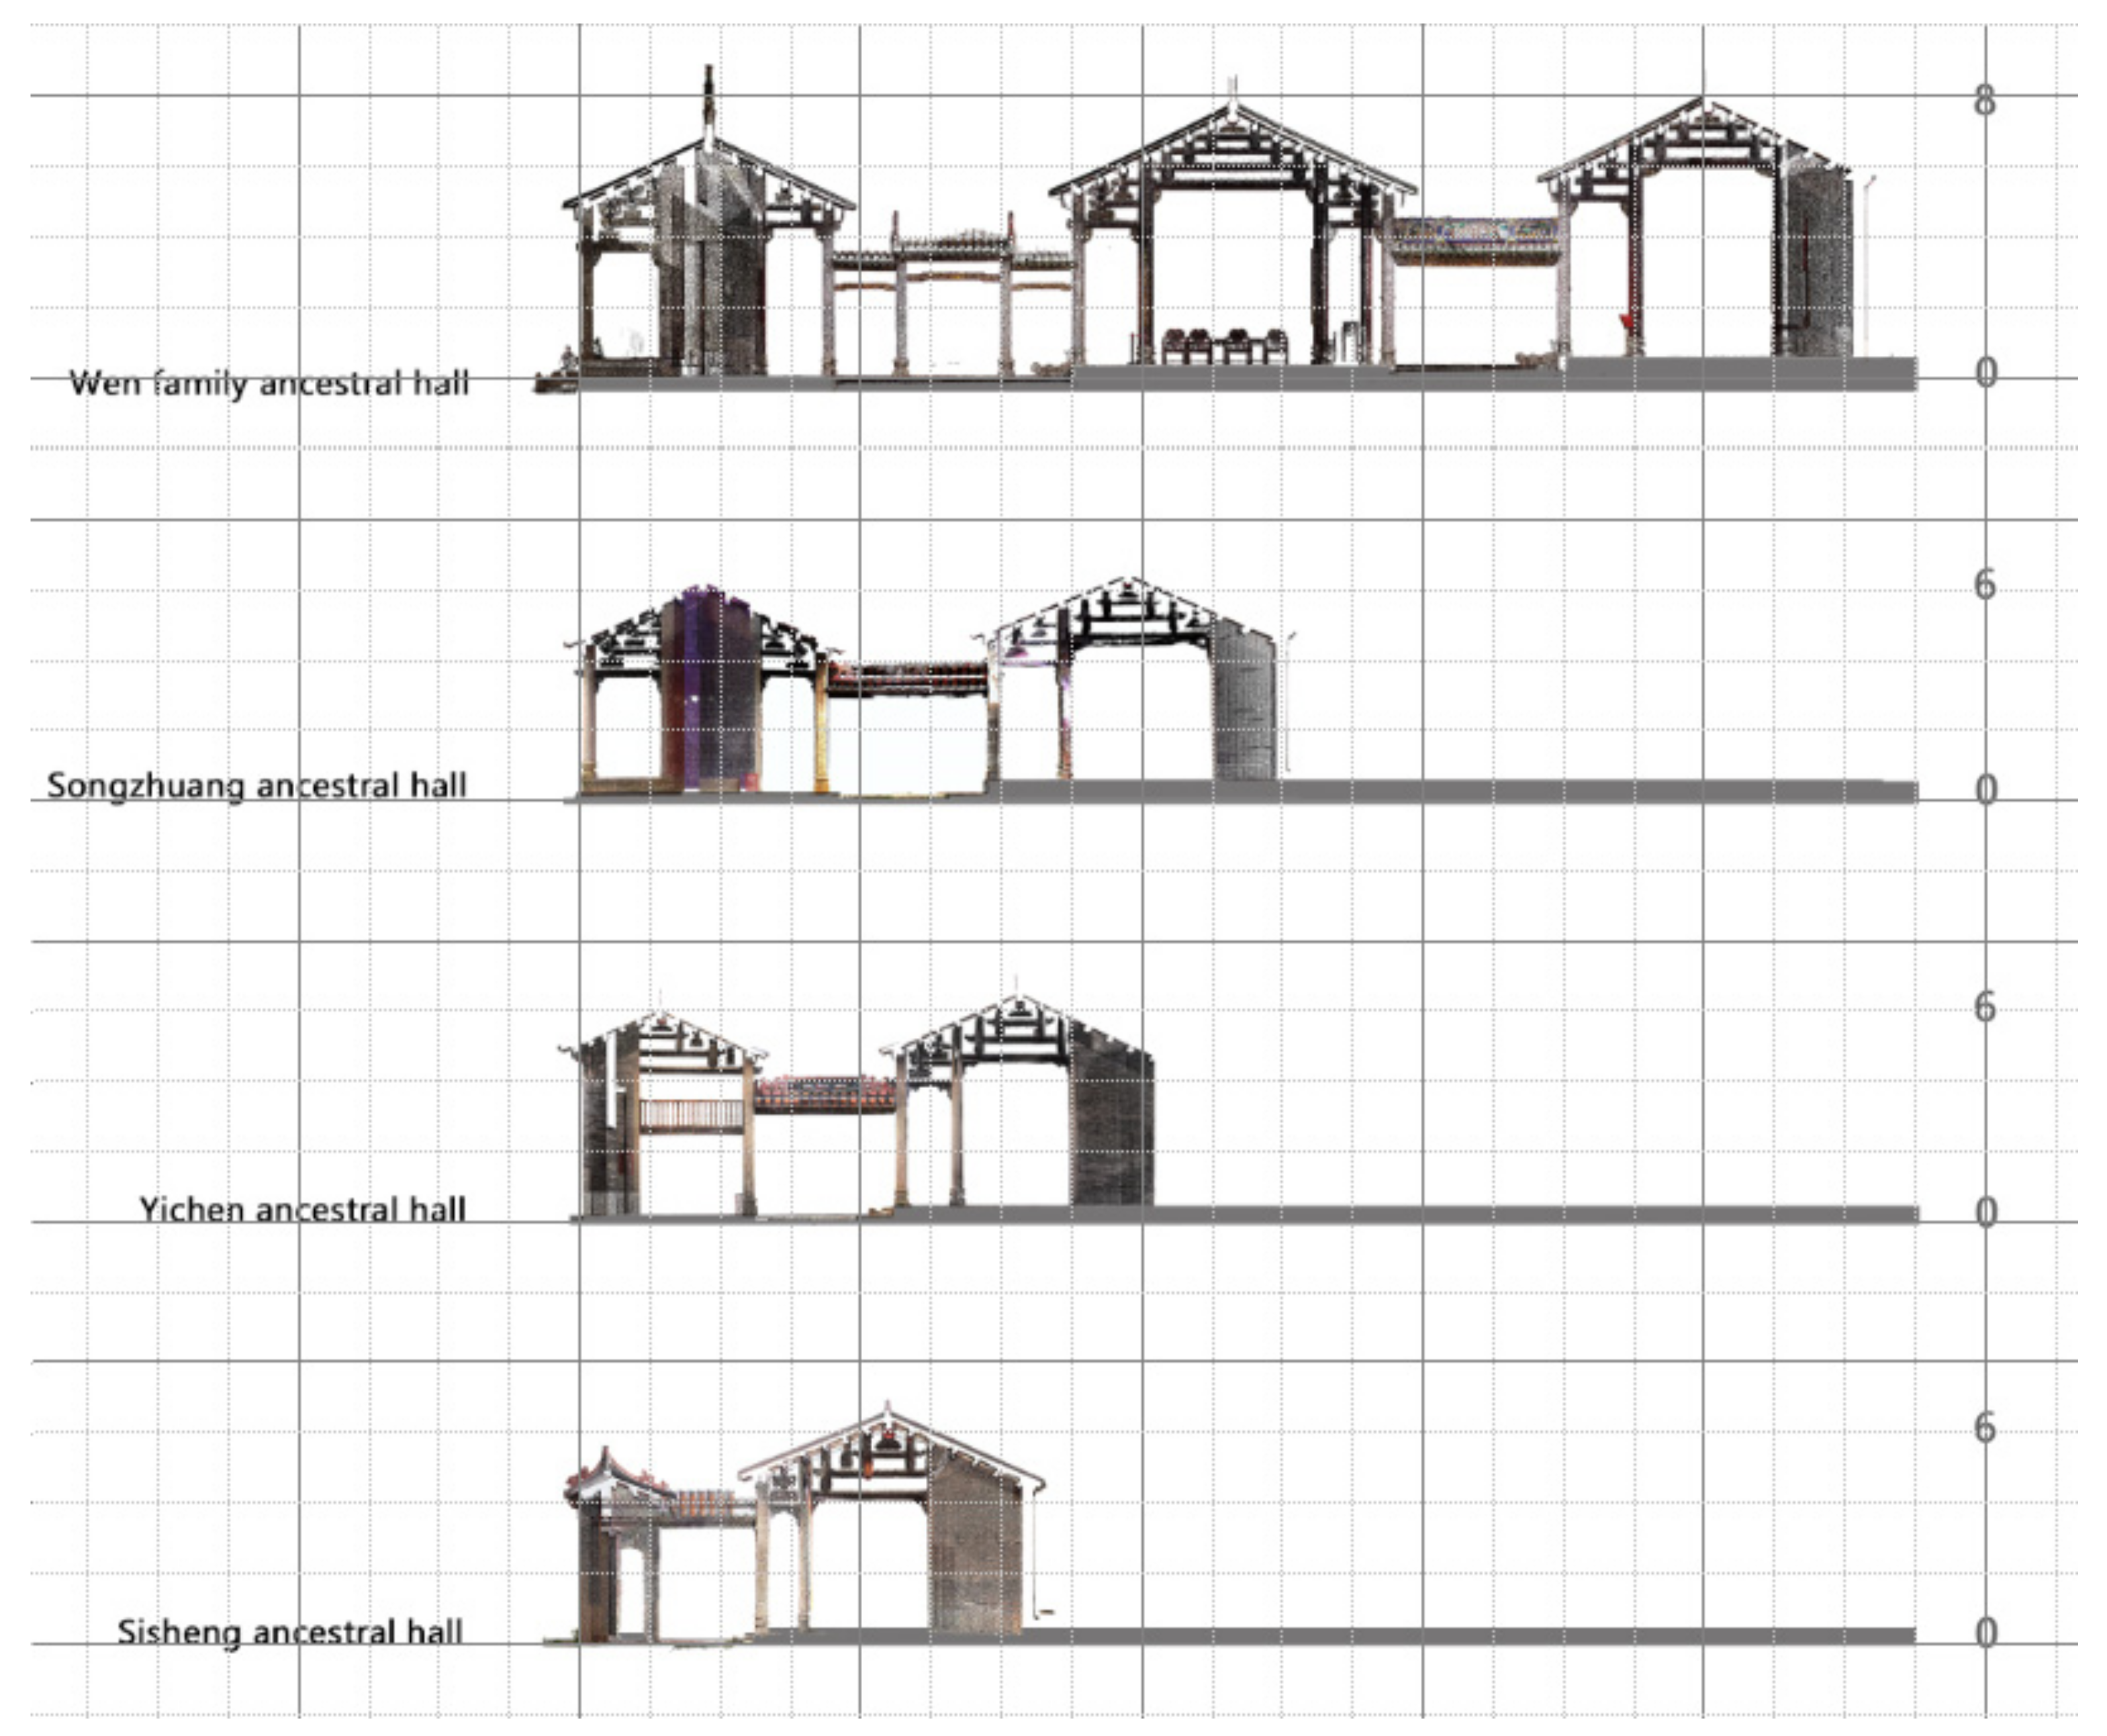
From the section view of the historical buildings, the height of every individual building can be compared, as well as the relationship between the building heights and the length of the building space. From 
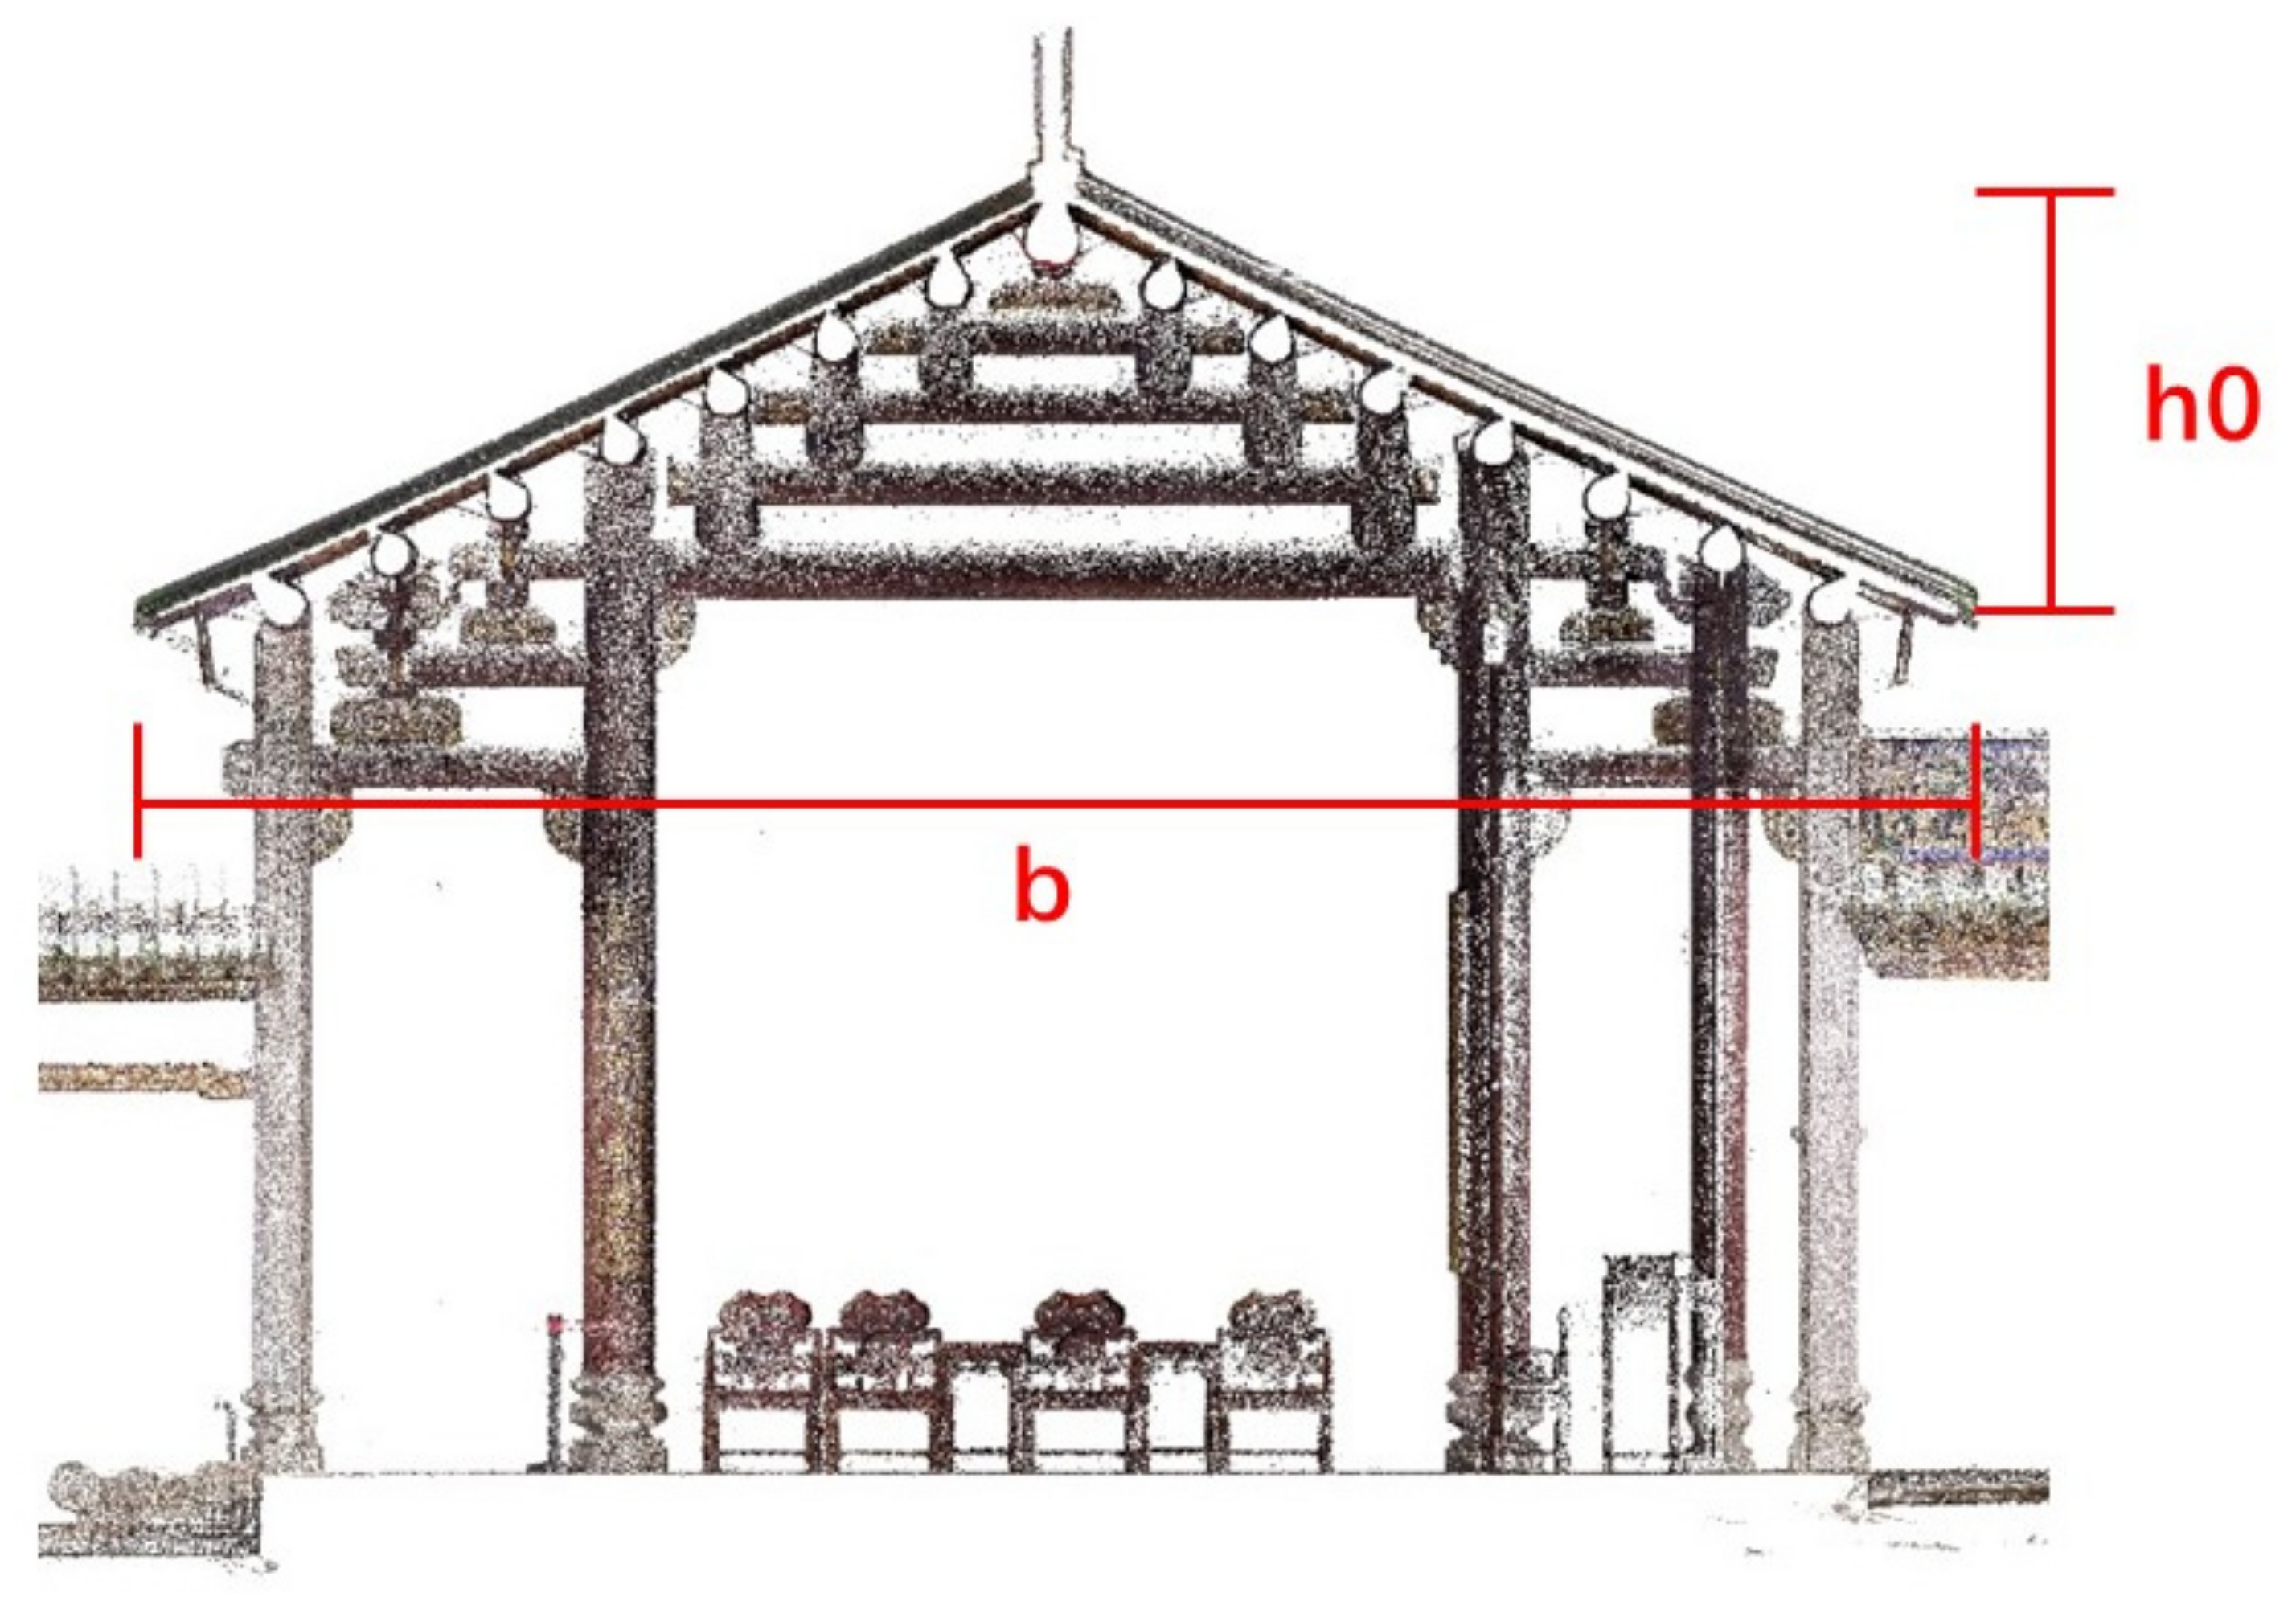
Figure 10, it can be seen that the architectural spatial sequence of these ancestral halls shows a rising trend, and the foundations of the four ancestral buildings are getting higher and higher from the frontal space to the end, which is in accordance with the psychological effect of creating a space for worshipping ancestors. According to calculations, the lengths of Wen Family Ancestral Hall, Songzhuang Ancestral Hall, Yichen Ancestral Hall, and Sisheng Ancestral Hall are as follows: 36 m, 19.5 m, 16.9 m, and 13.6 m. The ratios between the length and height are 4.39, 2.72, 3, and 2.09. Additionally, for each ancestral hall, the roof slope can be calculated by measuring the center distance of its front and back eaves (b) and the height of the internal beam (h0) (Figure 11). The b/h0 ratio is obtained from the point cloud model. As a result, for the four memorial halls that belonged to the four families, the ratio values are 1/2.7, 1/3.1, 1/2.3, 1/1.4 (Wen Family, Songzhuang, Yichen, and Sisheng). The ratio values of the four frontal halls are, respectively, 1/3.0, 1/3.2, 1/2.4, and 1/3.1.
In conclusion, the spatial sequence of the ancestral halls presents an upward trend. The ground of the rear courtyard is usually higher than the frontal courtyard. In an ancestral hall building, the height of the memorial halls is usually higher than the frontal halls, showing a dominant position. The ancestral halls always have small scales and compact layouts. However, the hall buildings built later usually become larger in scale. The center distance between the front and rear eaves of the back hall is generally smaller than that of the frontal halls. Thus, the roof slope of memorial halls is generally smaller than the frontal roofs, and the back roofs are gentler than the frontal roofs.

3.2. BIM Creation and Analysis

After processing the point clouds, it is possible to integrate them into the BIM environment for further research and analysis. Take Sisheng Hall as an example. The BIM model is constructed and analyzed as follows. According to a previous site survey, the components of the architectural structure of this hall can be classified into roof, beam frame, wall, column, floor, decoration, door, and window. Based on this classification, a BIM family is created; namely, every part of the building’s point cloud is separately imported into BIM, combined as a database of architectural components, stored, and applied as BIM family files.
After modeling the building components, in the BIM application process, it is necessary to directly load the family library into the project. Then, the BIM family library can be evaluated by observing the form of the built family to check whether the naming of the family library conforms to the unified rules, whether the code is unique, and whether the connected points of the family model are appropriate. It is also necessary to check if the linkage between the parameters is effective or not. After checking and observing, it is clear that the 3D model of Sisheng Ancestral Hall follows the rules above. Thus, the model is officially uploaded into the BIM platform (Figure 12).
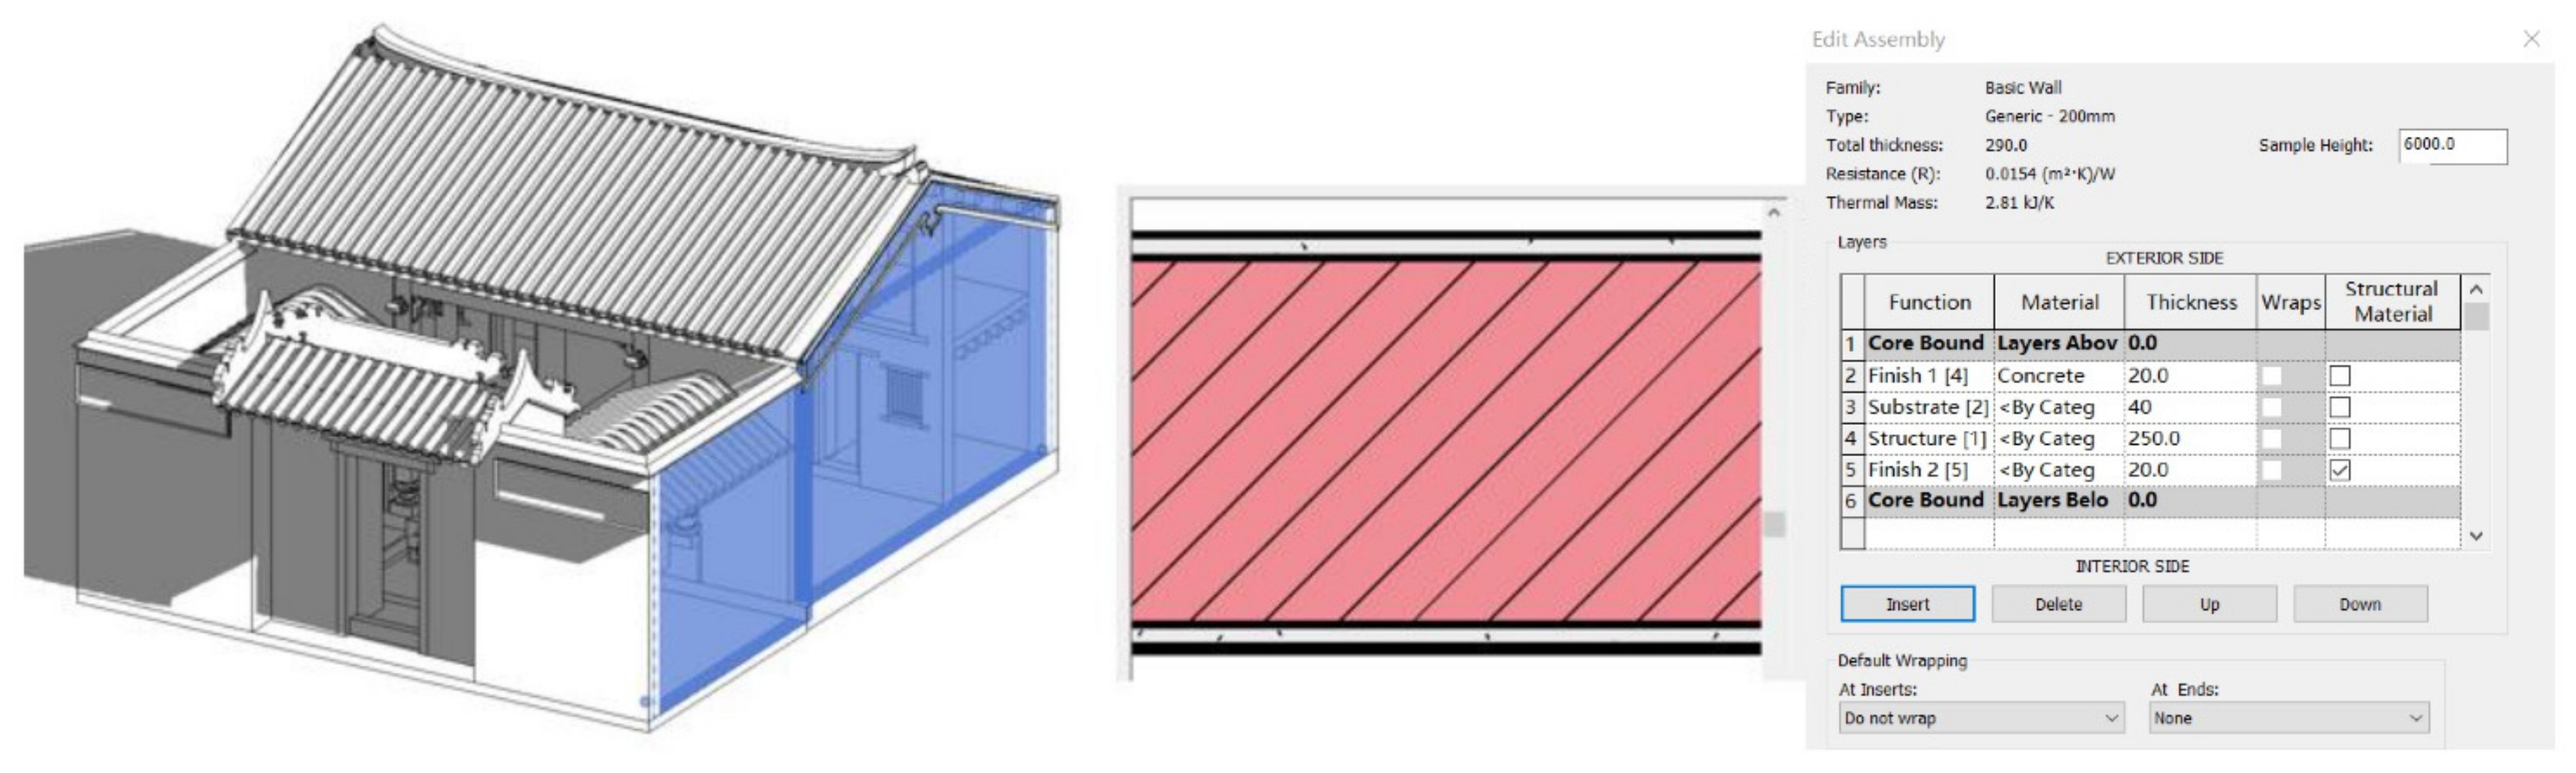
Statistical functions can be fulfilled in these constructed models. Taking the model of Sisheng Hall as an example, a wall model integrates the structural level, thickness, and material, and other information obtained can be expressed both three-dimensionally and in the form of tables (Figure 13). The Revit software of BIM also provides statistical functions. The building information can be quickly extracted and viewed in tables, which will greatly facilitate the process of restoration or heritage redevelopment.
With the constructed models, further heritage management and analysis can be performed with ease. For example, the inner heritage conditions, such as sunlight and ventilation, can be evaluated using Recap software simulations. Furthermore, the construction materials, style, and texture of the site may be assessed using color analysis of the model. As a technology that answers the rising requirement for the multidisciplinary knowledge base required for the management of life cycle operations of the growing inventory of cultural sites. BIM, combined with TLS, has played an important part in this trend. It is feasible to test, evaluate, and enhance a building design repeatedly using BIM with TLS. Building performance analysis is the name of this method (BPA). These models can contain both the geometric information and semantic properties of the building. As a result, design options may be used to estimate life cycle energy costs, yearly consumption, and potential energy savings for not only the project of Fenghuang village but also other heritage sites. More research focusing on this direction will be discussed in our future studies.

4. Conclusions and Discussion

The 19 historical buildings in Fenghuang village are regarded as research subjects in this paper, and TLS is the main methodology. The survey method focuses on using TLS to acquire comprehensive architectural data of the diverse elements of historical buildings in Fenghuang, including five steps: designing the scanning scheme, obtaining site data, processing the point clouds, and comparing the historical buildings. The internal and external parts of the buildings are both recorded by TLS, and the roof parts are scanned. After registration and denoising of point clouds, the point cloud models are built, which is an important process to update the documentation of historical buildings in Fenghuang village. Therefore, this project is meaningful for the future planning and protection of Fenghuang village. Significantly, it can also be a reference for other traditional villages with complex structures, decorations, and spatial compositions, as well as for analyzing the relationship between the buildings in traditional villages.
Compared with other scanning methods or other traditional heritage survey methods (such as total station), the workflow proposed in this paper has its advantages when applied to other cases. TLS for traditional village studies has seldom been discussed; however, as explained above, all the characteristics of TLS (simple, faster, efficient operation, less physical damage to heritage objects) can be reflected in this case study. Different from single building modeling, coordination between different objects in the villages is considered in this project, as well as the method of scanning the roof parts of some high buildings. Additionally, due to the similarity of Chinese historical buildings, the BIM library built in this paper can be a good source to share with other scholars to improve the communication of heritage modeling in Chinese academia, as well as similar cases in other countries.
However, improving the efficiency of modeling with a standardized modular method remains a challenge, especially for some large-scale heritages. Currently, more research is focusing on the standardized method for the creation of BIM objects, furthering the discussion of defining BIM libraries, ensuring the coherence and completeness of heritage data and documentation [32]. Thus, the verification of coherence, information completeness, and the interoperability of village modeling remains a problem awaiting solution in further studies, as well as the case of Fenghuang village.
In future research, the following aspects can be highlighted to improve the application process of TLS and point clouds in traditional villages. (1) All 360 historical buildings are awaiting identification and further research. Thus, it is urgent to cooperate more with local scholars and institutions to carry out the survey and modeling plan for the whole village to strengthen multiprofessional cooperation with computer sciences. (2) Based on the point clouds, BIM smart models can be constructed to improve component-based 3D visualization. The BIM model will provide more accurate and detailed information for the protection of ancient buildings. More quantitative analysis can be performed with the BIM model, such as solar and wind simulation [33]. (3) Introduce the GIS technology to realize the application of TLS in a wider context. For example, the spatial arrangement of building clusters can be analyzed by GIS tools, and future tourism and heritage planning can be proposed with the help of GIS analysis [34]. (4) More digital technologies such as 3D printing, big data collection, and AR/VR can be combined with point clouds to enhance the immersive tourism experience in traditional villages [35].

Author Contributions

Conceptualization, Guiye Lin and Xiaochun Yang; methodology, Guiye Lin and Andrea Giordano; software, Guiye Lin and Luigi Stendardo; validation, Luigi Stendardo; investigation, Guiye Lin and Xiaochun Yang; resources, Andrea Giordano; writing—original draft preparation, Guiye Lin and Kun Sang; writing—review and editing, Guiye Lin and Kun Sang; visualization, Guiye Lin; supervision, Xiaochun Yang. All authors have read and agreed to the published version of the manuscript.

Funding

This research was funded by the National Natural Science Foundation of China, Grant Number: 51478268 and the China Scholarship Council, Grant Number: 201708440230.

Institutional Review Board Statement

The study did not require ethical approval.

Informed Consent Statement

Informed consent was obtained from all subjects involved in the study.

Data Availability Statement

Data supporting the findings of this study are available from the author, G. Lin, upon reasonable request.

Conflicts of Interest

The authors declare no conflict of interest.

References

  1. Zhou, R.; Zhong, L.; Liu, J. Research on rural world heritage sites: Connotation and tourism utilization. Geogr. Res. 2015, 34, 991–1000. [Google Scholar]
  2. Lekakis, S.; Dragouni, M. Heritage in the making: Rural heritage and its mnemeiosis at Naxos island, Greece. J. Rural Stud. 2020, 77, 84–92. [Google Scholar] [CrossRef]
  3. Gullino, P.; Larcher, F. Integrity in UNESCO world heritage sites: A comparative study for rural landscapes. J. Cult. Herit. 2013, 14, 389–395. [Google Scholar] [CrossRef]
  4. Weng, S.; Peng, H. Tourism development, rights consciousness, and the empowerment of Chinese historical village communities. Tour. Geogr. 2014, 16, 772–784. [Google Scholar] [CrossRef]
  5. Yan, H.; Bun, K.H.; Xu, S. Rural revitalization, scholars, and the dynamics of the collective future in China. J. Peasant Stud. 2020, 48, 853–874. [Google Scholar] [CrossRef]
  6. Olğun, T.U.; Karatosun, M.B. Rural architectural heritage conservation and sustainability in Turkey: The case of Karaca village of Malatya region. Int. J. Des. Nat. Ecodyn. 2019, 14, 195–205. [Google Scholar] [CrossRef] [Green Version]
  7. Gao, J.; Wu, B. Revitalizing traditional villages through rural tourism: A case study of Yuanjia Village, Shaanxi Province, China. Tour. Manag. 2017, 63, 223–233. [Google Scholar] [CrossRef]
  8. Costantino, D.; Angelini, M.G.; Claveri, M.; Alfio, V.S. GIS and DBMS implementation for the development of rural areas of the “one hundred masserie” of Crispiano. Geog. Tech. 2016, 11, 23–32. [Google Scholar] [CrossRef] [Green Version]
  9. Statuto, D.; Cillis, G.; Picuno, P. GIS-based analysis of temporal evolution of rural landscape: A case study in Southern Italy. Nat. Resour. Res. 2019, 28, 61–75. [Google Scholar] [CrossRef]
  10. Cano, M.; Garzon, E.; Sanchez-Soto, P.J. Historic preservation, GIS, & rural development: The case of Almería province, Spain. Appl. Geogr. 2013, 42, 34–47. [Google Scholar]
  11. Agapiou, A.; Lysandrou, V.; Alexakis, D.D.; Themistocleous, K.; Cuca, B.; Argyriou, A.; Hadjimitsis, D.G. Cultural heritage management and monitoring using remote sensing data and GIS: The case study of Paphos area, Cyprus. Comput. Environ. Urban Sys. 2015, 54, 230–239. [Google Scholar] [CrossRef]
  12. Wang, N.; Chen, L. Sustainable Development of Rural Tourism in Guangdong Based on Remote Sensing and GIS. IOP Conf. Ser. Mater. Sci. Eng. 2020, 750, 012146. [Google Scholar] [CrossRef]
  13. Calders, K.; Adams, J.; Armston, J.; Bartholomeus, H.; Bauwens, S.; Chave, L.P.B.J.; Danson, F.M.; Demol, M.; Disney, M.; Gaulton, R.; et al. Terrestrial laser scanning in forest ecology: Expanding the horizon. Remote Sens. Environ. 2020, 251, 112102. [Google Scholar] [CrossRef]
  14. Guarnieri, A.; Remondino, F.; Vettore, A. Digital photogrammetry and TLS data fusion applied to Cultural Heritage 3D modeling. Int. Arch. Photogramm. Remote Sens. Spat. Inf. Sci. 2006, 36, 1–6. [Google Scholar]
  15. Yuriy, R. Terrestrial Laser Scanning, Error Source, Self-Calibration, and Direct Geo Referencing; VDM Verlag Dr. Muller: Saarbrucken, Germany, 2009. [Google Scholar]
  16. Chatzistamatis, S.; Kalaitzis, P.; Chaidas, K.; Chatzitheodorou, C.; Papadopoulou, E.E.; Tataris, G.; Soulakellis, N. Fusion of TLS and UAV photogrammetry data for post-earthquake 3D modeling of a cultural heritage Church. ISPRS Arch. 2018, 143–150. [Google Scholar] [CrossRef] [Green Version]
  17. Grenzdörffer, G.J.; Niemeyer, F.; Frank, A. Symbiosis of UAS photogrammetry and TLS for surveying and 3D modeling of cultural heritage monuments-a case study about the cathedral of St. Nicholas in the city of Greifswald. Int. Arch. Photogramm. Remote Sens. Spat. Inf. Sci. 2015, 40, 91. [Google Scholar] [CrossRef] [Green Version]
  18. Markiewicz, J.S.; Podlasiak, P.; Zawieska, D. A new approach to the generation of orthoimages of cultural heritage objects—integrating TLS and image data. Remote Sens. 2015, 7, 16963–16985. [Google Scholar] [CrossRef] [Green Version]
  19. Fryskowska, A.; Walczykowski, P.; Delis, P.; Wojtkowska, M. ALS and TLS data fusion in cultural heritage documentation and modeling. Int. Arch. Photogramm. Remote Sens. Spat. Inf. Sci. 2015, 40, 147. [Google Scholar] [CrossRef] [Green Version]
  20. Grussenmeyer, P.; Landes, T.; Voegtle, T.; Ringle, K. Comparison Methods of Terrestrial Laser Scanning, Photogrammetry and Tacheometry Data for Recording of Cultural of Cultural Heritage Buildings’. Int. Arch. Photogramm. Remote Sens. Spat. Inf. Sci. 2008, XXXVII, 213–218. [Google Scholar]
  21. Altuntas, C.; Yildiz, F. Registration of Terrestrial Laser Scanner Point Clouds by One Image. Int. Arch. Photogramm. Remote Sens. Spat. Inf. Sci. 2008, XXXVII, 597–600. [Google Scholar]
  22. Karabork, H.; Yildiz, F.; Yakar, M.; Altuntas, C.; Karasaka, L. Modeling and Visualization using Laser Scanner in Documentation of Cultural Heritage. In Proceedings of the XXI International CIPA Symposium, Athens, Greece, 1–6 October 2007; Volume XXXVI. [Google Scholar]
  23. Rotgé, J.F.; Farret, J. 3D Solid Representation and Visualization for Large Heterogeneous Sites with Urban and Rural Heritage—A Case Study. Int. Soc. Photogramm. Remote Sens. Work. 2007, XXXVI, 1–8. [Google Scholar]
  24. Grilli, E.; Özdemir, E.; Remondino, F. Application Of Machine and Deep Learning Strategies for The Classification Of Heritage Point Clouds. Inter. Arch. of the Photo. Rem. Sens. Spa. Infor. Sci 2019, XLII-4/W18, 447–454. [Google Scholar] [CrossRef] [Green Version]
  25. Vo, A.V.; Truong-Hong, L.; Laefer, D.F.; Bertolotto, M. Octree-based region growing for point cloud segmentation. J. Photogramm. Remote Sens. 2015, 104, 88–100. [Google Scholar] [CrossRef]
  26. Pan, Y.; Dong, Y.; Wang, D.; Chen, A.; Ye, Z. Three-dimensional reconstruction of structural surface model of heritage bridges using UAV-based photogrammetric point clouds. Remote Sens. 2019, 11, 1204. [Google Scholar] [CrossRef] [Green Version]
  27. Chiabrando, F.; Lo Turco, M.; Rinaudo, F. Modeling the decay in an HBIM starting from 3D point clouds. A followed approach for cultural heritage knowledge. Inter. Arch. Photogramm. Remote Sens. Spat. Inf. Sci. 2017, XLII2, 42. [Google Scholar] [CrossRef] [Green Version]
  28. Fröhlich, C.; Mettenleiter, M. Terrestrial Laser Scanning—New Perspectives in 3D Surveying. Proc. Int. Arch. Photogramm. Remote Sens. Spat. Inf. Sci. 2004, XXXVI, 1–7. [Google Scholar]
  29. Hendriatiningsih, S.; Suwardhi, D. 3D Model Based on Terrestrial Laser Scanning (TLS) Case study: The Cangkuang Temple, Garut District, West Java, Indonesia. J. Eng. Technol. Sci. 2015, 47, 1–19. [Google Scholar] [CrossRef] [Green Version]
  30. Otepka, J.; Ghuffar, S.; Waldhauser, C.; Hochreiter, R.; Pfeifer, N. Georeferenced point clouds: A survey of features and point cloud management. ISPRS Int. J. Geo-Inf. 2013, 2, 1038–1065. [Google Scholar] [CrossRef] [Green Version]
  31. Thomson, C.; Boehm, J. Automatic geometry generation from point clouds for BIM. Remote Sens. 2015, 7, 11753–11775. [Google Scholar] [CrossRef] [Green Version]
  32. Daniotti, B.; Pavan, A.; Spagnolo, S.L.; Caffi, V.; Pasini, D.; Mirarchi, C. Standardized guidelines for the creation of BIM objects. In BIM-Based Collaborative Building Process Management; Springer: Cham, Switzerland, 2020; pp. 39–70. [Google Scholar]
  33. Oreni, D.; Brumana, R.; Della Torre, S.; Banfi, F.; Previtali, M. Survey turned into HBIM: The restoration and the work involved concerning the Basilica di Collemaggio after the earthquake (L’Aquila)’. ISPRS Ann. Photogramm. Remote Sens. Spat. Inf. Sci. 2014, 2, 267. [Google Scholar] [CrossRef] [Green Version]
  34. Liang, H.; Li, W.; Lai, Q.; Zhu, L.; Jiang, W.; Zhang, Q. The integration of terrestrial laser scanning and terrestrial and unmanned aerial vehicle digital photogrammetry for the documentation of Chinese classical gardens–A case study of Huanxiu Shanzhuang, Suzhou, China. J. Cult. Heri. 2018, 33, 222–230. [Google Scholar] [CrossRef]
  35. Achlioptas, P.; Diamanti, O.; Mitliagkas, I.; Guibas, L. Learning representations and generative models for 3D point clouds. Proc. Mach. Lear. Res. 2018, 80, 40–49. [Google Scholar]
Figure 1. Location of Fenghuang village. The distribution of different kinds of buildings inside of the village is shown by the map, including school buildings, Guangfu residences, ancestral halls, and other buildings.
Ijgi 10 00770 g001
Figure 2. Research process. Four main steps included in this research, including designing the scanning schema, data collection, point clouds processing, and model applications.
Ijgi 10 00770 g002
Figure 3. Faro S350 scanner. The Faro scanner is suitable for different kinds of sites, especially for architectural heritage scanning.
Ijgi 10 00770 g003
Figure 4. Outdoor scanning arrangement of the Gushan school. In all, there are 36 scanning stations arranged for the outdoor scanning of the Gushan school.
Ijgi 10 00770 g004
Figure 5. An example of indoor scanning. There are 22 scanning stations arranged for the indoor scanning of the Gushan school.
Ijgi 10 00770 g005
Figure 6. Point clouds model of the Gushan school. The figure is composed of an isometric view and a side view of the Gushan school.
Ijgi 10 00770 g006
Figure 7. Comparison of ancestral halls (layout). The four ancestral halls are compared in this figure, from left to right, they are Wen Family Ancestral Hall, Songzhuang Ancestral Hall, Yichen Ancestral Hall, and Sisheng Ancestral Hall.
Ijgi 10 00770 g007
Figure 8. Layout and side view of Wen Ancestral Hall. A top view and a side view the Wen Ancestral Hall are drawn in this figure.
Ijgi 10 00770 g008
Figure 9. Roof of ancestral halls. The three types of roofs include: (a) boat ridge; (b) antique ridge; (c) pottery ridge.
Ijgi 10 00770 g009
Figure 10. Comparison of four ancestral halls by height. From top to bottom, these four buildings are Wen Family Ancestral Hall, Songzhuang Ancestral Hall, Yichen Ancestral Hall, and Sisheng Ancestral Hall.
Ijgi 10 00770 g010
Figure 11. Method of measurement. b: distance between the front and rear eaves; h0: height of internal beam.
Ijgi 10 00770 g011
Figure 12. Bird’s-eye view (left), section view (upper right), and section view (lower right) of Sisheng Hall.
Ijgi 10 00770 g012
Figure 13. Digital expression of the wall of Sisheng Hall and the function of statistics.
Ijgi 10 00770 g013
Publisher’s Note: MDPI stays neutral with regard to jurisdictional claims in published maps and institutional affiliations.

