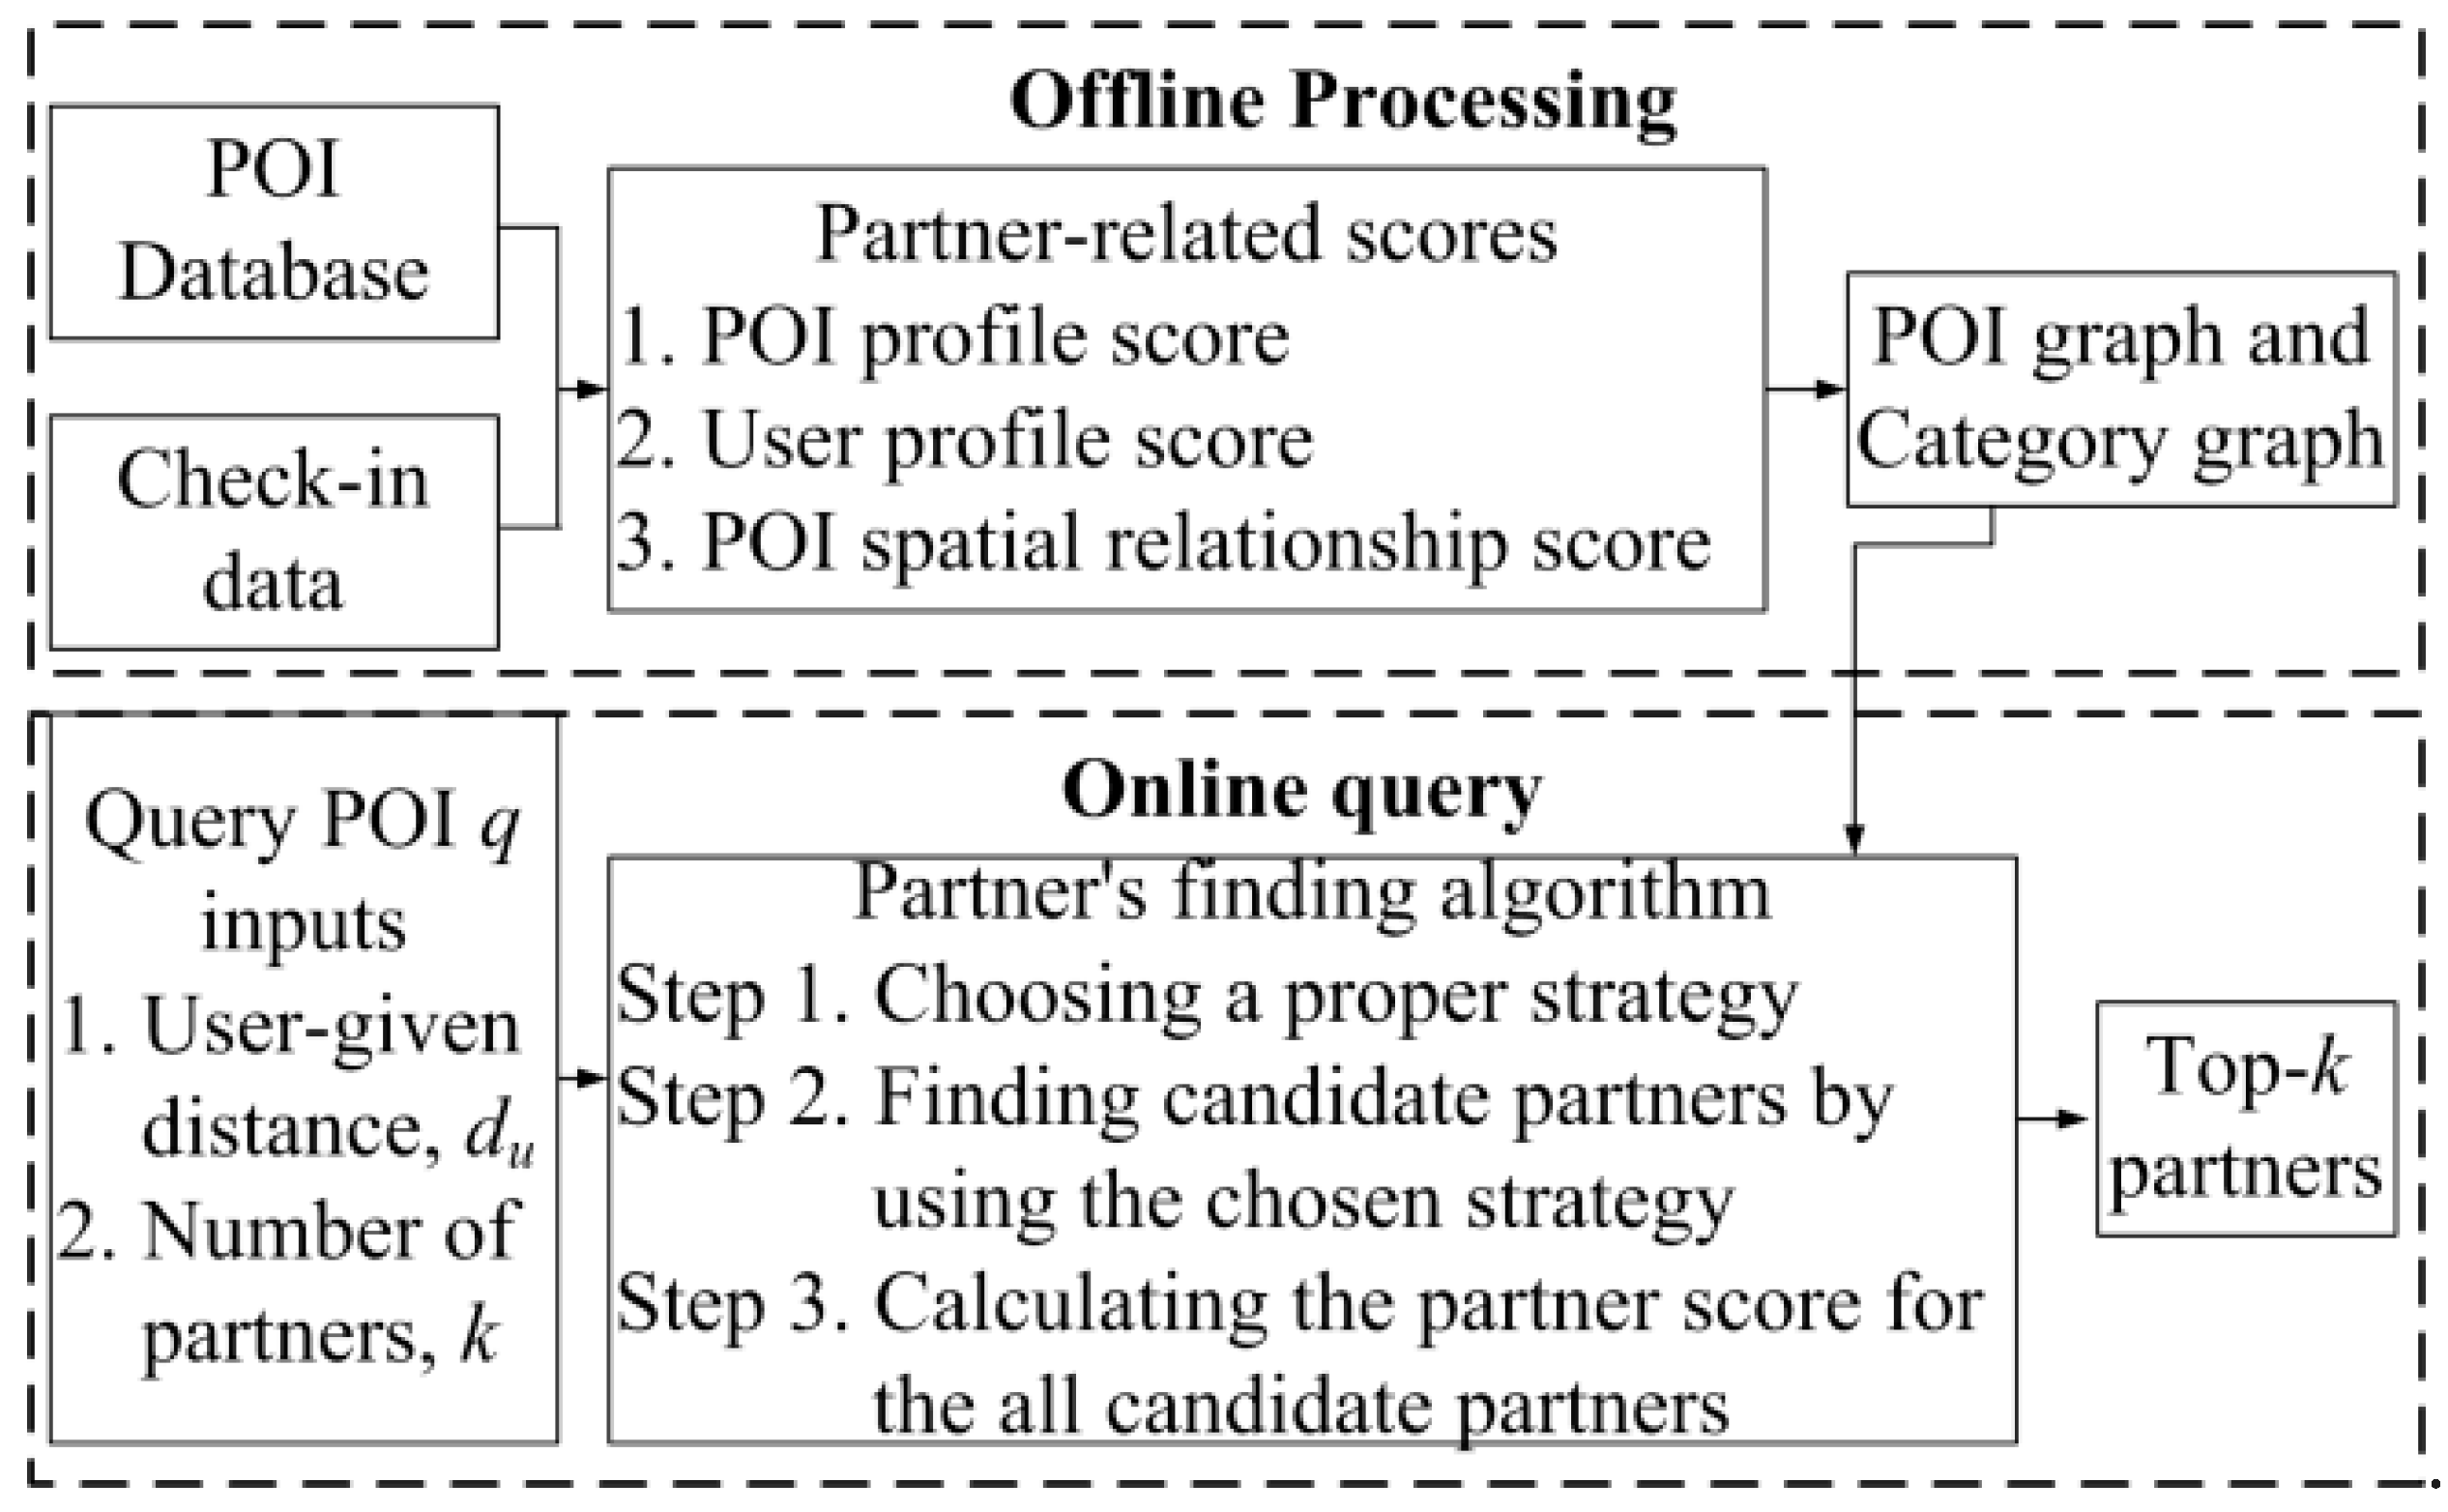
The online query stage of JPPRS has three processes: (1) selection of the most appropriate promotion strategy for query POI q, (2) finding candidate partners using the chosen strategy, and (3) calculation of the partner score for the candidate partners using the speed-up algorithm.
4.3.1. Promotion Strategy Selection
Joint promotion is a frequently discussed topic that has many commercial applications [
1,
83]. One of the most well-known joint promotion theories is Lanchester’s law [
84,
85,
86], which is a wide-ranging concept that covers mathematical analysis, modeling, and theoretical deduction. This study used only the shooting range theory [
87] of Lanchester’s law to select an appropriate strategy for query POI
q. By strategy we mean the methods of setting and achieving targets, and allocating required information. In the sections below, we explain how to use the shooting range theory of Lanchester’s law to formulate strategies. This theory includes the following two theorems.
Theorem 1. Only two businesses of the same type within the same area are referred to as A and B. If the market share of A is three times or more that of B, then B cannot compete for the customers of A. Conversely, A and B would be able to compete for each other’s clientele.
Theorem 2. If there are three or more businesses of the same type in the same area, as long as the market share of A is at least 1.7 times that of any of the others, the so-called B, then B cannot compete for A’s customers. If not, however, then A and B can compete for each other’s customers.
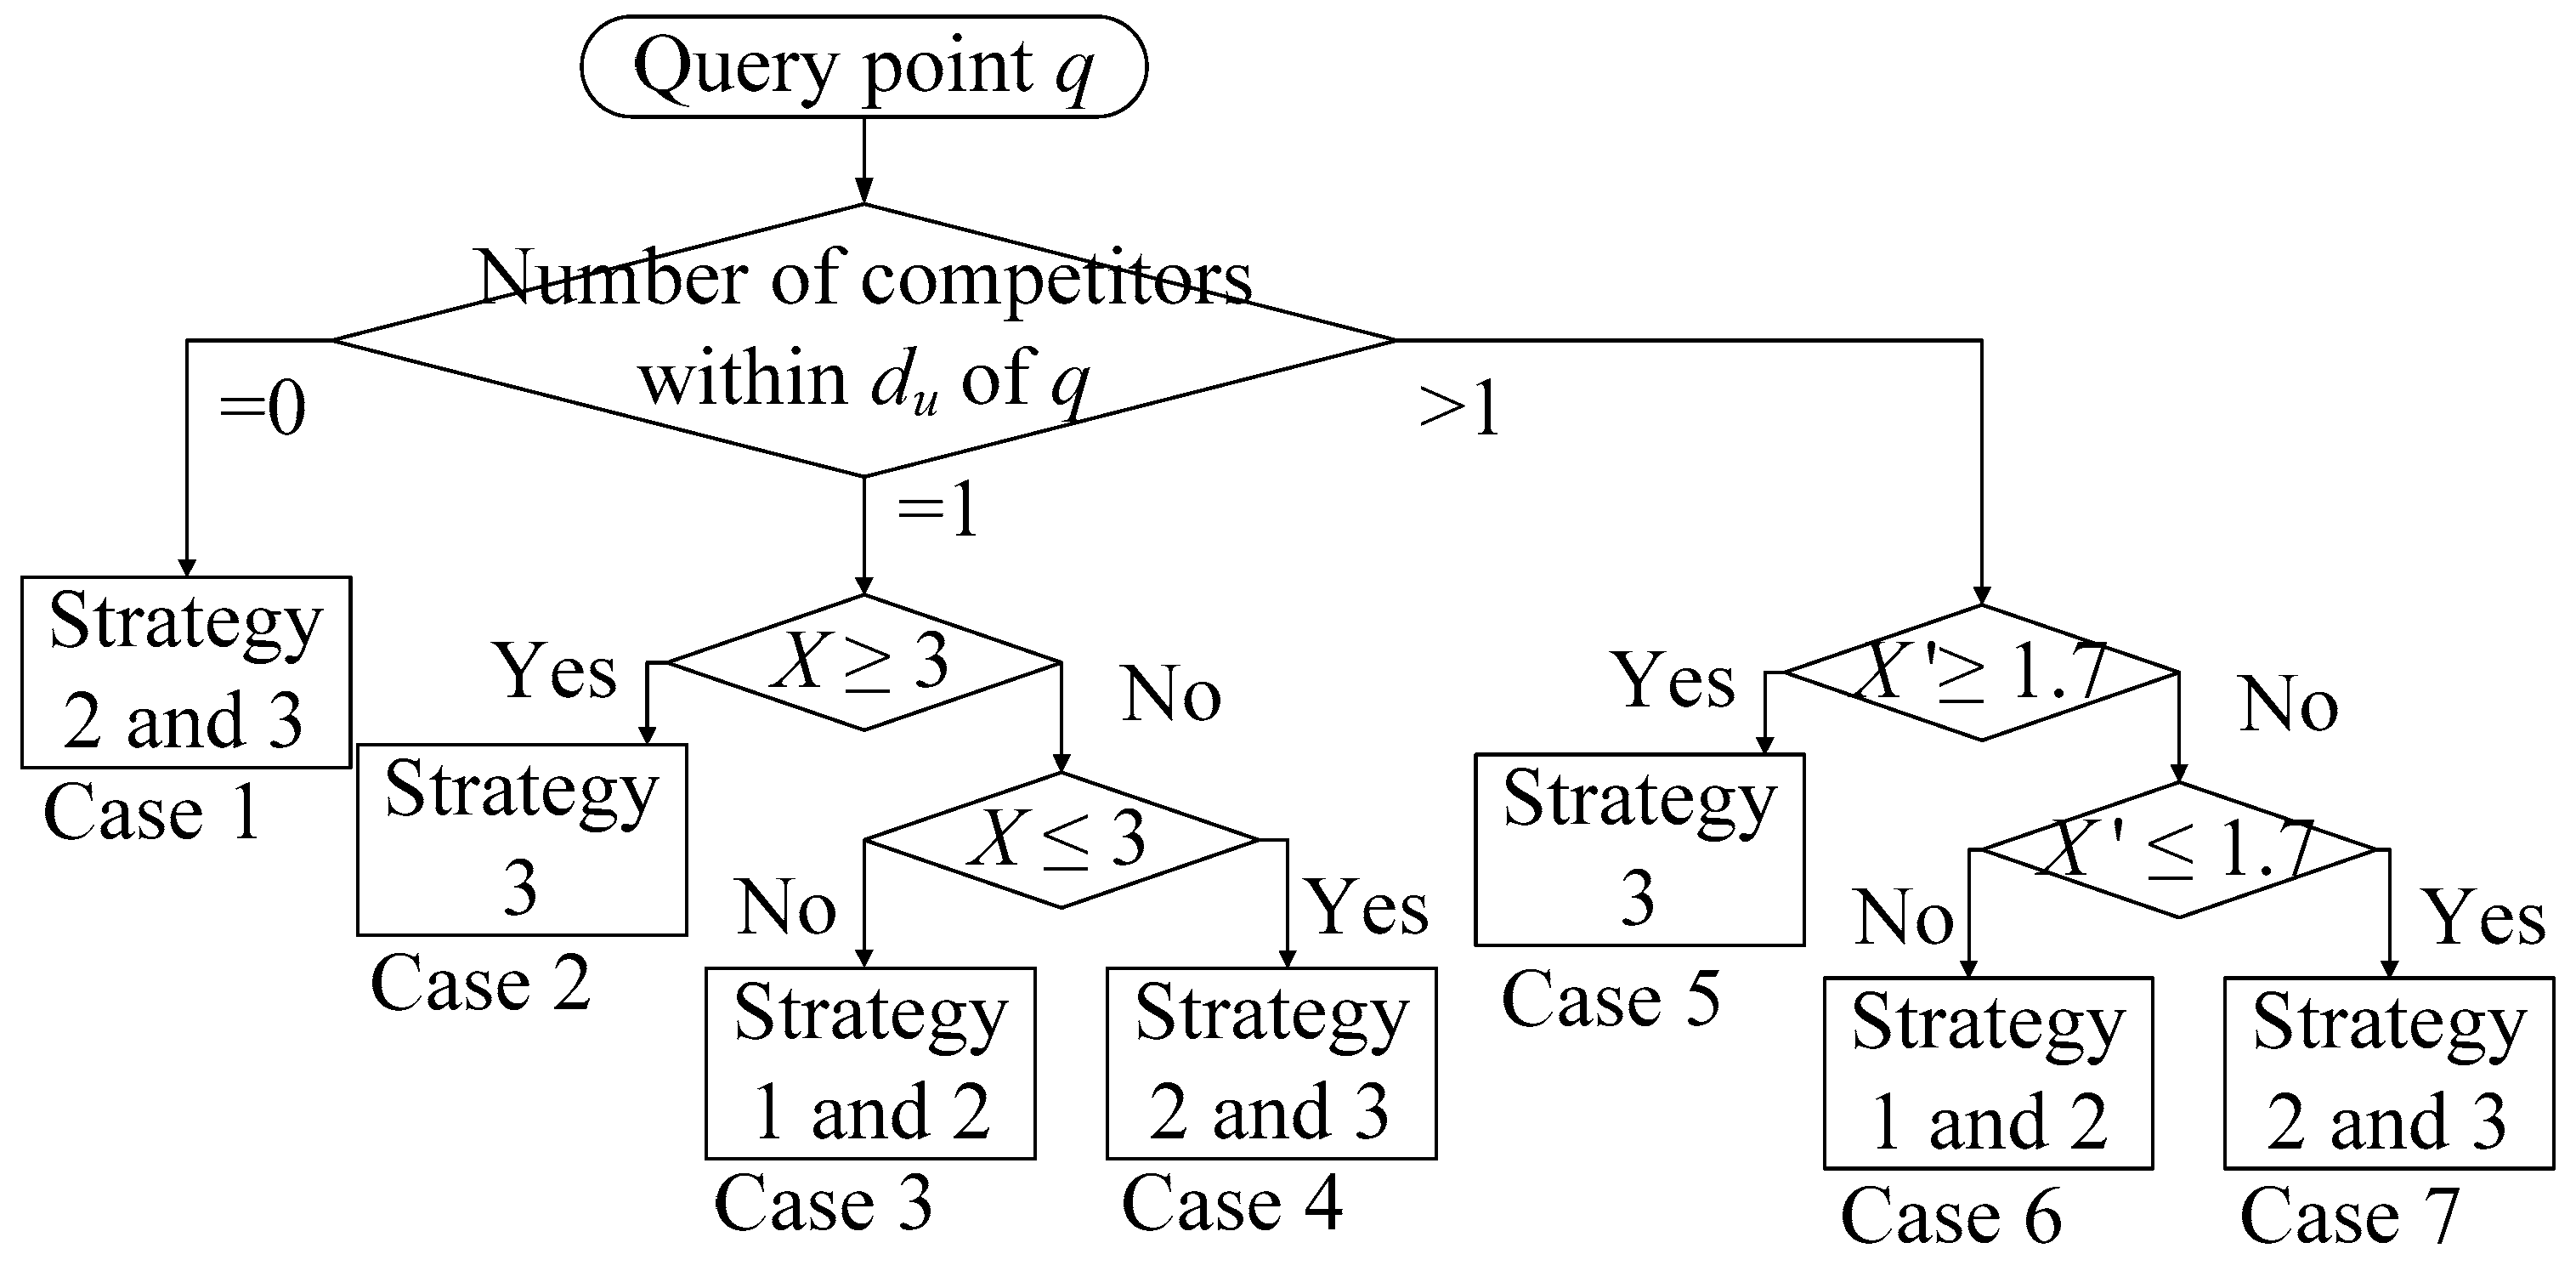
Based on Theorem 1 and 2, we categorized market competition between the POIs into seven potential scenarios, corresponding to three different strategies. There are one to two response strategies to each scenario (
Figure 7). Our three response strategies are discussed below, followed by the seven market scenarios. We designated the query POI as
q, and assumed that POIs of the same category as
q are its competitors. Competitors that have comparable market share to
q and therefore pose a reasonable threat are referred to as real competitors. We used user-given distance
du to define the ’area’ referred to in Theorems 1 and 2.
Our three response strategies are as follows:
Strategy 1. Attracting customers from real competitors: The objective of this strategy is to attract the customers of real competitors. To achieve this objective through a joint promotion, q must identify POIs that share the same customer groups as the real competitors, and then partner with those POIs to employ new promotional activities to attract customers.
Strategy 2. Protecting one’s own customer base: The objective of this strategy is to prevent the loss of existing customers. To achieve this goal through a joint promotion, q must identify what other POIs its customers like to frequent, and partner with those POIs in a joint promotion. This provides the customers of q with a strong incentive to keep coming back to q to consume.
Strategy 3. Attracting potential customers: This strategy aims to attract potential new customers. We must first identify POIs with clientele who may be interested in q, and then partner with POIs from that category to host a joint promotion. The reason that we first evaluate POIs by category is because there may be many POIs in one city, and assessing their customer groups individually would be too time-consuming. Our approach reduces the number of POIs to be processed and therefore accelerates computational speed.
Next, we outline the seven market scenarios of
Figure 7. Note that for the ease of explanation, the value of (market share of
q/market share of competitor) is defined as
X in the following.
In Case 1, du has no competitors at all. Without an opportunity to attract the customers of competitors (i.e., Strategy 1), the only remaining options are to protect its own customer base or attract potential customers (i.e., Strategies 2 and 3).
In Cases 2 to 4, there is only one competitor within du of q:
In Case 2, there is only one competitor within du and X ≥ 3. In this situation, other POIs will not be able to attract the customers of q (Theorem 1) and will even lose money in the process of attempting to. Therefore, q does not need to worry about protecting its existing customers (i.e., Strategy 1) and can focus on the other two strategies. However, because the market share of competitors is significantly lower than that of q, there is no need to attract customers from competitors. Therefore, q need only focus on attracting potential customers (i.e., Strategy 3).
In Case 3, there is only one competitor within du and X is within the range of [1/3, 3], meaning that q and its real competitor both have a chance of attracting each other’s customers (Theorem 1). Therefore, q must focus on luring the customers of its real competitor (i.e., Strategy 1) as well as consolidating its existing customer base (i.e., Strategy 2), in order to gain greater market share. In this scenario, it is not necessary to attract new customer groups (i.e., Strategy 3).
In Case 4, there is only one competitor within du and X ≤ 1/3. This means that q cannot compete for the customers of its competitor (Theorem 1) and can only employ Strategies 2 and 3 to protect its existing customer base while attracting potential new customers. In Cases 5 to 7, multiple competitors are within du of q. We discuss different cases and response strategies below, where the value of (market share ratio between q and these competitors) is defined as X’.
In Case 5, there are two or more competitors within du, and X’ ≥ 1.7. In this scenario, no competitors can compete for q’s customers (Theorem 2), and it would not be efficient for q to attempt to attract the customers of its competitors. Therefore, q need focus on developing new customer groups (i.e., Strategy 3).
In Case 6, there are two or more competitors within du, and X’ is within the range of [10/17, 1.7]. This means that q and its competitors all have the opportunity to attract each other’s customers (Theorem 2). For this reason, q should employ Strategies 1 and 2 to attract the customers of its real competitors while protecting its own customer base.
In Case 7, there are two or more competitors within du, and X ’≤ 10/17. This means that q cannot attract customers from its competitors (Theorem 2) and must protect its own customer base as well as generate new business (i.e., Strategies 2 & 3).
Note that in some unusual cases, the predetermined strategies may fail to identify k number of partners; in such cases, we apply additional strategies. For example, if the results of Strategies 1 and 2 in Case 6 did not meet the requirement for k partners, we would then apply Strategy 3 to make up the difference.
The above discussion shows that market share is an important factor in the evaluation of the competitiveness of a POI. Equation (13) shows how we calculate market share using check-in data:
where
oi is the POI for which we are calculating market share;
OMS is the set of POIs in the same category as query POI
q, and
o.tct is the total check-in times of a POI (
o∈
OMS). Higher check-in times implies greater market share.
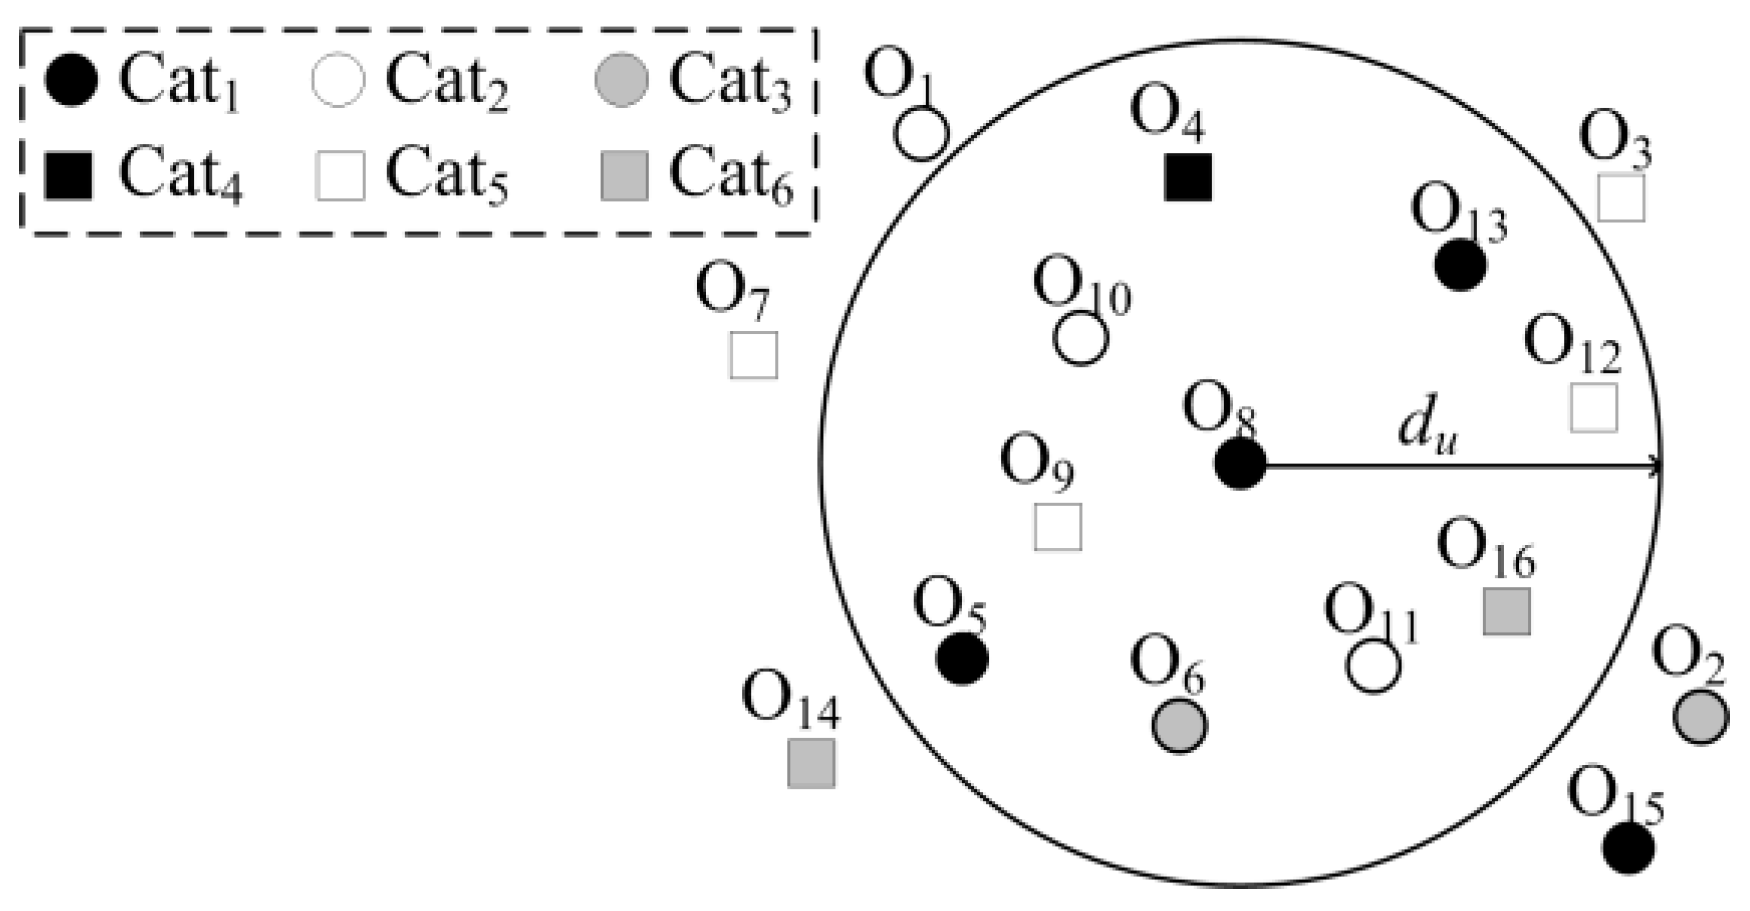
Figure 1 presents an example of the process of strategy selection on the basis of check-in data, where
o8 = query POI
q. Within the given range shown in the figure,
o8 has two competitors:
o5, and
o13. Given the check-in frequencies of
o5,
o8 and
o13 as 100, 150, and 180 times, respectively, then market share is calculated as follows: 100/(100+150 +180)*100%=23%; 150/(100+150+180)*100% = 35%, and 180/(100+150+180)*100% = 42%. In this example,
o8 has multiple competitors and its market share ratio to at least one of these competitors is within the range of [10/17, 1.7]. This is considered a Case 6 scenario. This means that
o8 should employ Strategies 1 & 2. If it is still unable to identify k partners, then we will apply Strategy 3 to source enough partners to meet the requirement.
4.3.2. Finding Candidate Partners
After selection of appropriate strategies for query POI q, the next step is to employ these strategies to select candidate partners. In this section we explain how to use POI graphs (PG) and category graphs (CG) to find candidate partners for the three abovementioned response strategies.
Strategy 1. Attracting customers from real competitors: In this strategy,
q must identify the POIs that share customers with its real competitors. These POIs are the nodes linked to
q and its real competitors in the
PG. The
UPSs for
q, real competitors, and these nodes must also exceed a certain threshold. We need only identify these nodes in order to find candidate partners for
q. Note that the
PG enables us to easily calculate the three scores for any two POIs. The
UPS threshold must be considered in order to eliminate those POIs that do not share customers with
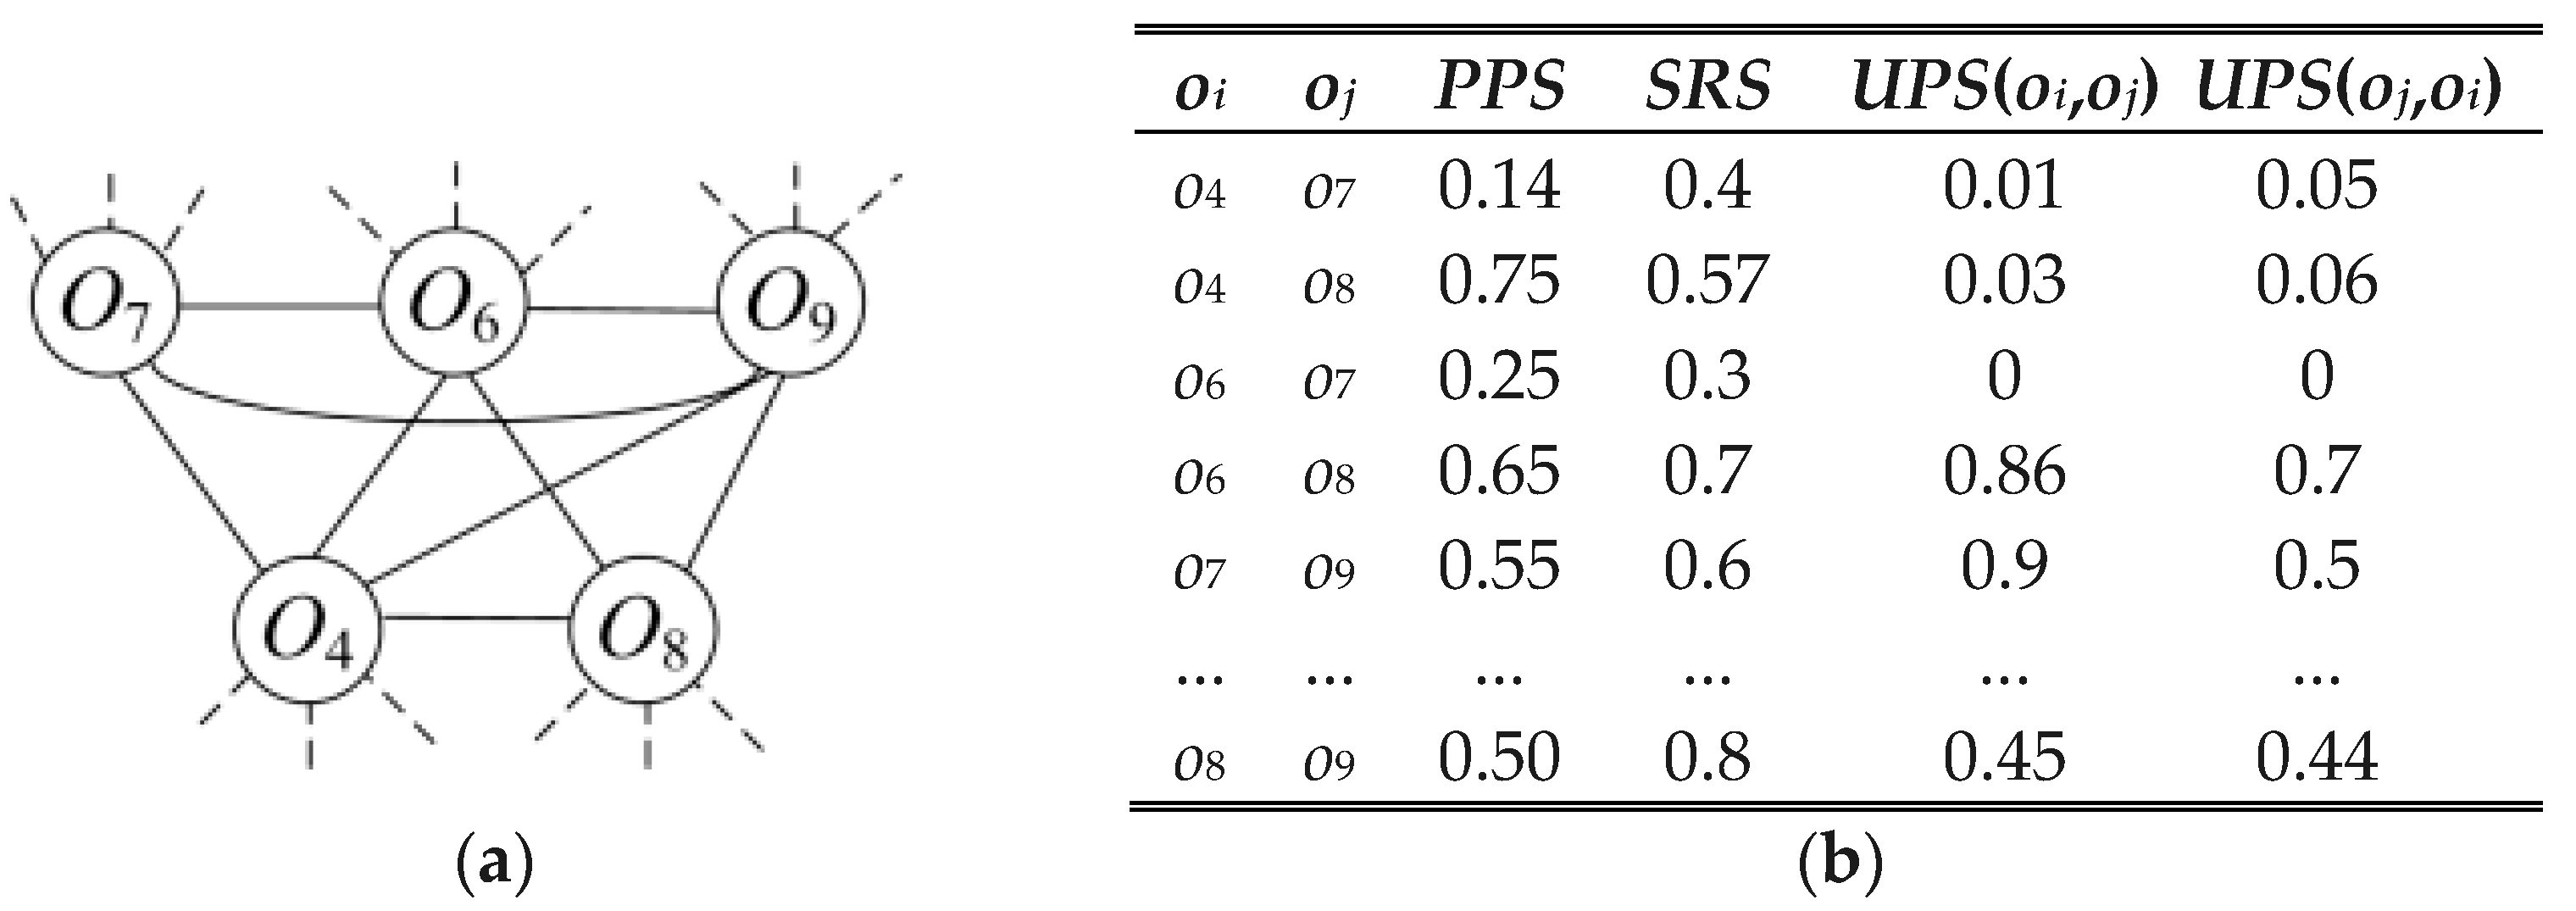
q or whose customers are unlikely to participate in promotional activities. For example, if the
UPS threshold of
Figure 5 is set at 0.1,
o8 is the query POI
q, and
o7 is the real competitor of
o8. The selected node is
o9 because it is linked to both
o7 and
o8, and the
UPS score exceeds 0.1, indicating that many customers of
o9 visit
o8 and
o7. For these reasons,
o9 is a candidate partner of
o8. Although
o4 is linked to
o7 and
o8, it was not selected because the
UPS results were 0.01 and 0.03, i.e., less than 0.1. The probability that the customers of
o4 will participate in the promotional activity is therefore too low. Likewise,
o6 was not selected because its
UPS in relation to
o7 equaled 0, indicating that it shares no customers with
o7.
Strategy 2. Protecting one’s own customer base: To implement this strategy
q must identify POIs frequented by its existing customers and partner with these POIs in joint promotion. Customers are then encouraged to continue to frequent this POI in order to participate in the promotion. To identify suitable partners, we must identify nodes that are linked to
q and have
UPS above a predefined threshold. As for Strategy 2, threshold values are considered to eliminate those POIs that do not share customers with
q or whose customers are unlikely to participate in promotional activities. For example, if the
UPS threshold of
Figure 5 is set at 0.1 and the candidate partners are
o6 and
o9.
Strategy 3. Attracting potential customers: The aim of this strategy is to attract potential customers (those who have not previously been to
q but are likely to be interested in doing so). Because these individuals have never visited
q, we are unable to obtain data using the
PG, as the
PG only records data on customers who have been to
q at some point. We instead use the category graph (
CG) to identify the category
catq. of
q. We next identify which additional categories the customers of
catq also enjoy (using
UPS value). The POIs in such categories are the candidate partners of
q.
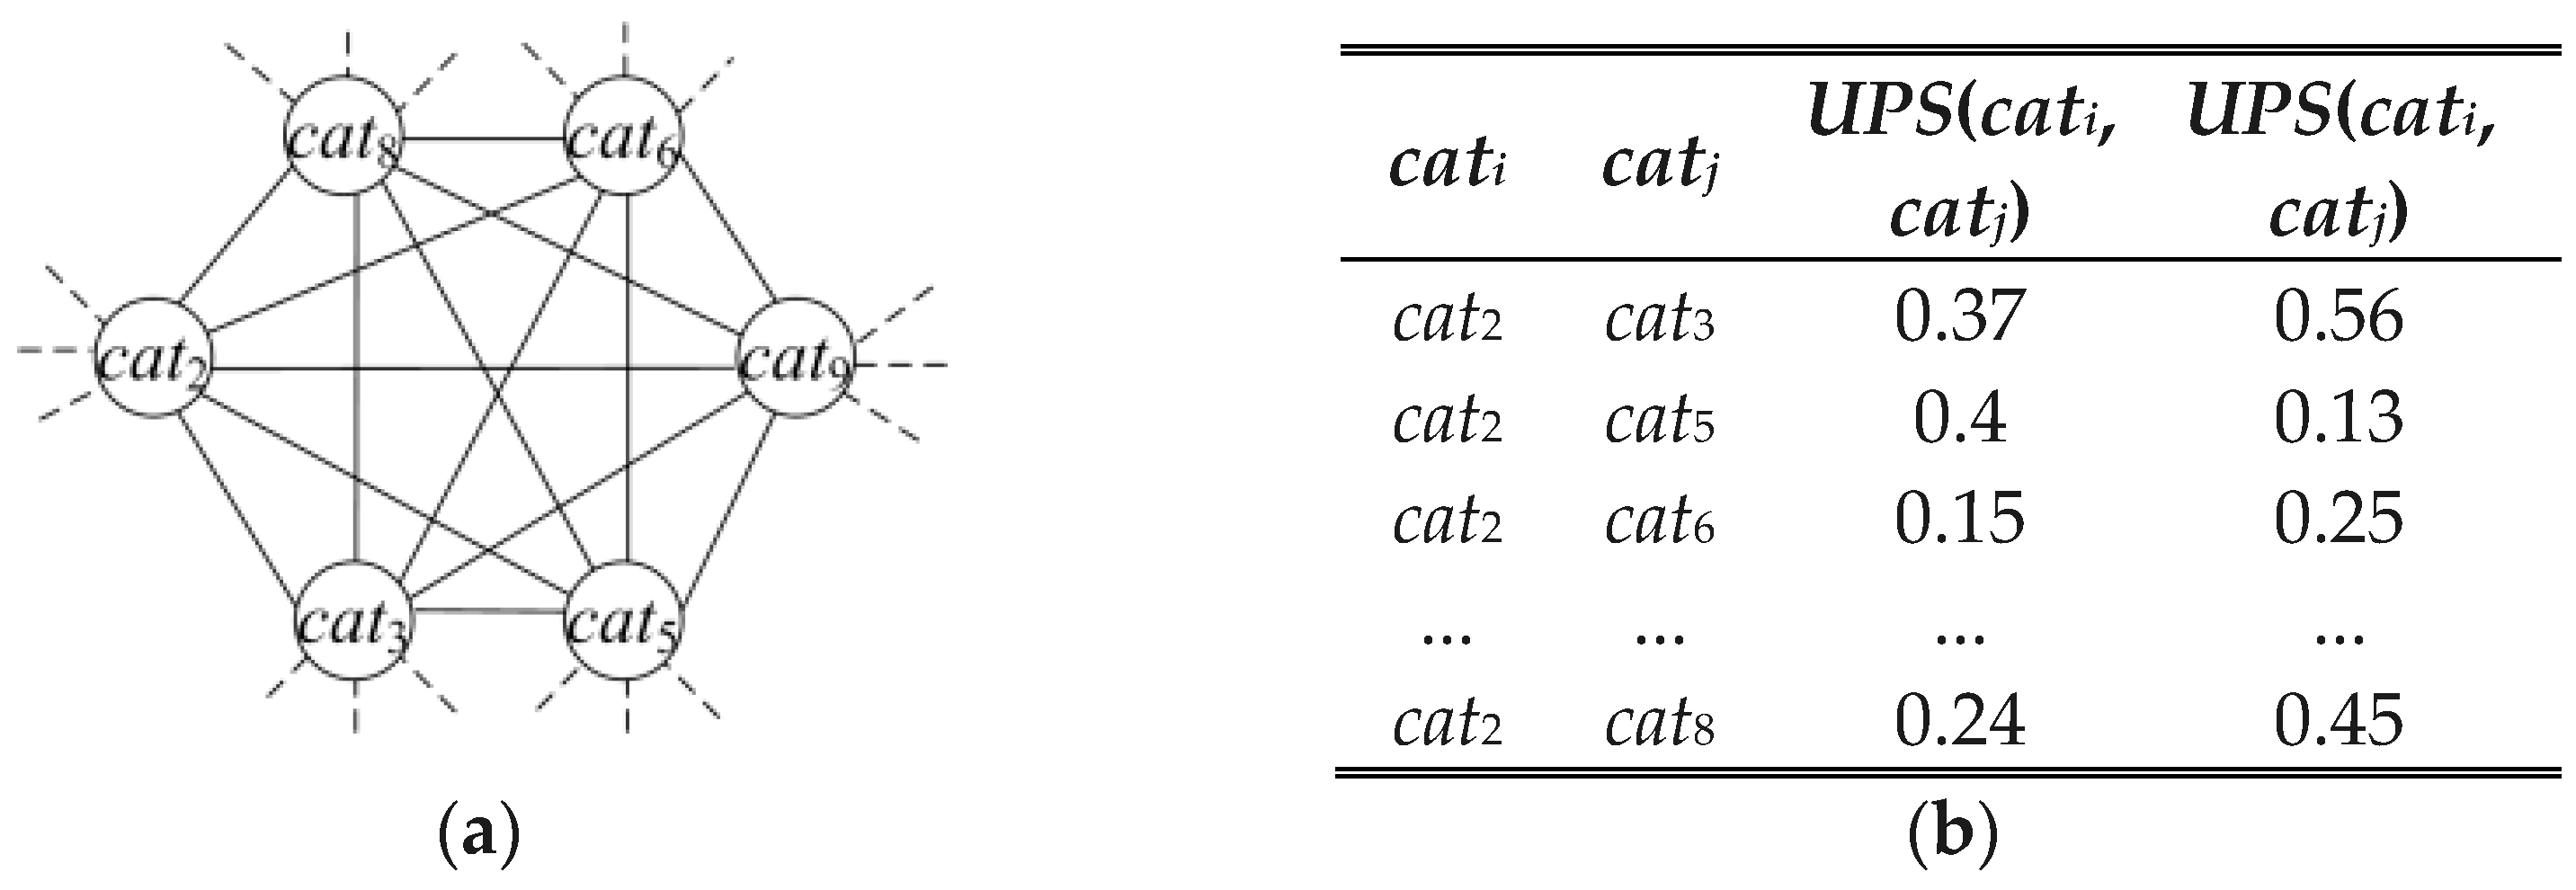
Figure 6 shows an example in which query POI
q belongs to
cat8, and
cat8 customers also like
cat2,
cat3,
cat5 and
cat6. Therefore, the POIs in these categories are all candidate partners.
4.3.3. Partner Score Calculation
After identifying all candidates, we calculate the fit between each candidate partner
pcand and query POI
q. The calculation is a two-part process. We first calculate the willingness of
q to collaborate with any
pcand,, (
W(
q,
pcand)) and vice versa (
W(
pcand,
q)). Note that
W(
q,
pcand) and
W(
pcand,
q) may not be the same, because
q may want to partner with a certain
pcand, but that
pcand may not be willing to collaborate with
q. We next use
W(
q,
pcand) and
W(
pcand,
q) to calculate the feasibility of partner score between
q and any
pcand PS(
pcand,
q). We can calculate the willingness score of a POI
oi to collaborate with another POI
oj as follows:
where
α and
β are user-given parameters. The three scores are obtained from
PG and
CG and do not need to be separately calculated, which reduces computational time.
The partner score
PS(
oi,
q) is then calculated from the above results, as shown in Equation (15):
Note that W(oi, q)+ W(q, oi) is the sum total of partnership feasibility between the two POIs. Generally speaking, the higher this score, the higher the partner score. However, there are exceptions to this guideline. If the values of W(oi, q), W(q, oi) vary too greatly, this may be reduce their partnership feasibility, even if the sum total is high. We therefore subtract |W(oi, q) − W(q, oi)|/(W(oi, q) + W(q, oi)) to avoid this situation. Note that the difference between the POI scores is divided by W(oi, q) + W(q, oi) for normalization.


