Mapping Brick Kilns to Support Environmental Impact Studies around Delhi Using Sentinel-2

 ,
, 
 , and
, and 
Abstract
:
1. Introduction
Background
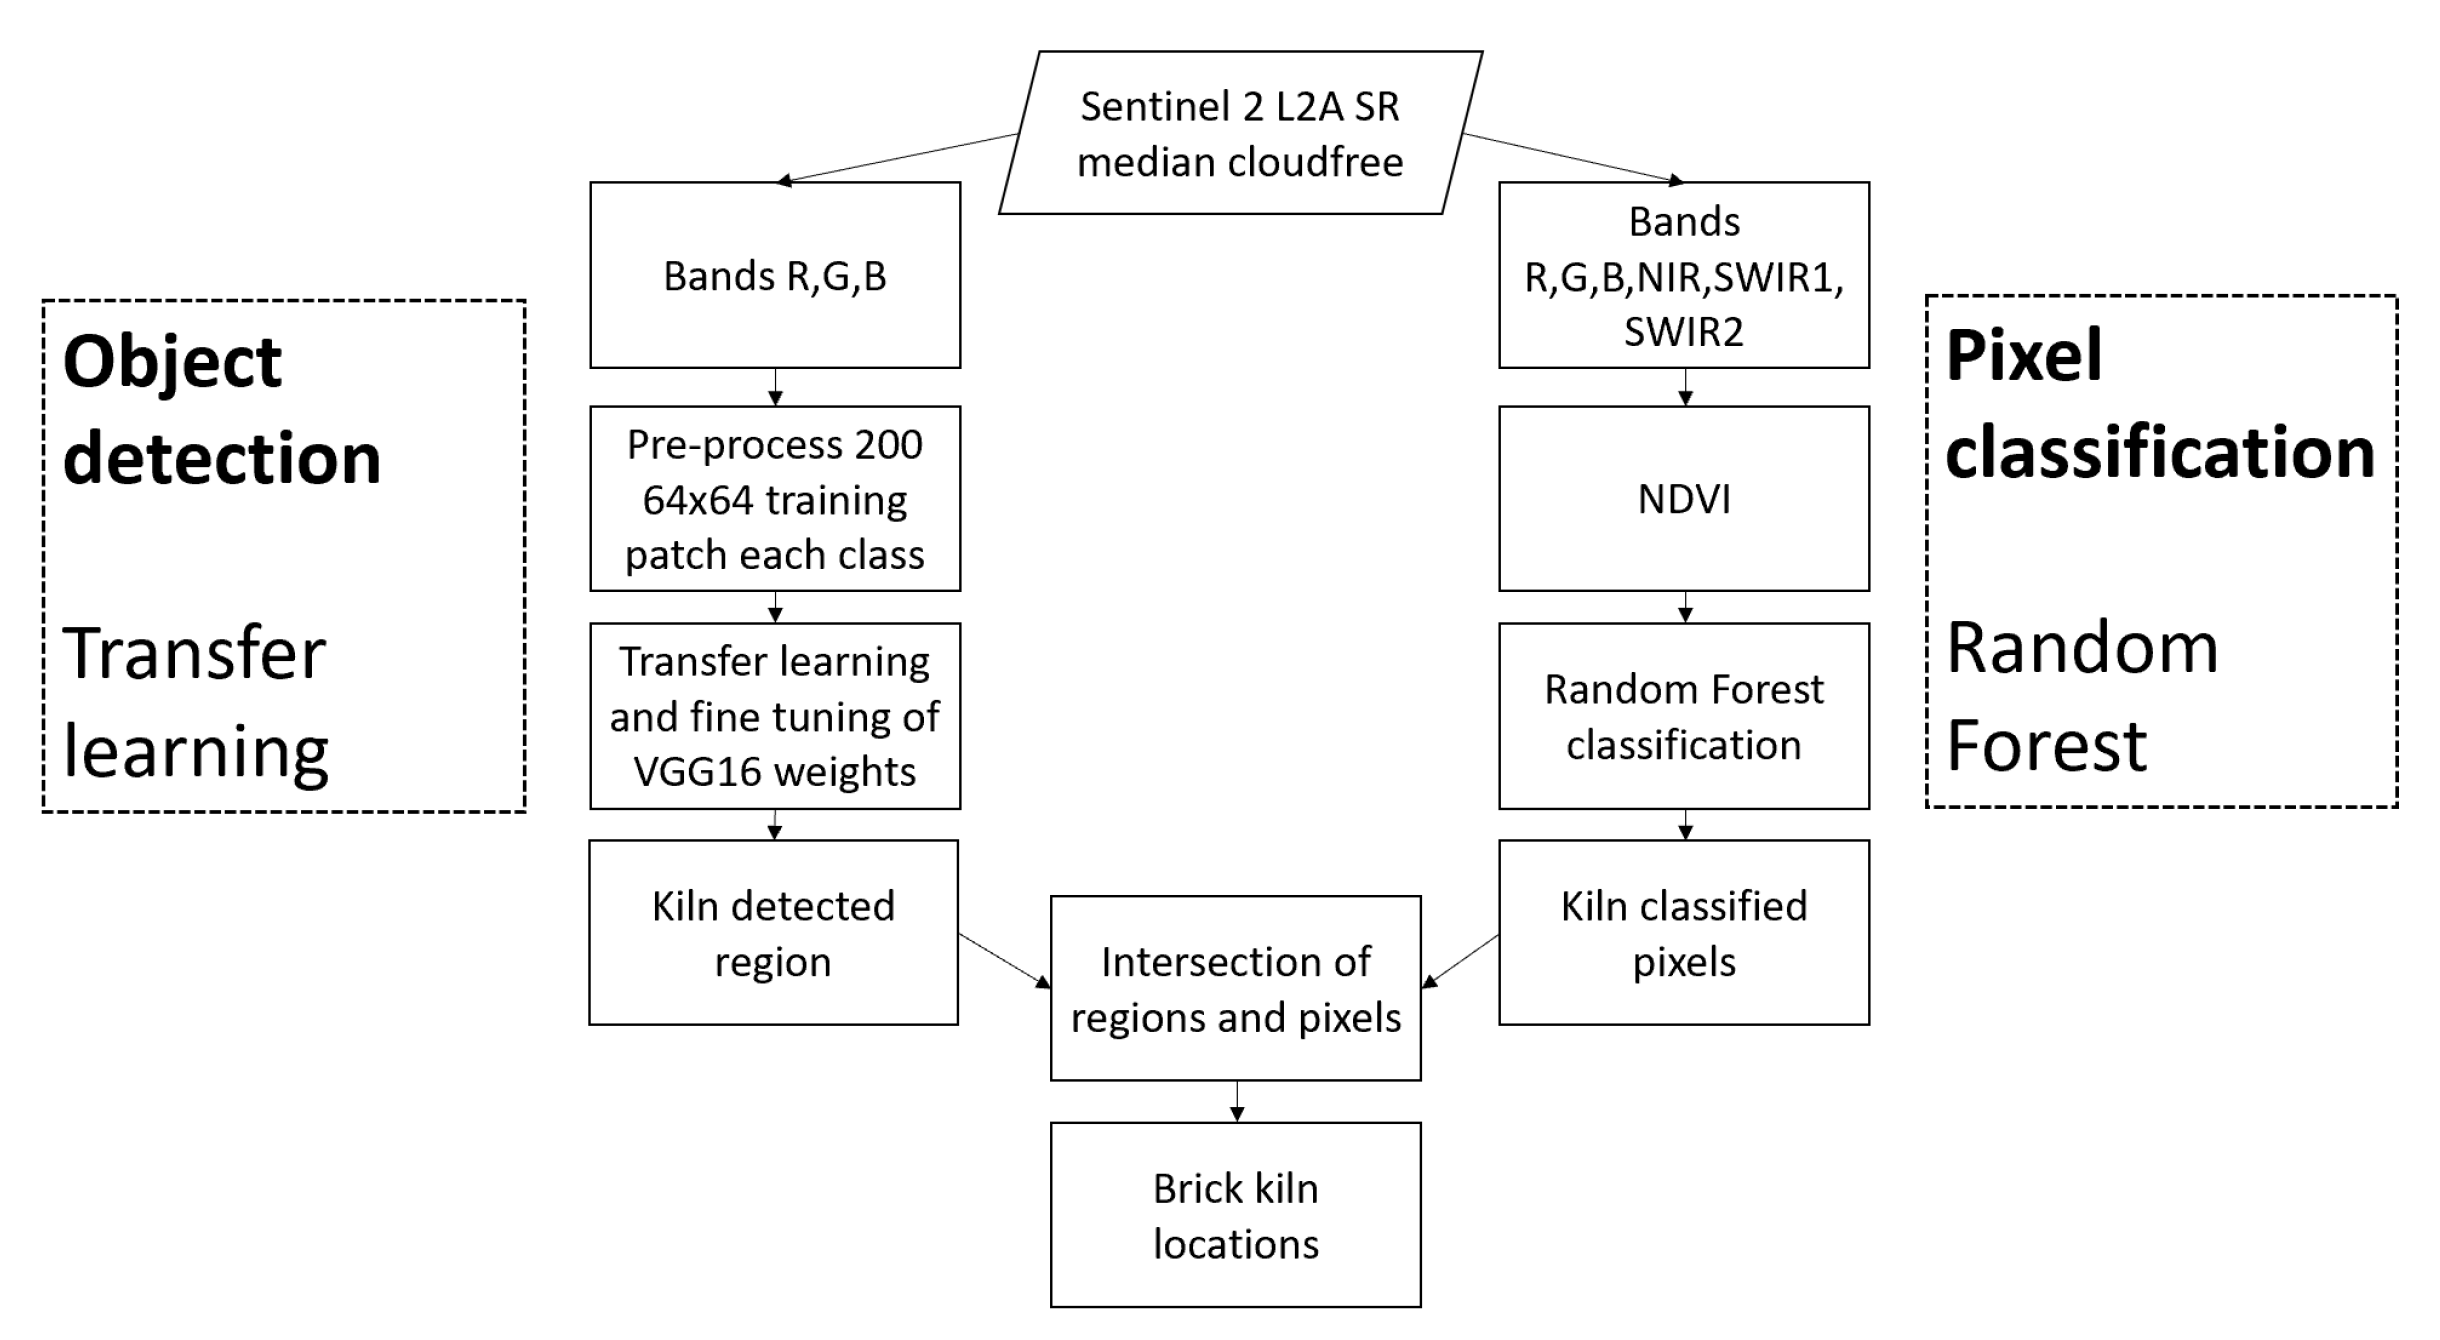
2. Methodology
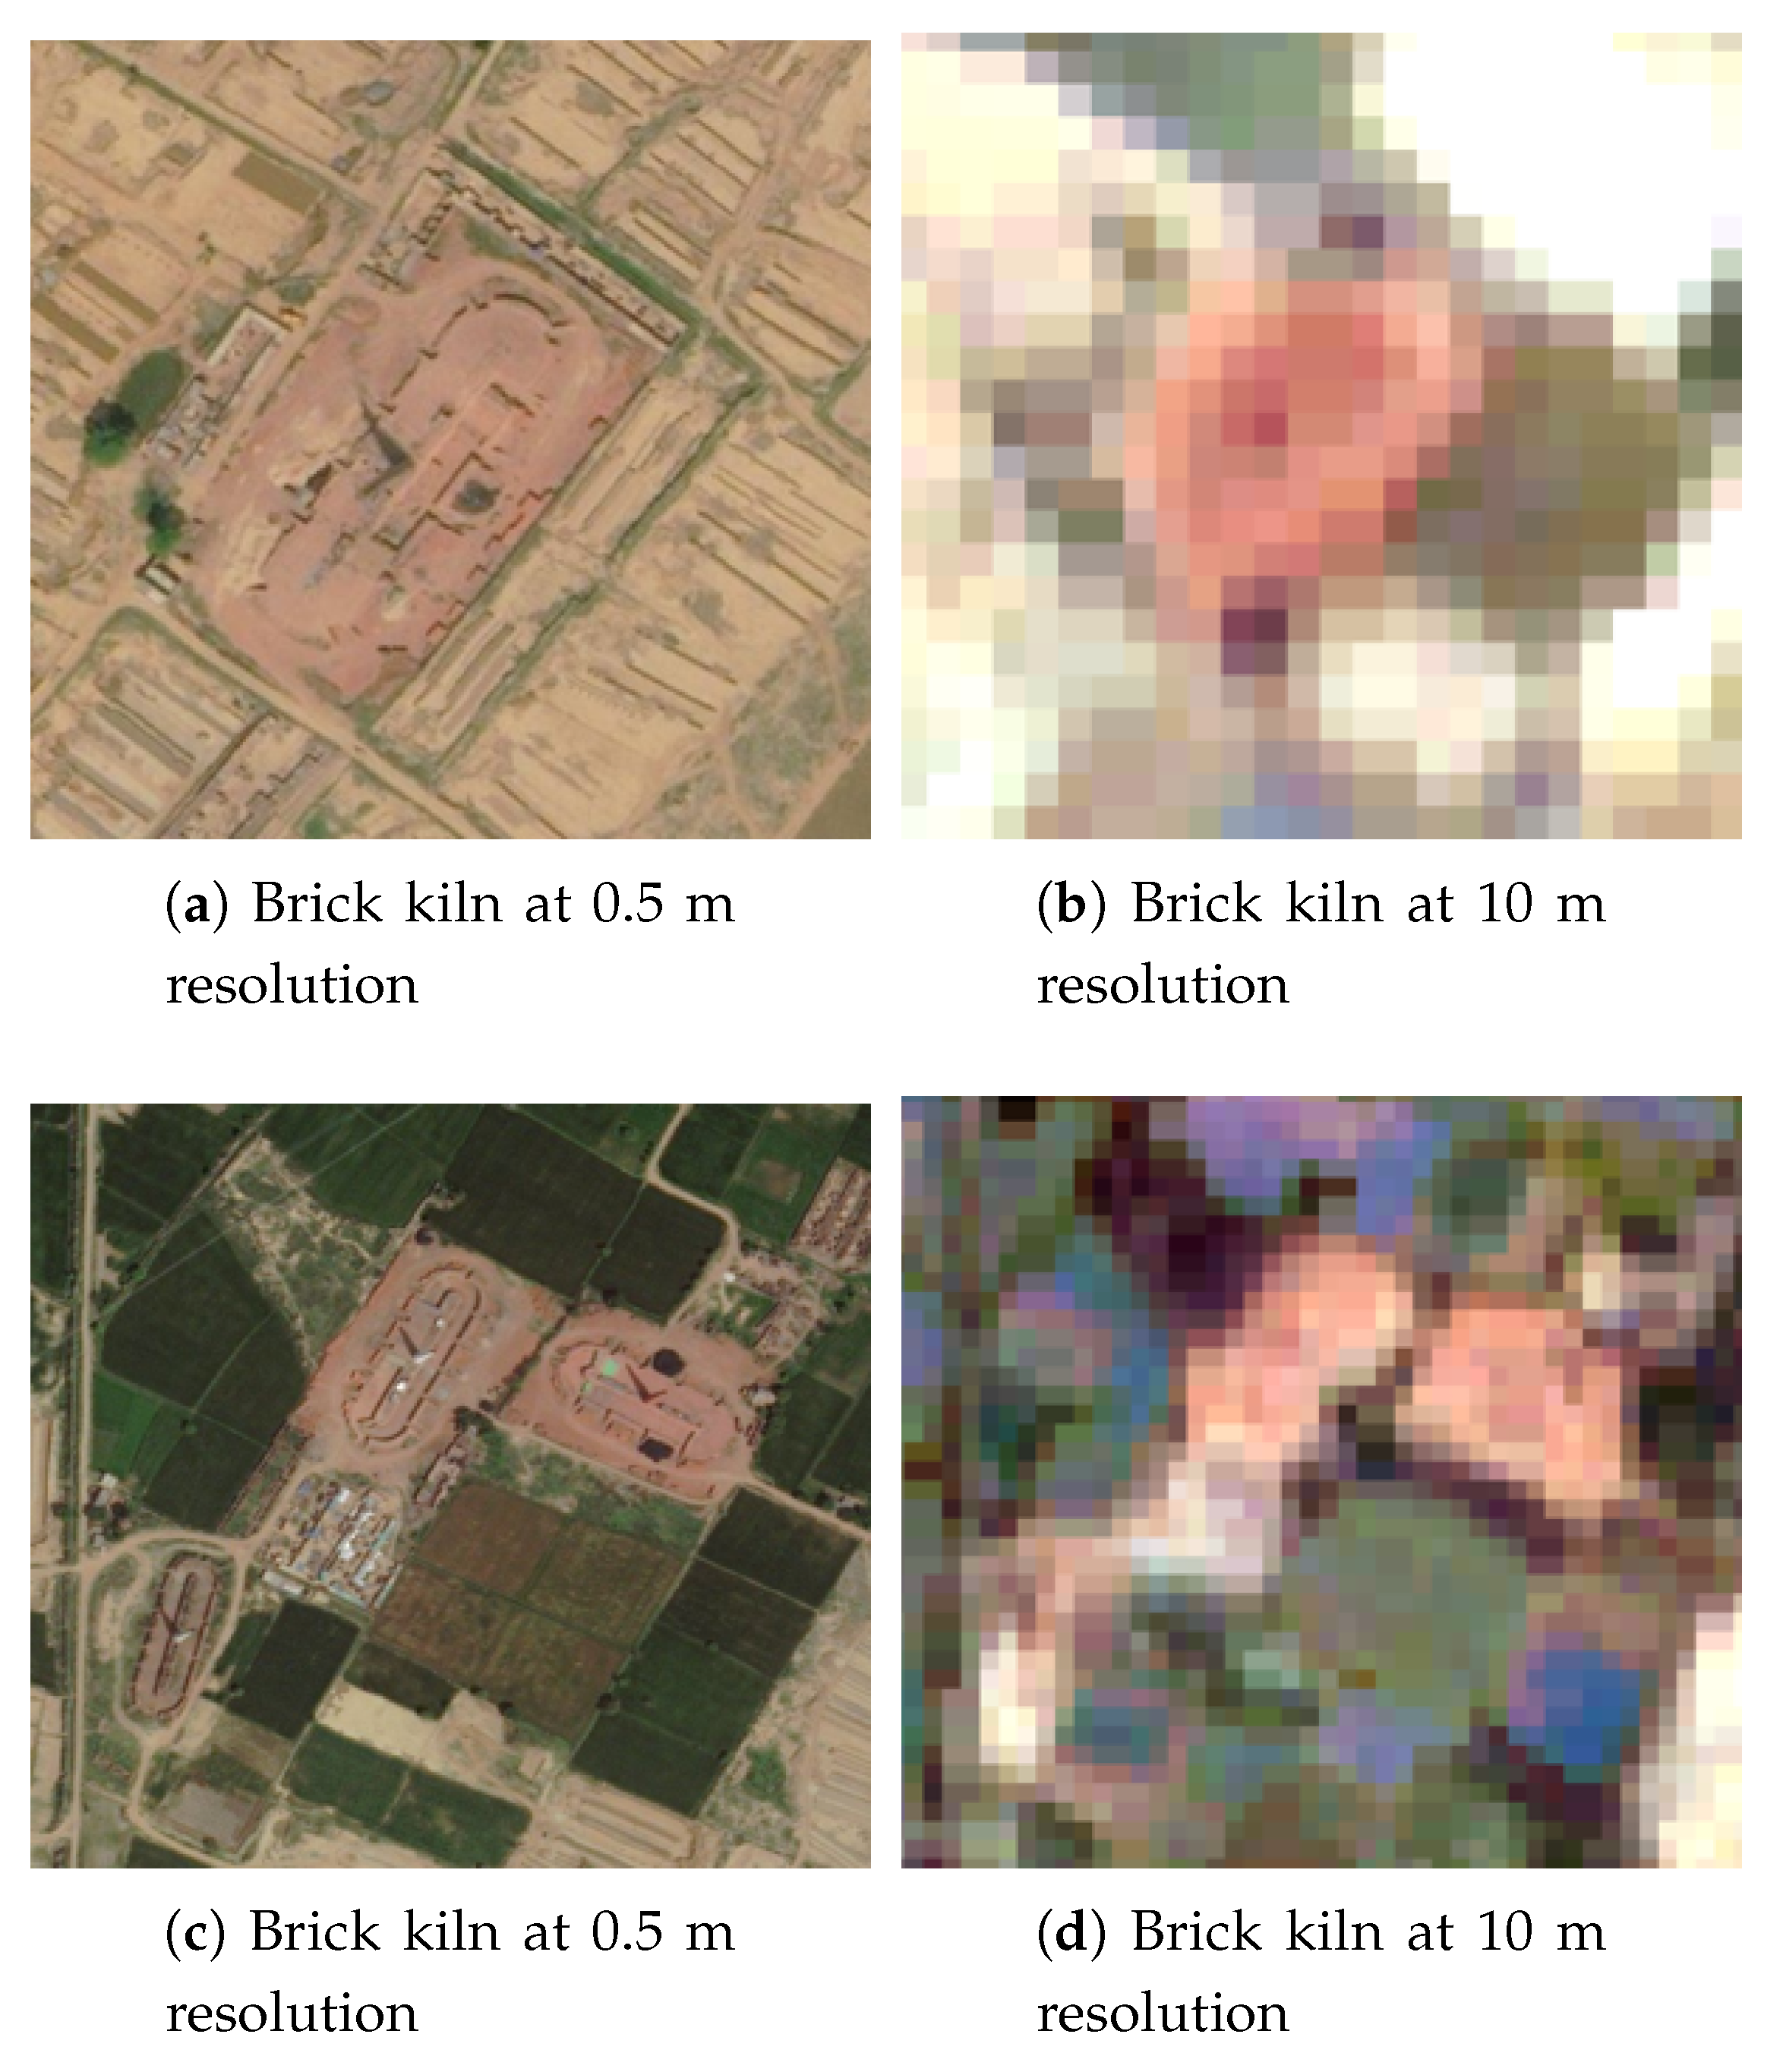
2.1. Data
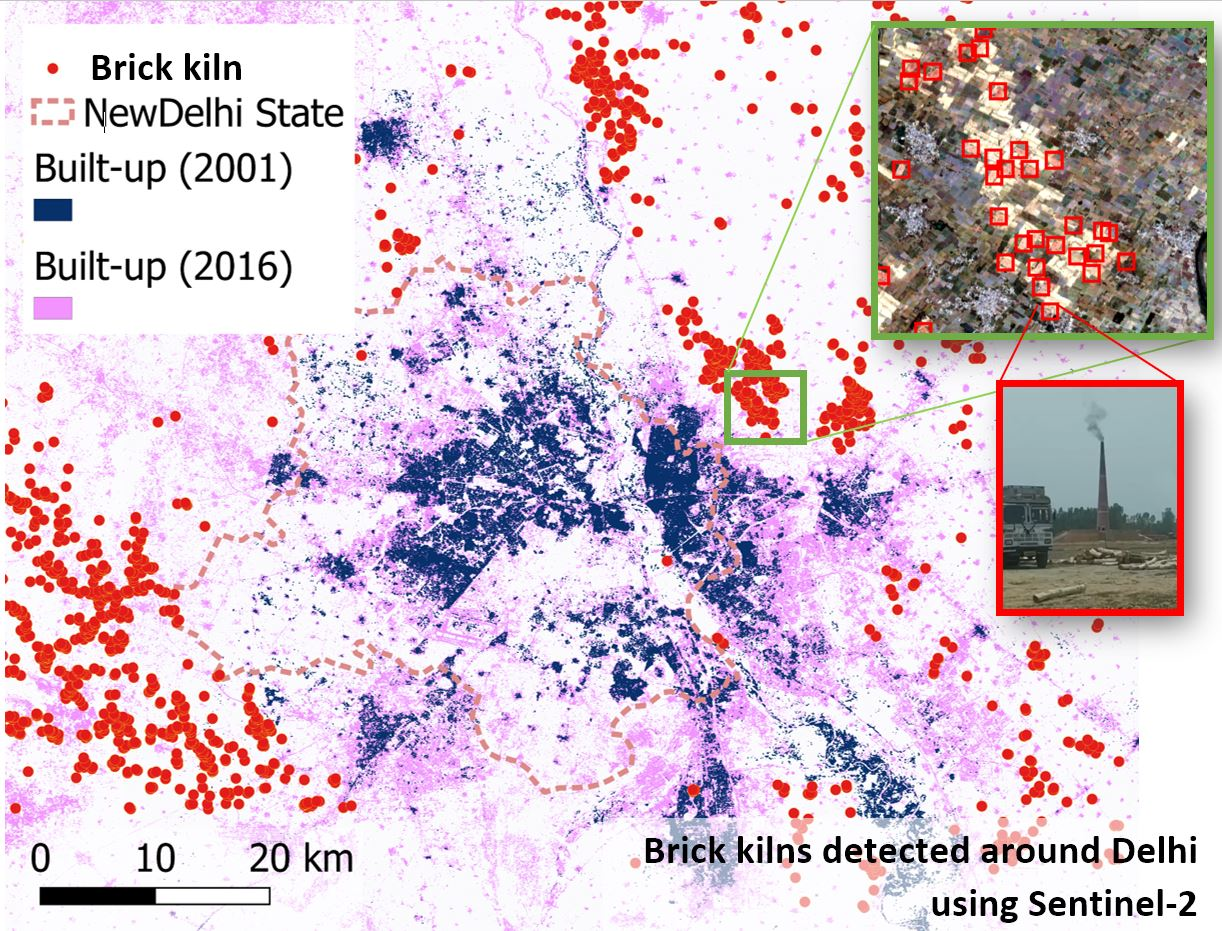
2.2. Location
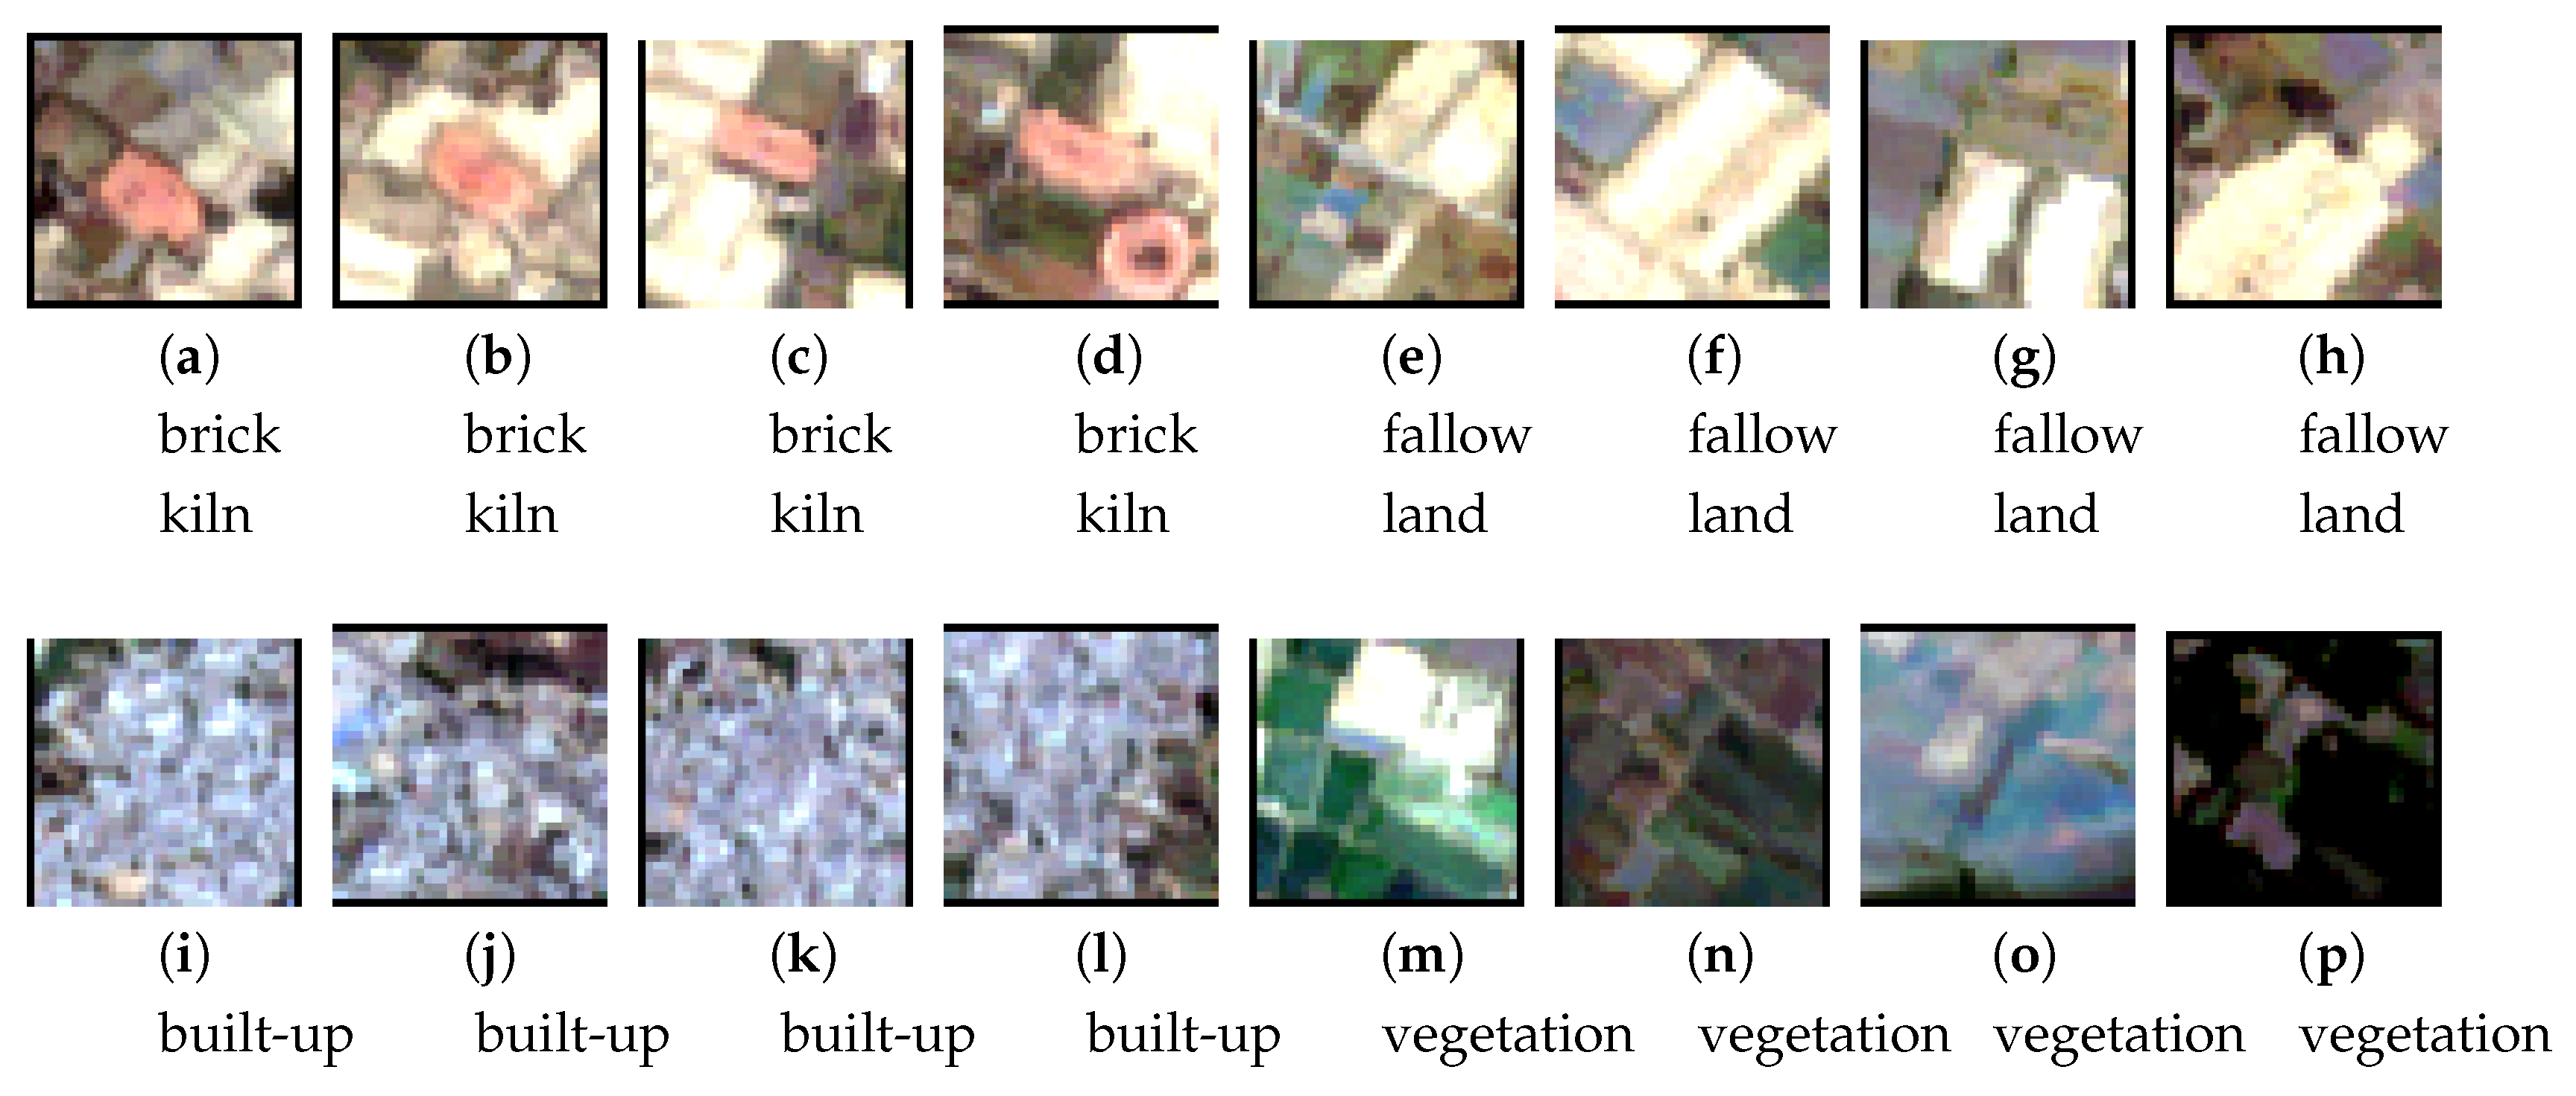
2.3. Transfer Learning Based Object Identification
2.4. Random Forest Based Pixel Classification
3. Result and Discussion
3.1. Brick Kiln Identification
3.2. Drivers of Brick Kiln Locations
3.3. Age of Brick Kiln Operations
3.4. Future Work
4. Conclusions
Supplementary Materials
Author Contributions
Funding
Acknowledgments
Conflicts of Interest
Sample Availability
References
- Rajarathnam, U.; Athalye, V.; Ragavan, S.; Maithel, S.; Lalchandani, D.; Kumar, S.; Baum, E.; Weyant, C.; Bond, T. Assessment of air pollutant emissions from brick kilns. Atmos. Environ. 2014, 98, 549–553. [Google Scholar] [CrossRef]
- Maithel, S.; Uma, R.; Bond, T.; Baum, E.; Thao, V. Brick Kilns Performance Assessment A Roadmap for Cleaner Brick Production in India; Technical Report; Greentech Knowledge Solutions: New Delhi, India, 2012. [Google Scholar]
- Bhat, M.S.; Afeefa, Q.S.; Ashok, K.P.; Bashir, A.G. Brick kiln emissions and its environmental impact: A Review. J. Ecol. Nat. Environ. 2014, 6, 1–11. [Google Scholar] [CrossRef]
- Misra, P.; Fujikawa, A.; Takeuchi, W. Novel decomposition scheme for characterizing urban air quality with MODIS. Remote. Sens. 2017, 9, 812. [Google Scholar] [CrossRef] [Green Version]
- Maheshwari, H.; Jain, K. Carbon Footprint of Bricks Production in Fixed Chimney Bull’s Trench Kilns in India. Indian J. Sci. Technol. 2017, 10, 1–11. [Google Scholar] [CrossRef]
- Center for Science and Environment. Emissions Monitoring of Brick Kilns; Technical Report; Center for Science and Environment: New Delhi, India, 2019. [Google Scholar]
- Tibrewal, K.; Maithel, S.; Venkataraman, C. A State-Level Methodology for Estimating Present-Day Emissions of Short-Lived Climate Pollutants from Fired Brick Production in India. In Climate Change Signals and Response; Springer: Singapore, 2019; pp. 211–229. [Google Scholar] [CrossRef]
- Begum, B.A.; Biswas, S.K.; Hopke, P.K. Key issues in controlling air pollutants in Dhaka, Bangladesh. Atmos. Environ. 2011, 45, 7705–7713. [Google Scholar] [CrossRef]
- Guttikunda, S.K.; Begum, B.A.; Wadud, Z. Particulate pollution from brick kiln clusters in the Greater Dhaka region, Bangladesh. Air Qual. Atmos. Health 2013, 6, 357–365. [Google Scholar] [CrossRef]
- Luby, S.P.; Biswas, D.; Gurley, E.S.; Hossain, I. Why highly polluting methods are used to manufacture bricks in Bangladesh. Energy Sustain. Dev. 2015, 28, 68–74. [Google Scholar] [CrossRef]
- Al Nayeem, A.; Hossain, M.S.; Majumder, A.K.; Carter, W.S. Spatiotemporal Variation of Brick Kilns and it’s relation to Ground-level PM2.5 through MODIS Image at Dhaka District, Bangladesh. Int. J. Environ. Pollut. Environ. Model. 2019, 2, 277–284. [Google Scholar]
- Nepal, S.; Mahapatra, P.; Adhikari, S.; Shrestha, S.; Sharma, P.; Shrestha, K.; Pradhan, B.; Puppala, S. A Comparative Study of Stack Emissions from Straight-Line and Zigzag Brick Kilns in Nepal. Atmosphere 2019, 10, 107. [Google Scholar] [CrossRef] [Green Version]
- Guttikunda, S.K.; Calori, G. A GIS based emissions inventory at 1 km × 1 km spatial resolution for air pollution analysis in Delhi, India. Atmos. Environ. 2013, 67, 101–111. [Google Scholar] [CrossRef]
- Arbain, A.A.; Imasu, R. Estimating PM2.5 Emission from Brick Kiln Industry over Northern India with Numerical Model and Remote Sensing Observation. In Proceedings of the International Geoscience and Remote Sensing Symposium (IGARSS), Yokohama, Japan, 28 July–2 August 2019. [Google Scholar] [CrossRef]
- Reddy, M.; Venkataraman, C. Inventory of aerosol and sulphur dioxide emissions from India: I—Fossil fuel combustion. Atmos. Environ. 2002, 36, 677–697. [Google Scholar] [CrossRef]
- Pangtey, B.S.; Kumar, S.; Bihari, V.; Mathur, N.; Rastogi, S.K.; Srivastava, A.K. An environmental profile of brick kilns in Lucknow. Indian J. Environ. Health 2004, 46, 239–244. [Google Scholar]
- Paliwal, U.; Sharma, M.; Burkhart, J.F. Monthly and spatially resolved black carbon emission inventory of India: Uncertainty analysis. Atmos. Chem. Phys. 2016, 16, 12457–12476. [Google Scholar] [CrossRef] [Green Version]
- Guttikunda, S.K.; Nishadh, K.A.; Jawahar, P. Air pollution knowledge assessments (APnA) for 20 Indian cities. Urban Clim. 2019, 27, 124–141. [Google Scholar] [CrossRef]
- Misra, P.; Imasu, R.; Takeuchi, W. Impact of urban growth on air quality in Indian cities using hierarchical Bayesian approach. Atmosphere 2019, 10, 517. [Google Scholar] [CrossRef] [Green Version]
- Haack, B.N.; Khatiwada, G. Rice and bricks: Environmental issues and mapping of the unusual crop rotation pattern in the Kathmandu Valley, Nepal. Environ. Manag. 2007, 39, 774–782. [Google Scholar] [CrossRef]
- Biswas, D.; Gurley, E.S.; Rutherford, S.; Luby, S.P. The Drivers and Impacts of Selling Soil for Brick Making in Bangladesh. Environ. Manag. 2018, 62, 792–802. [Google Scholar] [CrossRef] [Green Version]
- Singh, A.L.; Asgher, M.S. Impact of brick kilns on land use/landcover changes around Aligarh city, India. Habitat Int. 2005, 29, 591–602. [Google Scholar] [CrossRef]
- Nath, A.J.; Lal, R.; Das, A.K. Fired Bricks: CO2 Emission and Food Insecurity. Glob. Chall. 2018, 2, 1700115. [Google Scholar] [CrossRef] [Green Version]
- Vaidya, V.G.; Mamulwar, M.S.; Ray, S.B.; Beena, R.; Bhathlawande, P.V.; Ubale, S. Occupational health hazards of women working in brick kiln and construction industry. J. Krishna Inst. Med Sci. Univ. 2015, 4, 45–54. [Google Scholar]
- Khan, M.W.; Ali, Y.; De Felice, F.; Salman, A.; Petrillo, A. Impact of brick kilns industry on environment and human health in Pakistan. Sci. Total. Environ. 2019, 678, 383–389. [Google Scholar] [CrossRef]
- Eil, A.; Li, J.; Baral, P.; Saikawa, E. Dirty Stacks, High Stakes; Technical Report; World Bank: Washington, DC, USA, 2020. [Google Scholar]
- Boyd, D.S.; Jackson, B.; Wardlaw, J.; Foody, G.M.; Marsh, S.; Bales, K. Slavery from Space: Demonstrating the role for satellite remote sensing to inform evidence-based action related to UN SDG number 8. ISPRS J. Photogramm. Remote. Sens. 2018, 142, 380–388. [Google Scholar] [CrossRef]
- Foody, G.M.; Ling, F.; Boyd, D.S.; Li, X.; Wardlaw, J. Earth observation and machine learning to meet Sustainable Development Goal 8.7: Mapping sites associated with slavery from space. Remote. Sens. 2019, 11, 266. [Google Scholar] [CrossRef] [Green Version]
- CPCB. IPC-V (SSI)/Brick Kiln/2017; Technical Report; CPCB (Central Pollution Control Board): New Delhi, India, 2017. [Google Scholar]
- Kurokawa, J.; Ohara, T.; Morikawa, T.; Hanayama, S.; Janssens-Maenhout, G.; Fukui, T.; Kawashima, K.; Akimoto, H. Emissions of air pollutants and greenhouse gases over Asian regions during 2000–2008: Regional Emission inventory in ASia (REAS) version 2. Atmos. Chem. Phys. 2013, 13, 11019–11058. [Google Scholar] [CrossRef] [Green Version]
- Kurokawa, J.; Ohara, T. Long-term historical trends in air pollutant emissions in Asia: Regional Emission inventory in ASia (REAS) version 3.1. Atmos. Chem. Phys. Discuss 2019. [Google Scholar] [CrossRef] [Green Version]
- Zhong, M.; Saikawa, E.; Avramov, A.; Chen, C.; Sun, B.; Ye, W.; Keene, W.C.; Yokelson, R.J.; Jayarathne, T.; Stone, E.A.; et al. Nepal Ambient Monitoring and Source Testing Experiment (NAMaSTE): Emissions of particulate matter and sulfur dioxide from vehicles and brick kilns and their impacts on air quality in the Kathmandu Valley, Nepal. Atmos. Chem. Phys. 2019, 19, 8209–8228. [Google Scholar] [CrossRef] [Green Version]
- Bian, F.; Xie, Y. Geo-informatics in resource management and sustainable ecosystem: Third International Conference, GRMSE 2015 Wuhan, China, October 16–18, 2015 revised selected papers. Commun. Comput. Inf. Sci. 2016, 569, 938–945. [Google Scholar] [CrossRef]
- Nazir, U.; Mian, U.; Sohail, M.; Taj, M.; Uppal, M. Kiln-Net: A Gated Neural Network for Detection of Brick Kilns in South Asia. IEEE J. Sel. Top. Appl. Earth Obs. Remote. Sens. 2020. [Google Scholar] [CrossRef]
- Gorelick, N.; Hancher, M.; Dixon, M.; Ilyushchenko, S.; Thau, D.; Moore, R. Google Earth Engine: Planetary-scale geospatial analysis for everyone. Remote. Sens. Environ. 2017, 202, 18–27. [Google Scholar] [CrossRef]
- Earth Obervation Research Center JAXA. ALOS Global Digital Surface Model “ALOS World 3D -30 m (AW3D30)”. Available online: https://www.aw3d.jp/en/products/standard/ (accessed on 19 July 2020).
- Misra, P.; Avtar, R.; Takeuchi, W. Comparison of Digital Building Height Models Extracted from AW3D, TanDEM-X, ASTER, and SRTM Digital Surface Models over Yangon City. Remote Sens. 2018, 10, 2008. [Google Scholar] [CrossRef] [Green Version]
- Hijmans, R. Global Administrative Areas. Available online: https://gadm.org/ (accessed on 19 July 2020).
- Pant, P.; Shukla, A.; Kohl, S.D.; Chow, J.C.; Watson, J.G.; Harrison, R.M. Characterization of ambient PM2.5 at a pollution hotspot in New Delhi, India and inference of sources. Atmos. Environ. 2015, 109, 178–189. [Google Scholar] [CrossRef]
- Deng, J.; Dong, W.; Socher, R.; Li, L.J.; Li, K.; Fei-Fei, L. ImageNet: A large-scale hierarchical image database. In Proceedings of the 2009 IEEE Conference on Computer Vision and Pattern Recognition, Miami, FL, USA, 20–25 June 2009; Volume 20, pp. 248–255. [Google Scholar] [CrossRef] [Green Version]
- Simonyan, K.; Zisserman, A. Very Deep Convolutional Networks for Large-Scale Image Recognition. arXiv 2014, arXiv:1409.1556. [Google Scholar]
- He, K.; Zhang, X.; Ren, S.; Sun, J. Deep residual learning for image recognition. arXiv 2016, arXiv:1512.03385. [Google Scholar] [CrossRef] [Green Version]
- Zhang, D.; Liu, J.; Heng, W.; Ren, K.; Song, J. Transfer Learning with Convolutional Neural Networks for SAR Ship Recognition. IOP Conf. Ser. Mater. Sci. Eng. 2018, 322. [Google Scholar] [CrossRef]
- Wang, Y.; Wang, C.; Zhang, H. Ship classification in high-resolution SAR images using deep learning of small datasets. Sensors 2018, 18, 2929. [Google Scholar] [CrossRef] [Green Version]
- Chen, Z.; Zhang, T.; Ouyang, C. End-to-end airplane detection using transfer learning in remote sensing images. Remote Sens. 2018, 10, 139. [Google Scholar] [CrossRef] [Green Version]
- Wurm, M.; Stark, T.; Zhu, X.X.; Weigand, M.; Taubenböck, H. Semantic segmentation of slums in satellite images using transfer learning on fully convolutional neural networks. ISPRS J. Photogramm. Remote. Sens. 2019, 150, 59–69. [Google Scholar] [CrossRef]
- Verma, D.; Jana, A.; Ramamritham, K. Transfer learning approach to map urban slums using high and medium resolution satellite imagery. Habitat Int. 2019, 88, 101981. [Google Scholar] [CrossRef]
- Chollet, F. Keras: The Python Deep Learning library. Available online: https://keras.io (accessed on 19 July 2020).
- Abadi, M.; Barham, P.; Chen, J.; Chen, Z.; Davis, A.; Dean, J.; Devin, M.; Ghemawat, S.; Irving, G.; Isard, M.; et al. TensorFlow: A system for large-scale machine learning. arXiv 2016, arXiv:1605.08695. [Google Scholar]
- Belgiu, M.; Drăgu, L. Random forest in remote sensing: A review of applications and future directions. ISPRS J. Photogramm. Remote. Sens. 2016, 114, 24–31. [Google Scholar] [CrossRef]
- Malisiewicz, T.; Gupta, A.; Efros, A.A. Ensemble of exemplar-SVMs for object detection and beyond. In Proceedings of the IEEE International Conference on Computer Vision, Barcelona, Spain, 6–13 November 2011. [Google Scholar] [CrossRef] [Green Version]


| Predicted True | Predicted False | Recall | |
|---|---|---|---|
| Actual true | 221 | 61 | 0.72 |
| Actual false | 2 | - | |
| Precision | 0.99 | F1 score: 0.83 |
© 2020 by the authors. Licensee MDPI, Basel, Switzerland. This article is an open access article distributed under the terms and conditions of the Creative Commons Attribution (CC BY) license (http://creativecommons.org/licenses/by/4.0/).
Share and Cite
Misra, P.; Imasu, R.; Hayashida, S.; Arbain, A.A.; Avtar, R.; Takeuchi, W. Mapping Brick Kilns to Support Environmental Impact Studies around Delhi Using Sentinel-2. ISPRS Int. J. Geo-Inf. 2020, 9, 544. https://0-doi-org.brum.beds.ac.uk/10.3390/ijgi9090544
Misra P, Imasu R, Hayashida S, Arbain AA, Avtar R, Takeuchi W. Mapping Brick Kilns to Support Environmental Impact Studies around Delhi Using Sentinel-2. ISPRS International Journal of Geo-Information. 2020; 9(9):544. https://0-doi-org.brum.beds.ac.uk/10.3390/ijgi9090544
Chicago/Turabian StyleMisra, Prakhar, Ryoichi Imasu, Sachiko Hayashida, Ardhi Adhary Arbain, Ram Avtar, and Wataru Takeuchi. 2020. "Mapping Brick Kilns to Support Environmental Impact Studies around Delhi Using Sentinel-2" ISPRS International Journal of Geo-Information 9, no. 9: 544. https://0-doi-org.brum.beds.ac.uk/10.3390/ijgi9090544