Impact of Climate Change on Crop Production and Potential Adaptive Measures in the Olifants Catchment, South Africa


Department of Geography, Geo-informatics and Meteorology, University of Pretoria, Private Bag x 20, Hatfield 0028, South Africa
*
Author to whom correspondence should be addressed.
Climate 2021, 9(1), 6; https://0-doi-org.brum.beds.ac.uk/10.3390/cli9010006
Submission received: 20 October 2020
/
Revised: 23 November 2020
/
Accepted: 28 December 2020
/
Published: 31 December 2020
(This article belongs to the Special Issue Climate Change and Food Insecurity)
Abstract
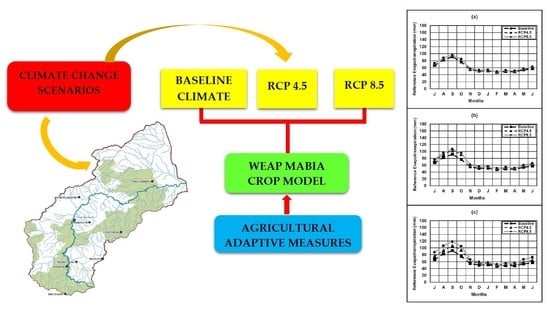
:Climate change is expected to substantially reduce future crop yields in South Africa, thus affecting food security and livelihood. Adaptation strategies need to be implemented to mitigate the effect of climate change-induced yield losses. In this paper, we used the WEAP-MABIA model, driven by six CORDEX climate change data for representative concentration pathways (RCPs) 4.5 and 8.5, to quantify the effect of climate change on several key crops, namely maize, soya beans, dry beans, and sunflower, in the Olifants catchment. The study further investigated climate change adaptation such as the effects of changing planting dates with the application of full irrigation, rainwater harvesting, deficit irrigation method, and the application of efficient irrigation devices on reducing the impact of climate change on crop production. The results show that average monthly temperature is expected to increase by 1 °C to 5 °C while a reduction in precipitation ranging between 2.5% to 58.7% is projected for both RCP 4.5 and RCP 8.5 relative to the baseline climate for 1976–2005, respectively. The results also reveal that increased temperature and decreased precipitation during planting seasons are expected to increase crop water requirements. A steady decline in crop yield ranging between 19–65%, 11–38%, 16–42%, and 5–30% for maize, soya beans, dry beans, and sunflower, respectively, is also projected under both RCPs climate change scenarios. The study concludes that adaptation measures such as the integration of changing planting dates with full irrigation application and the use of rainwater harvest will help improve current and future crop production under the impact of climate change.
1. Introduction
Increased greenhouse gas emission caused by human-induced activities such as the burning of fossil fuels and deforestation has accelerated the impacts of climate change in the 20th century. Recently, the intergovernmental panel on climate change report [1] indicated that natural and human systems have been significantly impacted by increased temperature, and increased frequencies of extreme weather events such as droughts and floods that are caused by changes in the climate system. The impacts of climate change on agriculture can no longer be ignored as agricultural production is largely dependent on the amount of water available and dry-land farmers who rely on rain-fed farming for their livelihood are particularly vulnerable [2]. Climate change impacts on agriculture resulting in the decline in crop yield may increase food insecurity globally [3,4]. This is largely because agricultural crops relevant to food security such as maize, wheat, and rice require significant amounts of water for production [5]. The amount of water required to produce 1 kg of these crops is estimated at 1.5 m3, 1.0 m3, and 2.5 m3 respectively [6]. It is therefore anticipated that areas with limited water availability due to climate change impacts will experience significant crop yield losses which would compromise food security in the long term.
Climate change impacts on agricultural production are increasingly becoming a major area of scientific interest [7]. Such impacts are significant in arid and semi-arid areas which include a country like South Africa, a semi-arid country, with about two-thirds of its land area receiving a mean annual rainfall of less than 500 mm [8] during the summer months over the eastern parts of the country [8], where most of the agricultural activity takes place. The share of agriculture in the country’s gross domestic product (GDP) is barely 4 percent [9]. However, despite this seemingly negligible contribution towards the country’s economy, the agricultural sector accounts for almost 10 percent of the total employment in the country and about one-third of the country’s total crop production is exported with considerable financial returns [10]. In addition, more than a million people in the country are indirectly dependent on the agricultural sector for their livelihood [11] and 94 percent of the agricultural products such as wheat, maize, and rice are consumed within the country [12]. The strategic importance of the agricultural sector in South Africa is therefore evident.
Increased rainfall variability and high temperatures are currently the key factors expected to have significant impacts on agricultural production in South Africa [8,13]. For instance, climate projection studies have illustrated that the frequency and intensity of droughts coupled with higher variability in rainfall will have negative implications on crop production [1]. A study undertaken by Erasmus et al. [14], projected a decline in precipitation in the Western Cape Province which they predicted would result in less water available for agriculture with related socio-economic impacts for farmers in the area. The anticipated increase in temperature of 1.2 °C in 2020, 2.4 °C in 2050, and 4.2 °C by the year 2080 and a projected rainfall decrease of about 5–10% in the next 50 years [8], thus presents a significant risk to South Africa’s food security and socio-economic stability. Considering the socio-economic importance of agriculture and food security, it is therefore imperative to assess how future climate change will affect crop yield. Adaptation is an important factor that will minimize the severity of the impact of climate change on future crop production [15,16]. Potential adaptation strategies should thus be developed and consistently evaluated to effectively cope with climate risk.
Numerous studies have assessed the impact of climate change on crop production in South Africa [17,18,19,20,21,22], their findings indicate a decrease in crop yield as a result of a changing climate. Mayowa [23] examined the impact of climate variability on maize yield in South Africa using satellite-derived data and a neutral framework. The result of the study indicated that maize phenology could be impacted by climate variability, especially if the impacts are most severely experienced during the vegetative and reproductive period of plants. Studies by Gbetibouo and Hassan [24] and Deraasa et al. [25] used the Ricardian model to investigate the economic impact of climate change on major South African field crops and found that the production of field crops was more sensitive to changes in marginal temperature as compared to changes in precipitation. Results from their study implied that an increase in temperature somehow positively affected net revenue whereas the effect of precipitation decrease was negative. The study went further to highlight the importance of season and location in dealing with climate change, indicating that the spatial distribution of climate change impact and consequently the needed adaptation strategies vary across the different agro-ecological regions of South Africa.
Despite the fairly extensive research undertaken towards assessing the potential impacts of climate change on crop production in South Africa, to date, no study has evaluated the efficiency of adaptation strategies in order to provide farmers and decision-makers with clear guidance on the best practices to be implemented. Further, many of the existing studies were either conducted at a national, regional, or provincial level which fails to capture climate change-related dynamics and its implications at a catchment level. It is important to understand how climate change affects crop production at a catchment scale since vulnerability and the intensity of climate change are location-specific and the formulation of adaptation strategies depends on the level of impacts. Specifically, the assessment of climate change and adaptive measures in terms of crop production have not been investigated in the Olifants catchment where crop yield could be more sensitive to climate change due to the vulnerability of the catchment to global change.
This study, therefore, aims to assess the potential impact of climate change on crop yield in the Olifants catchment using a high-resolution climate change model and it evaluates the efficiency of the adaptive strategies deployed by farmers to improve crop yield under current and future climate change scenarios for the catchment. The specific objectives of this study are: (1) to evaluate the impacts of climate change on the catchment reference evapotranspiration and crop water requirement; (2) to assess the influence of soil texture on crop yield under current climate condition; (3) to evaluate the impact of current and projected climate change on crop yield, and lastly, (4) to assess crop yield response to different adaptation measures in the context of changing climate.
The findings from this study are intended to provide relevant information on the expected changes in climate and its impact on crop yield at a catchment-scale as well as to guide policy-makers on the most suitable adaptation options to be implemented in order to improve future crop production and ensure food security.
2. Materials and Methods
2.1. Study Area and Data
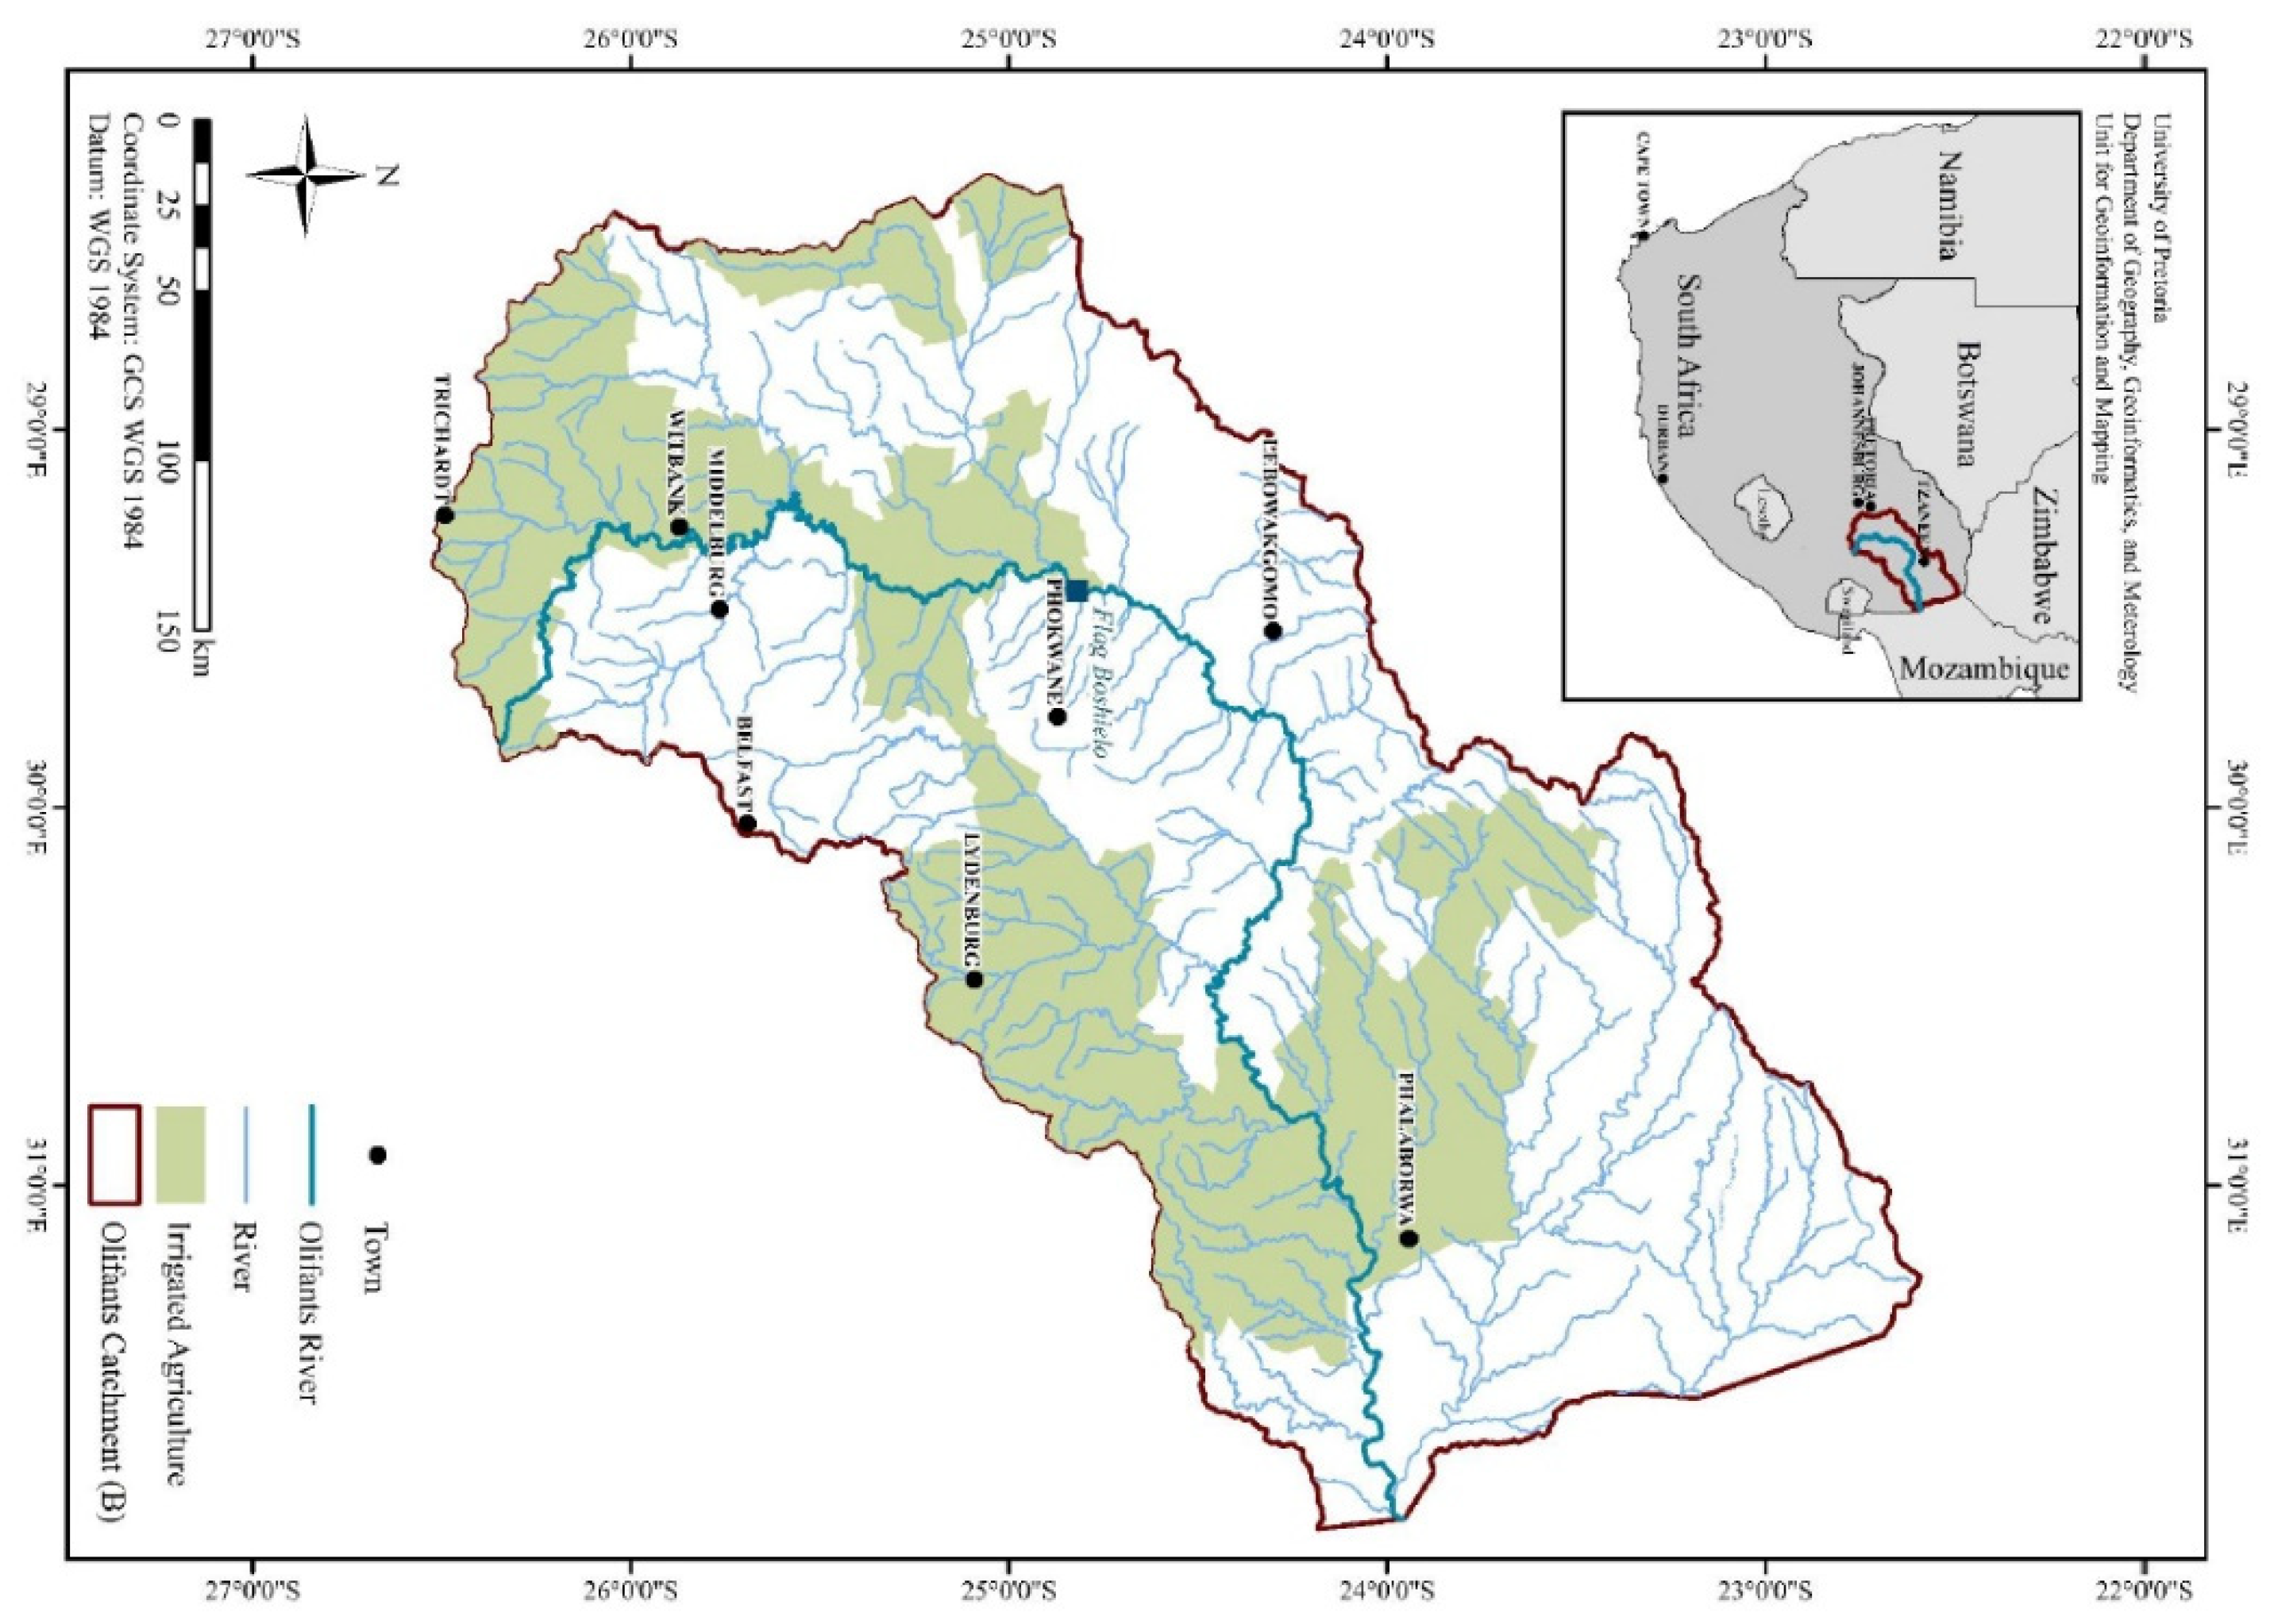
The Olifants River Basin is one of the nineteen water management areas in South Africa. It is a principal sub-catchment of the Limpopo River. It originates in the north of South Africa in the province of Mpumalanga and flows northeast through the northern province before joining in Mozambique and emptying into the Indian Ocean (Figure 1). An estimated 3.2 million people live within the catchment area with two-thirds of this population living in the rural community [26]. The Olifants River Basin is recognized as one of the most important basins in South Africa as it contributes largely to the country’s economic hub, with an annual contribution of six percent to the Gross Domestic Product arising from agricultural, mining, and industrial activities [27]. The catchment consists of both large and medium-scale agricultural farms that consume a lot of water for irrigation (540 Mm3 per year) with approximately 130,000 ha irrigated (i.e., 11% of the total cultivated area in the catchment), primarily in the commercial farming sector. The water used for irrigation is obtained from both dams and groundwater in the catchment [28]. Precipitation in the catchment occurs during the summer months from October to April, with average annual rainfall ranging between 500 mm to 800 mm in most parts of the catchment and surpasses 1000 mm along the escarpment which separates the Highveld from the Lowveld. Evaporation varies across the catchment with high levels occurring in the north and west, and lower levels of evaporation recorded in the southeast. Elevations range from 300 m to over 2300 m above sea level, which explains the relatively cool winter and annual wide-range of temperature variations of −4 to 35 °C [29]. Runoff from the catchment reflects the temporal and spatial distribution of the rainfall with the greatest volumes occurring in the south and along the escarpment. The average annual runoff from the catchment is 37.5 mm (i.e., 6% of the average annual rainfall), which equates to 2040 million cubic meters (Mm3). However, there is considerable inter-annual variation and consecutive years where the flow is below the mean annual discharge [30].
This study uses climate simulated data (daily rainfall, minimum, and maximum temperature, average relative humidity, 2 m wind speed, and solar radiation) from the Coordinated Regional Climate Downscaling Experiment (CORDEX) database. The data were obtained from http://cordexesg.dmi.dk/esgf-web-fe/. The output from CORDEX RCMs are quality controlled and can be used according to the terms of use (http://wcrp-cordex.ipsl.jussieu.fr/). It should be noted that all Coordinated Regional Downscaling Experiment-Regional Climate Models (CORDEX RCMs) are set to 0.44° by 0.44°spatial resolutions, which corresponds to 50 km by 50 km. The area-weighted average method [31] was used to calculate the average climate variables from the CORDEX RCMs over the entire Olifants River catchment (latitude 24° and 26° and longitude 29° and 32°). Daily climate variables listed above were obtained from a single RCM driven by six Global Climate Models (GCMs) namely, Commonwealth Scientific and Industrial (CSIRO), National Centre for Meteorological Research (CNRM), Canadian Centre for Modelling and Analysis (CCMA), Institut Pierre Simon Laplace (IPSL), Model for Interdisciplinary Research on Climate (MIROC), and Max Planck institute for Meteorological Earth System Model (MPI-ESM) for a period of 30 years (1976–2005). Two projected climate change scenarios, representative concentration pathways (RCP 4.5 and 8.5) were used. The former represents an intermediate stabilization of radioactive forcing by 2100, without surpassing 4.5 W/m2 (~650 ppm CO2), which constitutes a high mitigation scenario [32]. Whilst the RCP 8.5 scenario assumes that the radioactive forcing pathway reaches above 8.5 W/m2 (~1370 ppm CO2) by 2100 [33].
Using CORDEX-RCM climate change data, three time periods 2010–2039, 2040–2069, 2070–2099 were considered in this study to project future climate for both greenhouse gas concentration scenarios. These time periods were then compared to the baseline period, 1976–2005. CORDEX climate variables were biased corrected using a linear scaling bias correction method. Observed climate variables obtained from the South African weather service were used to bias correct the current and projected CORDEX climate data [34]. It was necessary to bias correct the simulated climate data in order to compensate for any over or underestimation of the downscaled variables. The linear scaling bias correction is based on the average difference between daily observed time series data. These differences were then applied to the simulated climate data to obtain bias-corrected variables [34]. The biased-corrected climate variables were then integrated into a decision support system (Water Evaluation and Planning) model to evaluate current and future crop yield and adaptation scenarios using the WEAP-MABIA method.
The WEAP-MABIA model used in this study has a soil profile library functionality that provides typical values for water content at saturation, field capacity, wilting point, and the available water capacity for 12 textural classes. It uses a pedotransfer function to estimate the average soil water capacity. In this study, we assumed scenarios of three textural classes of soil to evaluate its impacts on crop yield under current climate conditions. The three textural classes of soil were (S1-sandy loam, S2-loamy sand, and S3-Sandy clay loam) presented in Table 1.
Crop parameters were also obtained from the crop library functionality within the WEAP-MABIA. The “Crop Library” provides the required parameters for over 100 crops, some with multiple entries for different climates or regions of the world. The end-user can add, edit, remove, copy, export, import, or search the “Crop Library” for a particular crop. This study selected four crops namely: maize, soya beans, dry beans, and sunflower from the crop library using the crop scheduling wizard. The crop parameter used in this study is presented in Table 2.
The lengths of growth stages (Lini, Ldev, Lmid, Llate) were computed according to the FAO-56 method as a function of vegetation cover (fc). The initial stage (Lini) runs from the sowing date to when the fc reaches a value of 0.1, the development stage (Ldev) runs from a fc of 0.1 to full vegetation cover (fc of 0.9). The mid-season stage (Lmid) runs from the end of the development stage until canopy cover (fc) drops back to the same value it had at the end of the development stage and the beginning of the mid-season period (fc = 0.9). The late-season stage (Llate) runs from the end of the mid-season stage until the end of the growing season.
The basal crop coefficient (Kcb) is defined as the ratio of the crop evapotranspiration ETc over the reference evapotranspiration ETref when the soil surface is dry but transpiration is occurring at a potential rate. Therefore, Kcb represents primarily the transpiration component of ETc. The Kcb coefficient serves as a lumped parameter for the physical and physiological differences between crops. Variation in Kcb between the growth stages is mainly dependent on how the crop canopy develops. The values given in the “crop library” represent a standard climate having mean daily minimum relative humidity (RHmin) equal to 45% and mean daily wind speed measured at 2 m (u2) equal to 2 m s−1.
The depletion factor (p) is the fraction of the total available water (TAW) that can be depleted from the root zone before moisture stress occurs. Different values can be defined to express the variation of the crop sensitivity to water shortage over the different crop stages.
The yield response factor (Ky) is a factor that describes the reduction in relative yield according to the reduction in the crop evapotranspiration (ETc) caused by soil water shortage. Ky values are crop-specific and may vary over the growing season. The values for Ky are given for the individual growth periods as well as for the complete growing season.
The rooting depth for annual crops has three growth stages. The rooting depth is held constant at the minimum depth (Zr min) throughout the initial crop growth stage. The root zone increases linearly to a maximum depth (Zr max) throughout the vegetative growth and development stages
The maximum root depth is attained at the beginning of the mid-season stage (peak growth) and is maintained throughout the mid and late season stage [35].
2.2. Description of WEAP Model
The water evaluation and planning model developed by the Stockholm Environment Institute (SEI) is a decision support system (DSS) used for the integration of water resources management and planning. It is easy to use for water planning and scenario assessment. WEAP simulates water balance for water demand, supply, and storage on a monthly basis and it allows the assessment of water resource management policies between different sectors (agriculture, industry, tourism). It can be applied at a catchment level as well as other more complex levels such as regional and country levels [36].
Within the WEAP model, different agricultural catchment calculation methods can be used. In this study, we used the WEAP-MABIA method version 1.0.1 [35] to simulate crop water requirement, crop yield as well as agricultural management plans under different climate conditions. The selection of this method was based on the fact that it has been applied by scientists, engineers, and resource managers to simulate runoffs, infiltration, and percolation processes resulting from natural rainfall, irrigation scheduling, and crop yield reduction [35,37,38,39]. The WEAP-MABIA method calculate evapotranspiration using the ‘dual’ crop coefficient kc method (Kc = Ke + Ks Kcb), as described in Allen et al. [40], whereby the Kc value is divided into a ‘basal’ crop coefficient, Kcb, and a separate component, with Ke, representing evaporation from a shallow soil surface layer. The basal crop coefficient represents actual ET conditions when the soil surface is dry but sufficient root zone moisture is present to support full transpiration.
The reference evapotranspiration (ET0) for the Olifants catchment was calculated using the modified Penman-Monteith equation recommended by Allen et al. [40]. The equation utilizes some assumed constant parameters for a clipped grass reference crop. It was assumed that the definition for the reference crop was a hypothetical reference crop with a crop height of 0.12 m, a fixed surface resistance of 70 s m−1 and an albedo value (i.e., a portion of light reflected by the leaf surface) of 0.23 [41]. The equation used for calculating ET0 is given below:
where RN is the net radiation at the crop surface, G is the soil heat flux density, T represents the mean daily air temperature at 2 m height, U2 is the wind speed at 2 m height, es is the saturation vapor pressure, ea is the actual vapor pressure, (es–ea) represents the vapor pressure deficit of the air, Δ is the slope vapor pressure curve, and γ represents the psychometric constant.
The following climate parameters such as daily temperature (minimum and maximum), average relative humidity, 2-m wind speed, and solar radiation were used to estimate the current and projected reference crop evapotranspiration.
The performance of the WEAP-MABIA was verified by calibrating and validating observed crop yield data for Mpumalanga province where the Olifants catchment is situated, as there was no recorded crop data for the catchment. The data was obtained from the Department of Agriculture, Fisheries, and Forestry (DAFF). The efficiency of the model performance was determined by comparing the observed against the simulated crop yield using two verification statistics such as Coefficient of Determination (R2) and Nash-Sutcliffe Efficiency (NSE). The values of R2 ranges between 0–1, values higher than 0.5 are considered acceptable. While NSE ranges between −∞ and 1.0, where NSE = 1 indicates a perfect match of simulated and observed yield. An efficiency of 0 shows that the model prediction is as accurate as the mean of the observed data, while an efficiency less than 0 shows that the observed mean is a better predictor than the model. For more detail on the procedure and statistical equation used for the calibration and validation of the model, readers should consult Olabanji et al. [29]. We calibrated and validated the WEAP-MABIA crop model using observed crop yield data for the period of 1995–2000 for calibration and 2001–2004 for validation. The results presented in Table 3 show that the simulated crop yield perfectly agrees with the observed yield with NSE ranging between 0.97 to 0.99 during calibration and 0.87 to 0.96 during validation. The coefficient of determination (R2) ranged between 0.98 to 1.0 for calibration and 0.95 to 0.98 during the validation process. The agreement between the simulated and observed crop yield indicates the capability of the crop model to simulate future crop yields.
2.3. Experimental Design
We conducted five experiments to assess crop yield response to climate change impacts and adaptation strategies in the Olifants catchment (Figure 2). The adaptation scenarios used for this analysis were derived from a comprehensive literature review [42,43,44,45,46] and augmented with the results from a field survey that was completed by seventy-three smallholder farmers who provided information about the adaptive strategies they are deploying in the area. During the course of the study, four adaptation measures were evaluated using the WEAP-MABIA model.
- Experiment 1, which is the control experiment, presents crop yield under baseline and projected climate scenarios (RCP 4.5 and RCP 8.5) without the implementation of adaptation strategies.
- Experiment 2, presents crop yield with the adoption of a shifting plantation date and the application of full irrigation water. This scenario assumes a delay in the planting of crops. It is expected that crops in the catchment, particularly those investigated in this study, are to be planted from early October to mid-December. However, due to the delay in rainfall, most farmers have adjusted their farming practice by shifting their planting dates to wait for rain. We, therefore, assumed a delay of 25 days from the initial date planted. The strategy also assumed the application of full irrigation to supplement rainfall should there be any shortfall during the cropping cycle. The scenario assumed that irrigation would be applied at 100% of the readily available water. This application implied that soil depletion would never drop below the readily available water level, and as such, water stress is not expected to occur in this scenario.
- Experiment 3, presents crop yield with the application of rainwater harvesting. This scenario assumes the harvesting of rainwater from runoffs during the period of heavy rainfall within the cropping cycle to irrigate crops. This strategy is expected to augment limited irrigation water from the system, it also serves as an agricultural water management measure as it helps to restrain the over-exploitation of freshwater during crop production.
- Experiment 4, presents crop yield with the adoption of the deficit irrigation method. This strategy involves the application of limited water during crop production. The formulation of this strategy is as a result of the increased demand for water resources by other water use sectors which may cause shortages during irrigation for farmers in the near future [29]. According to the findings of Geerts and Raes [47], the deficit irrigation scheme is a promising and tested irrigation technique, especially in periods of low rainfall. The scenario assumes allowing shortage of 50% of the readily available water (RAW) before irrigation.
- Finally, experiment 5 presents crop yield with the use of efficient irrigation devices such as the drip irrigation technique, or the sprinkler and furrow. These devices are deemed more efficient compared to traditional irrigation techniques such as the center pivot system, or the buckets and pipes approach which consumes a lot more water during irrigation. Specifically, for this analysis, the scenario assumes the use of a drip irrigation technique with an application efficiency of 95% to improve crop yield.
The results obtained from experiments 2, 3, 4, and 5 were compared against the control experiment (crop yield without adaptation strategies adopted). The assessment of each experiment enabled us to determine which adaptation measure performed the best in terms of crop productivity.
3. Results
3.1. Climate Model Validation
This section validates the performance of CORDEX-RCM current climate data for the period 1976–2005. Results presented in Figure 3a,b shows that ensemble monthly historical RCM after bias correction mostly agreed with the observed precipitation and temperature in the catchment. The agreement between the simulated RCM climate and the observed indicated that CORDEX-RCM data after bias correction were capable of projecting future climate.
3.2. Future Climate Projections
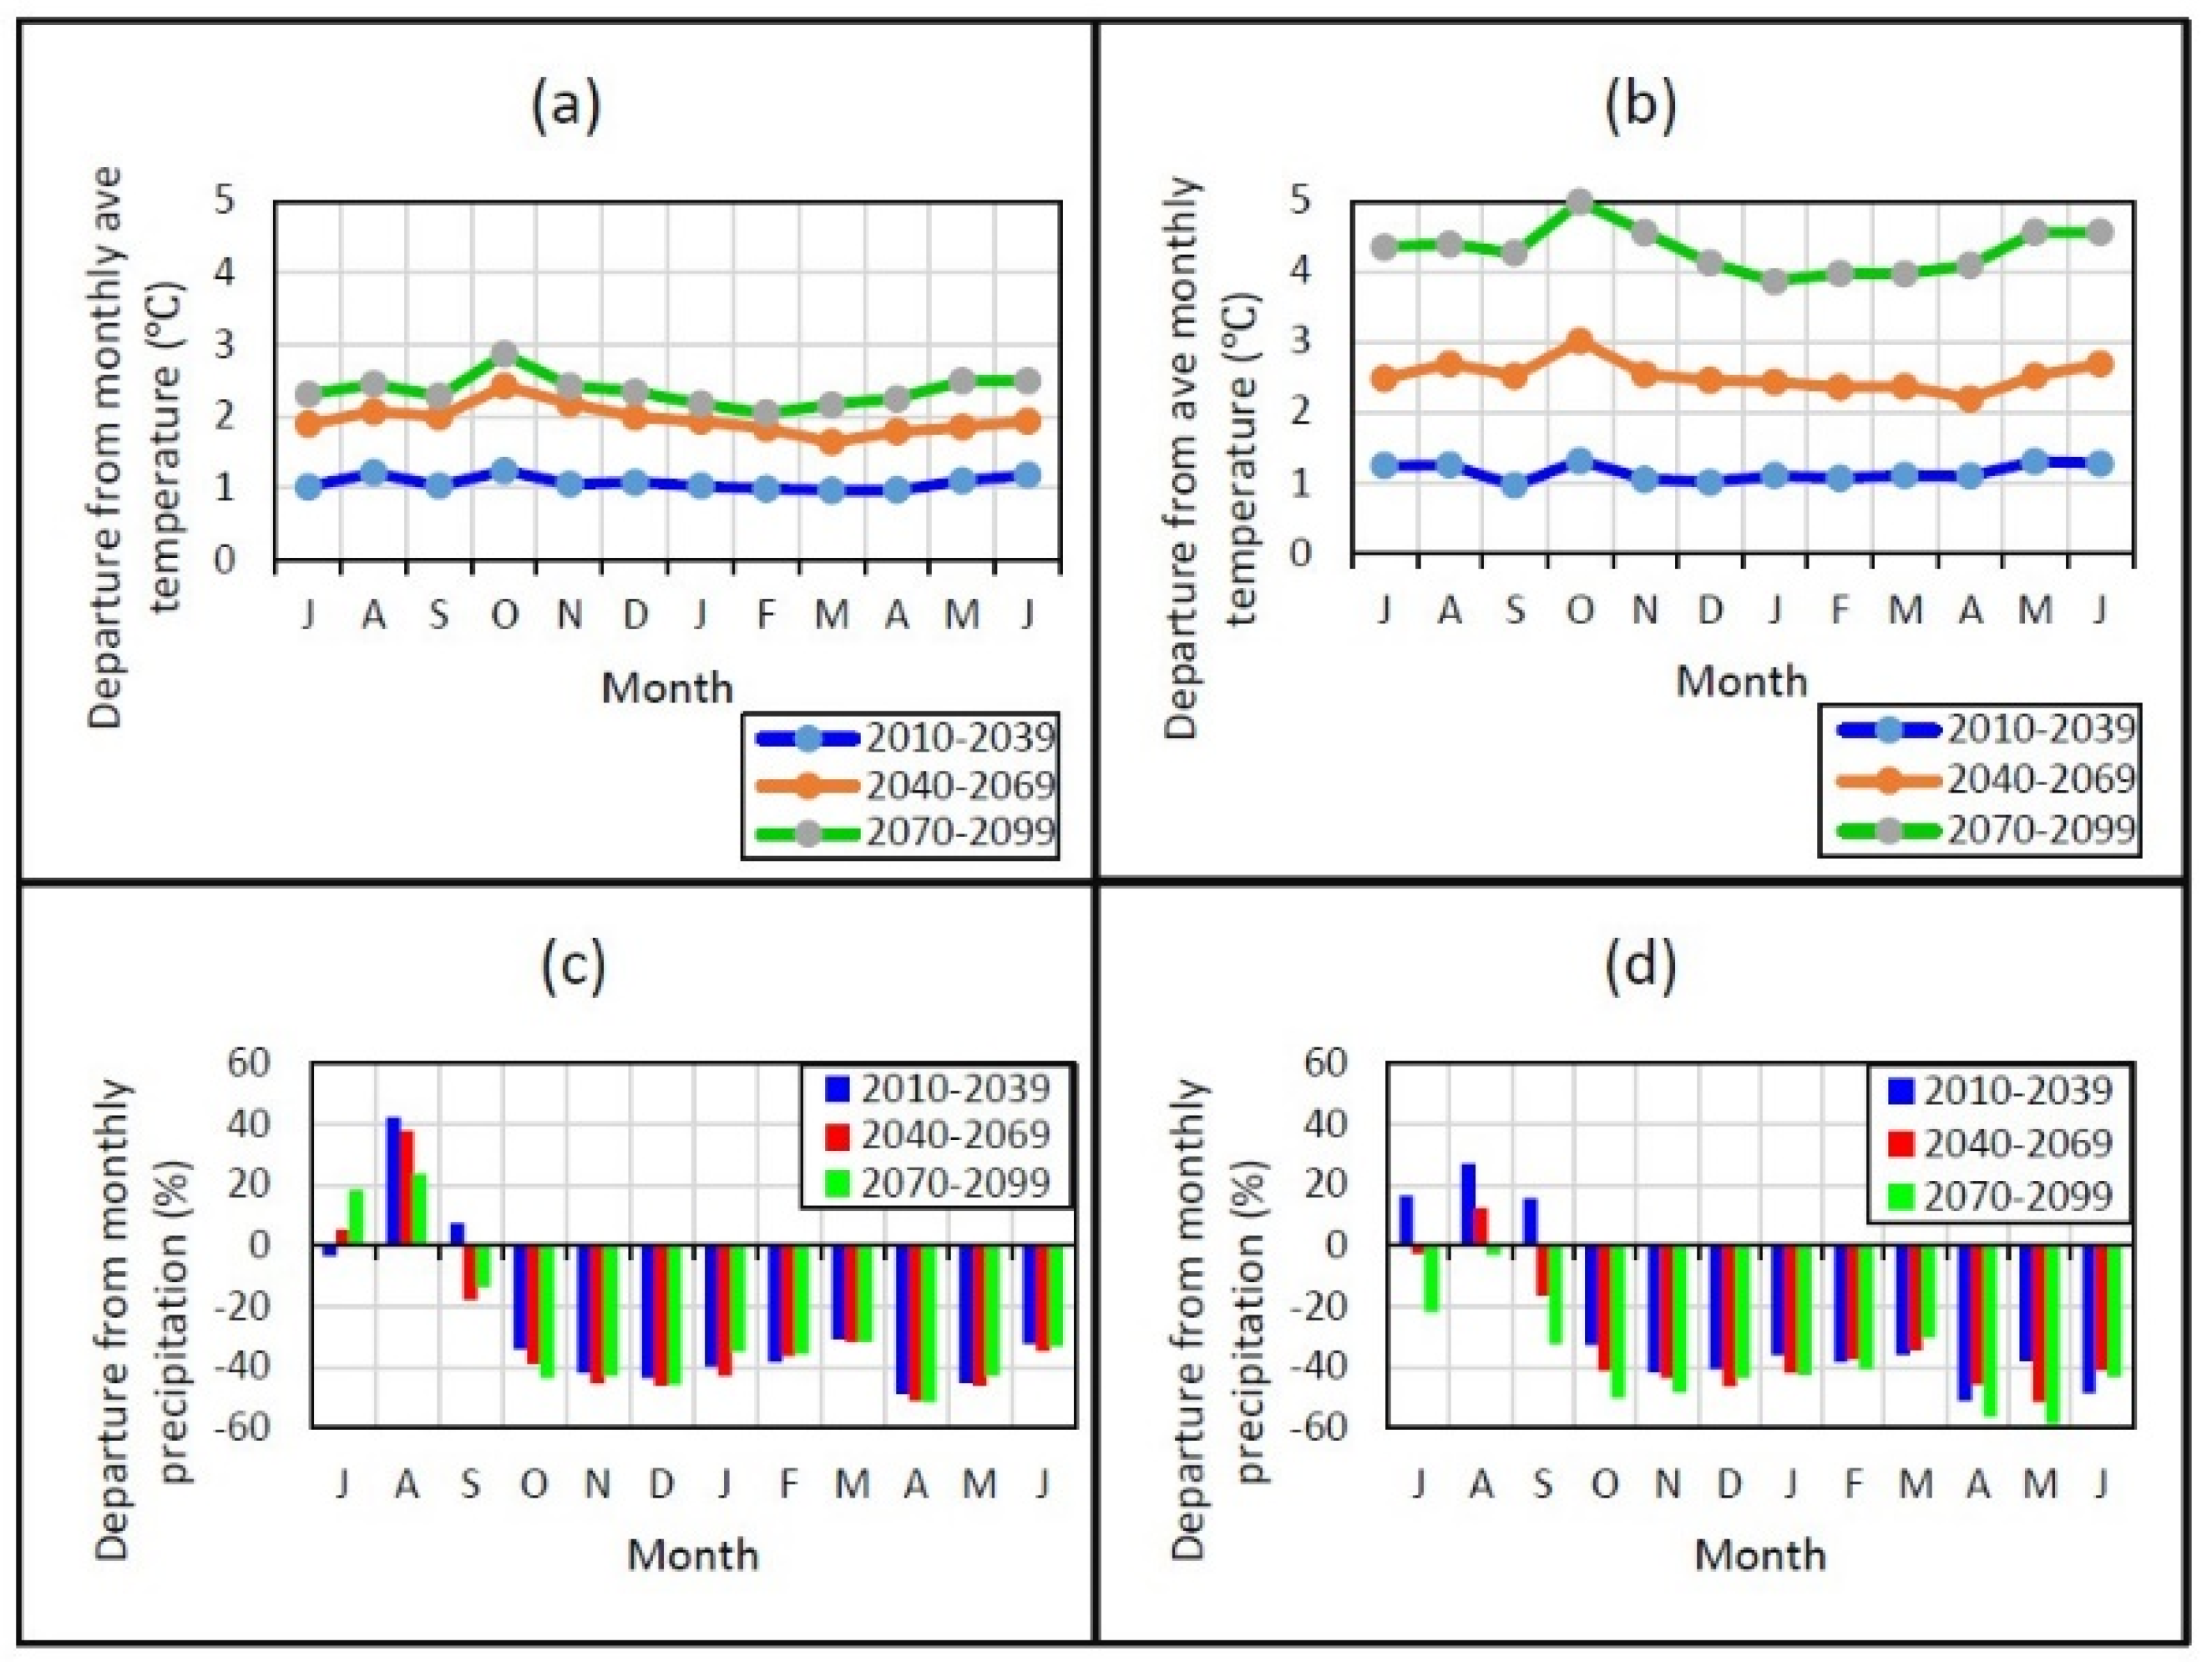
The intra-annual changes in temperature and precipitation for the study area under the two future projected climate change (RCP 4.5 and RCP 8.5) scenarios are presented in Figure 4a–d. From the results obtained, it was clear that elevated CO2 concentration would significantly increase temperatures in the future. The monthly average temperature was projected to increase by 1.0, 1.6, and 2.9 °C for the 2010–2039, 2040–2069, and 2070–2099 periods respectively, for RCP 4.5 scenario relative to baseline. Under the RCP 8.5 scenario, the average monthly temperature increased by 2.3, 3.0, and 5.0 °C for the three future time periods as shown in Figure 4a,b. The highest temperature increase was expected for the RCP 8.5 scenario towards the end of the century. Results further revealed that summer months were likely to experience increased temperature particularly the month of October during the mid and end of the century. In addition, the results presented in Figure 4c,d show the variations in intra-annual predicted precipitation for the Olifants catchment for RCP 4.5 and RCP 8.5 respectively. As indicated in Figure 4c, a slight increase in precipitation for the RCP 4.5 scenario was expected for the early-term in the month of August and September and a decrease was expected for other months. For the mid-term and far-term, an average increase in precipitation was expected for the months of July and August, with the remaining part of the months expected to be dry. A precipitation decline between 3.2 to 51.4% was predicted for RCP4.5 with the mid-term expected to be the driest. The results presented in Figure 4d show a decreasing trend in most of the months in the mid and end-term for the RCP 8.5 climate change scenario. However, a slight increase was projected for the months of July, August, and September in the early term. The end-term was projected to be the driest period for the RCP 8.5 scenario, a decrease in precipitation ranging between 2.5 to 58.7% was anticipated. The summer months of October to February for both climate change scenarios were expected to experience a greater decline in precipitation during the early-term, mid-term, and end-term respectively. Based on the outcome of the climate analysis, the decline in the projected precipitation during the summer months and an increasing trend in temperature will have implications for future crop production, as most of the crops in the catchment are planted during this period.
3.3. Analysis of Reference Crop Evapotranspiration
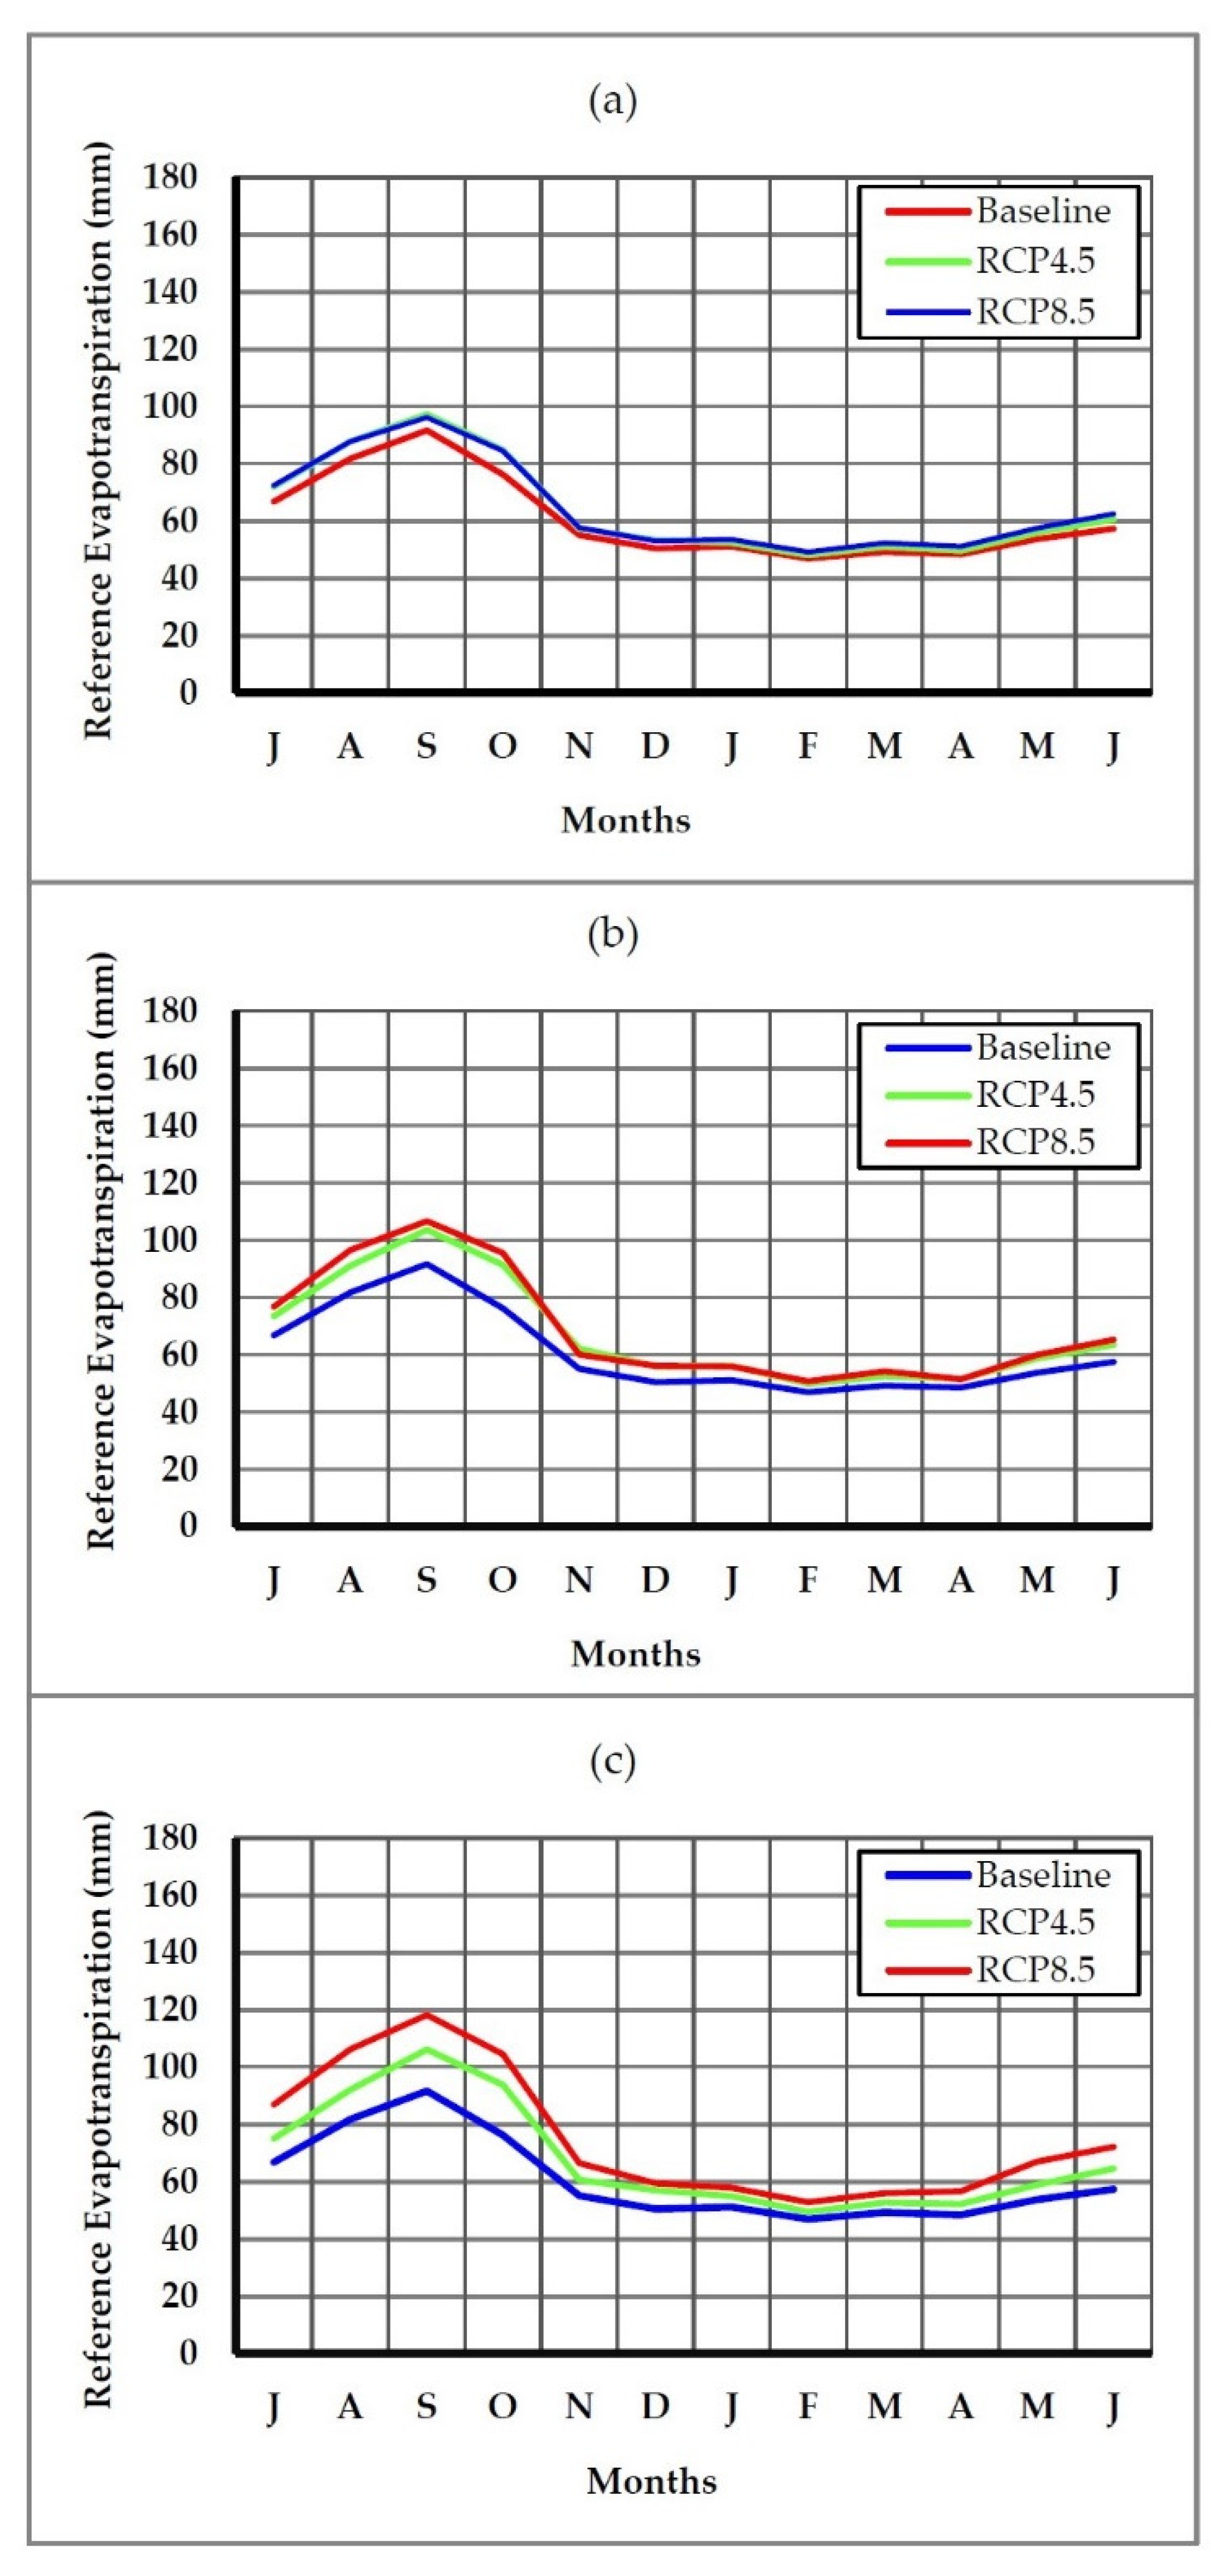
This study estimated reference crop evapotranspiration (ET0) using the Penman-Montieth equation. Projected changes in ET0 were calculated as the difference between the average monthly and annual ET0 for RCP 4.5 and RCP 8.5 relative to baseline (1976–2005). Results from the calculation show an increasing trend in total annual ET0 of 770.9 mm, 810.0 mm, and 817.8 mm for RCP 4.5 and 778.0 mm, 829.3 mm, and 904.5 mm for RCP 8.5 for the early-term, mid-term, and end-term relative to 729.1 mm of baseline climate (1976–2005). The intra-annual ET0 variation indicated a higher increase in the months of September, August, and October while April had the smallest increase for both climate change scenarios as illustrated in Figure 5. The increase in ET0 aligned with the increasing trend in temperature, implying that a change in temperature would have a significant impact on the amount of soil evaporation and crop transpiration.
3.4. Climate Change Impact on Crop Water Requirement
This study assessed the impacts of climate change on crop water requirements by integrating climate parameters into the WEAP-MABIA crop model. Table 4 shows the projected changes in crop water requirements for RCP 4.5 and RCP 8.5 climate change scenarios. Results revealed a steady increase in crop water requirements for both RCPs. Water requirements for maize crops increased from 7.6 × 10⁸ m3 for the baseline climate to 9.1 × 10⁸ m3 and 1.0 × 10⁹ m3, while soya beans increased from 2.2 × 10⁸ m3 to 3.1 × 10⁸ m3 and 3.6 × 10⁸ m3 for RCP 4.5 and RCP 8.5 climate change scenarios. An increase of 1.4 × 10⁸ m3 and 7.3 × 10⁷ m3, 1.6 × 10⁸ m3, and 9.1 × 10⁷ m3 was anticipated for dry beans and sunflower for both RCPs relative to 9.3 × 10⁷ m3 and 4.3 × 10⁷ m3 of baseline climate. Comparing both RCPs, a slight decrease in water requirements for maize and soya beans was expected under RCP 8.5 in the early term, with the highest water requirements for all crops expected towards the end of the century. The increased water requirements for all crops modeled in the WEAP-MABIA crop model is due to the high evapotranspiration rate resulting from an increased temperature and a decline in precipitation. Water stress can only occur when rainfall or irrigation do not meet crop water requirements. Therefore, the simulated results for crop water requirements show that crops in the Olifants catchment will likely face severe water stress in the future which may lead to a decline in crop yield.
3.5. Influence of Soil Texture on Crop Yield
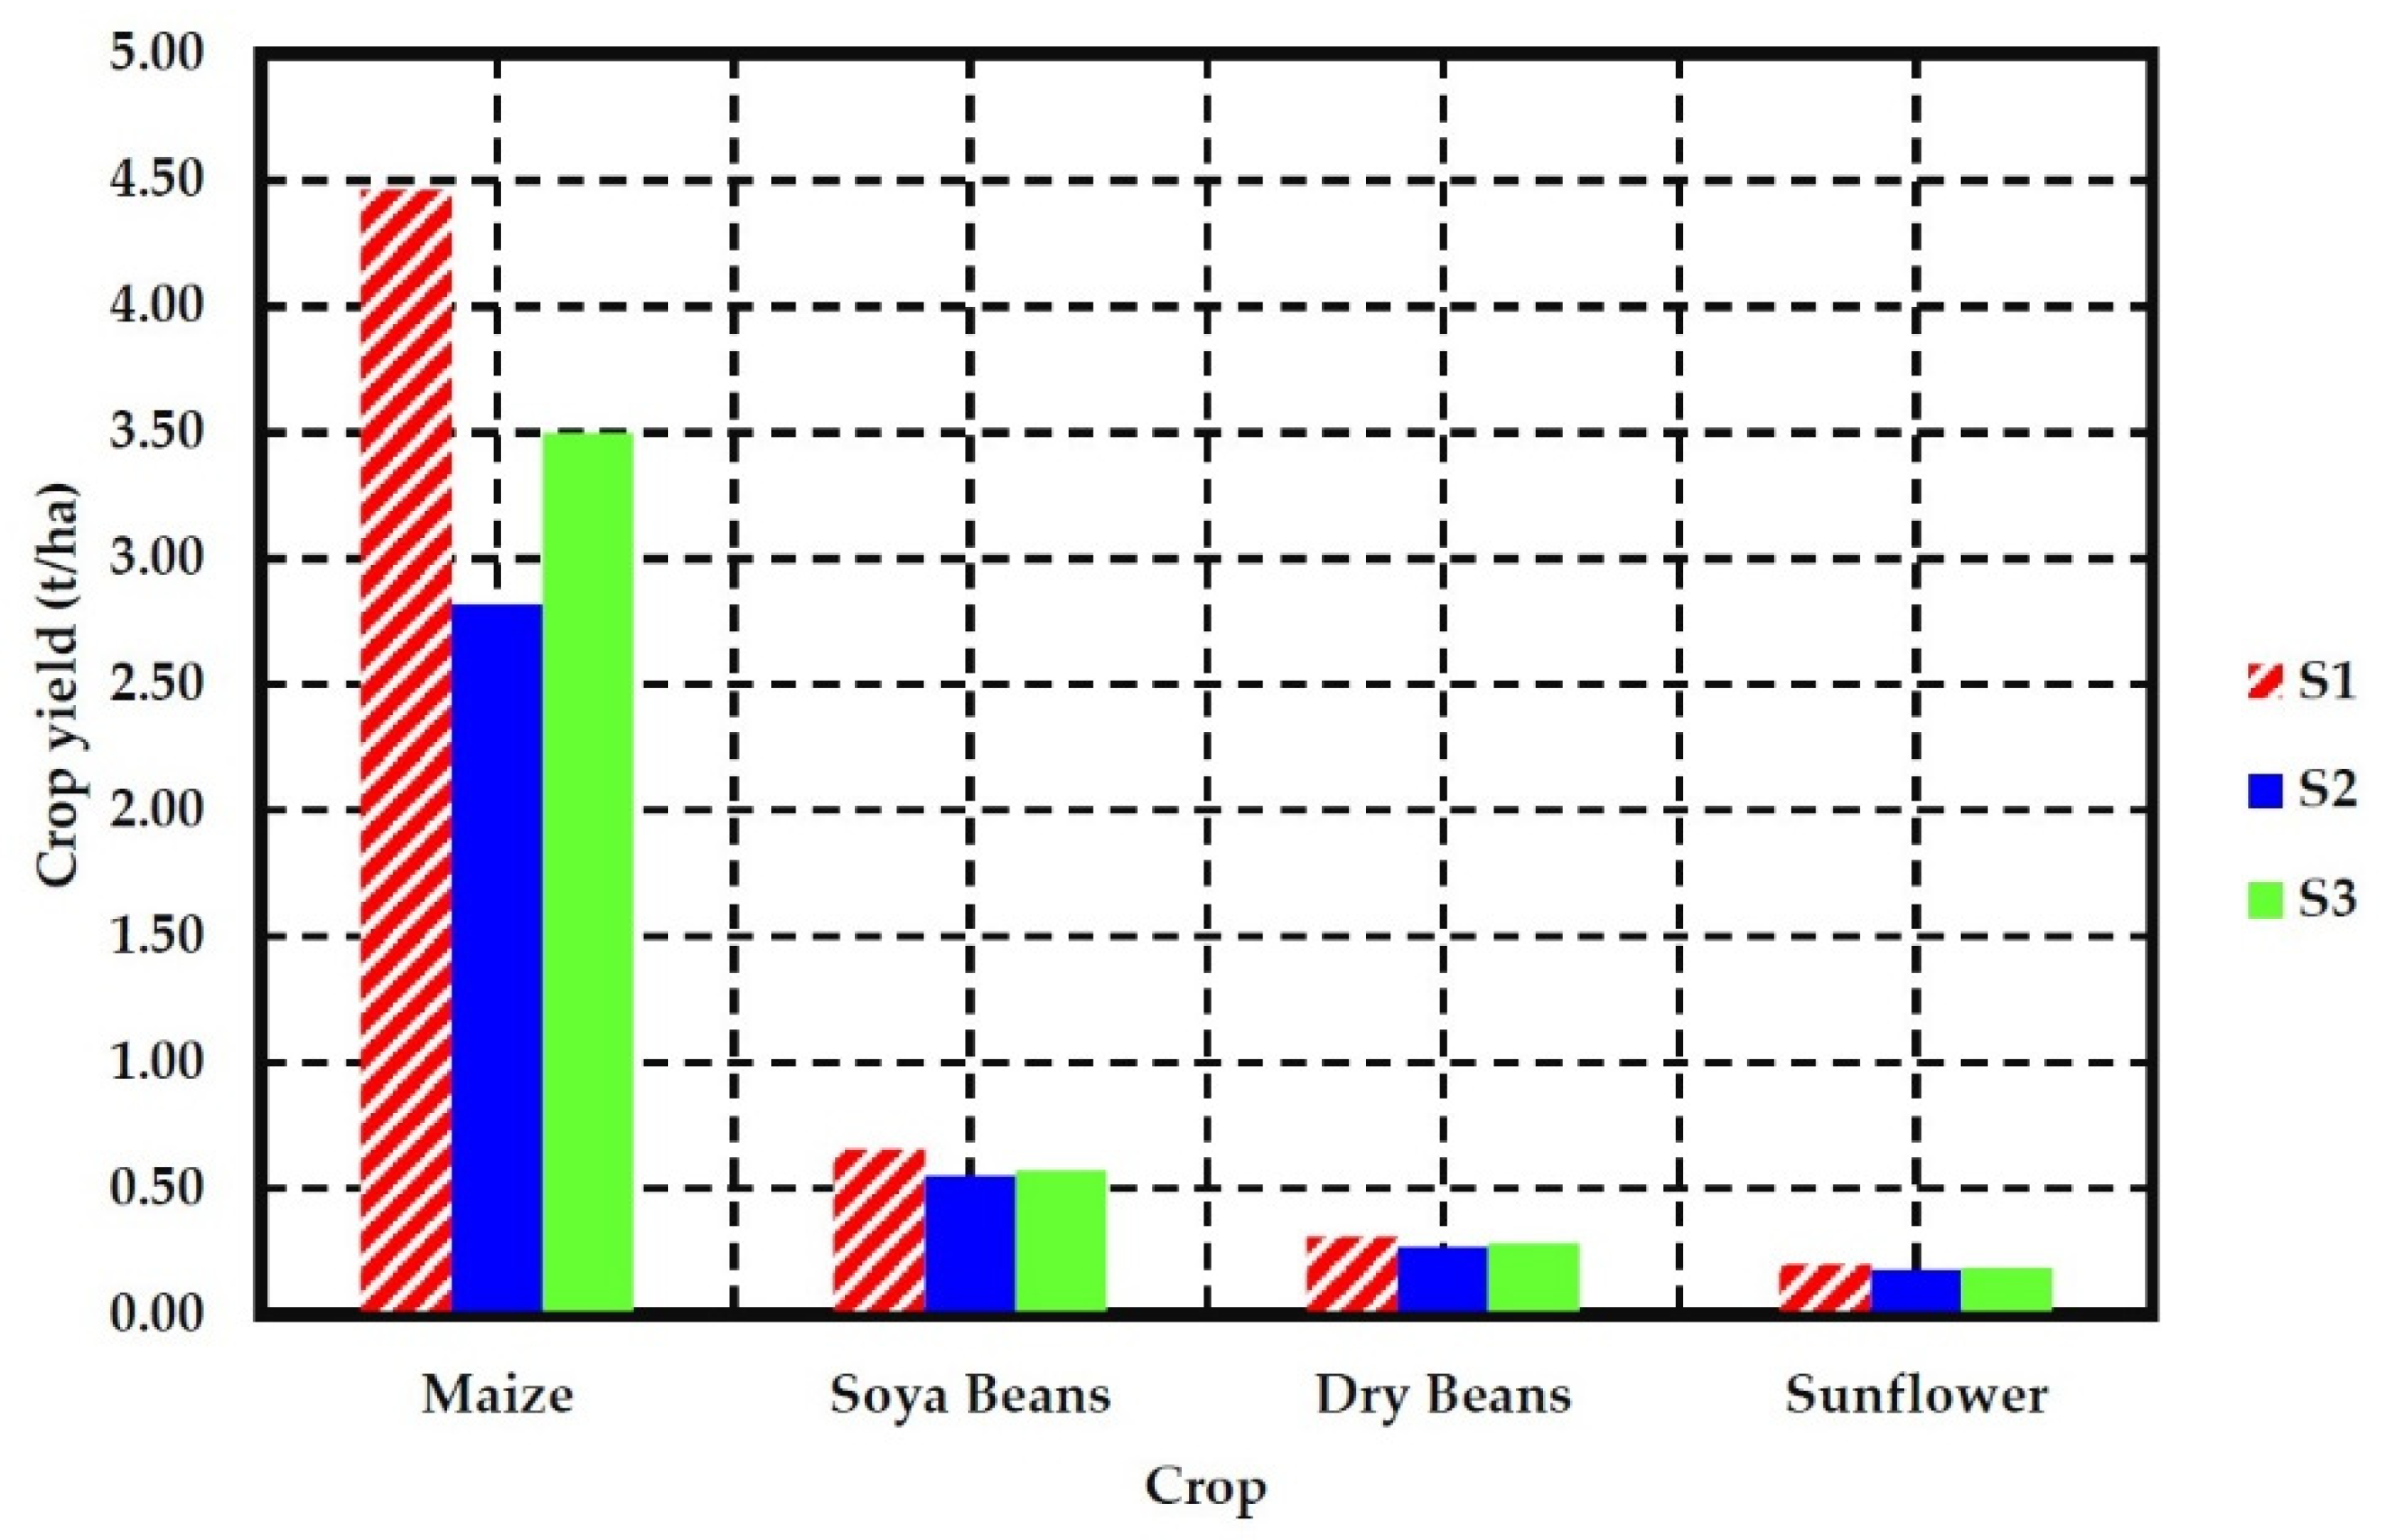
We analyzed the effect of soil texture on crop yield under the current climatic conditions (1976–2005). Simulated results of crop yield (maize soya beans, dry beans, and sunflower) were higher in sandy loam and sandy clay loam, compared to loam sand, which is ascribed to high water retention in sandy loam and sandy clay loam soil. The grain yield in sandy loam and sandy clay loam was 5.6 t/ha and 4.5 t/ha respectively, as presented in Figure 6. Similarly, a study by Jalota et al. [46] found an increased grain yield of maize and wheat in sandy loam soil which the study attributed to the high water holding capacity of the soil. In our current study, it is evident that soil with low water retention capacity will have larger percolation loss which would increase the amount of water required for crop production. Adapting to this issue will require farmers to irrigate more often, particularly during periods of limited rainfall. However, this situation can be rectified through the application of organic matter to increase the density of the soil as suggested by Jalota et al. [46].
3.6. Crop Yield Analysis
This study analyzed the impact of climate change on crop yield in the Olifants catchment. The WEAP-MABIA model was used to simulate crop yield under RCP 4.5 and RCP 8.5 emission scenarios. Results presented in Table 5 show the changes in crop yield for both RCPs climate change scenarios relative to the 30 years baseline average. Based on the analysis, an average annual decrease in crop yield was expected for both projected climate change scenarios (RCP 4.5 and RCP 8.5) for the early, mid, and end-term periods with RCP 8.5 showing the highest rate of decrease towards the end of the century. A decrease of 19 to 40%, 12 to 25%, 19 to 32%, and 5 to 20% was anticipated for maize, soya beans, dry beans, and sunflower under the RCP 4.5 climate change scenario. For the RCP 8.5 scenario, maize and soya beans were expected to decline by 20 to 65% and 11 to 38% respectively, while a decrease of 16 to 42% and 10 to 30% was expected for dry beans and sunflower. A slight increase in the yield of soya beans in the early term for RCP 8.5 was anticipated. The general decrease in crop yield in the Olifants catchment is attributed to the decreasing trend in precipitation coupled with an increase in temperature. The anticipated decline in crop yield in the catchment suggests the need for the development and implementation of plausible adaptation measures.
3.7. Evaluation of Adaptation Strategies
Considering the negative effect of climate change on crop yield arising from increased temperature and decreased precipitation, this study evaluated the capabilities of adaptation strategies to improve current and future crop yield. Four agricultural management strategies were simulated in the WEAP-MABIA crop model. These strategies included a combination of changing planting date with the application of full irrigation, use of rainwater harvesting, application of the deficit irrigation method, and the use of efficient irrigation devices. Table 6 presents changes in crop yield with the adoption of changing planting date and full irrigation technique for both baseline and projected climate (RCP 4.5 and RCP 8.5) scenarios for the period 2010–2039, 2040–2069, and 2070–2099 respectively. Results revealed that maize and soya bean yields will increase by 39 to 270% and by 52 to 138% while dry bean and sunflower was expected to increase by 45 to 144% and 15 to 57% respectively.
For the application of rainwater harvest, results from the analysis revealed an increase in the mean potential yield ranging between 14 to 21% and 5 to 8% for maize and soya beans respectively. For dry beans, an increase of between 4 to 10% was expected while an increase of 5 to 13% was expected for sunflower yield, as presented in Table 7. The analysis of the results also revealed that the ability of RWH to improve crop yield in the Olifants catchment was expected to continue toward the mid and end-term for both RCPs.
With regards to the application of the deficit irrigation method as an adaptive strategy. The results illustrated in Table 8 show that the yield of maize was expected to decrease by 1 to 3% for both the baseline and projected climate scenarios. While an increase of 2 to 4% was anticipated for the soya beans yield. For dry beans, a different situation was observed as there were no changes in the yield for both baseline and projected climate scenarios with the exception of RCP8.5 which showed an increase of 4 and 5% for the early term (2010–2039) and mid-term (2040–2069) respectively. Similar to dry beans, the yield of sunflower remains unchanged.
Under the application of the efficient irrigation device, results demonstrated in Table 9 show an increase in maize yield for both baseline and projected climate, while there were no changes in the yield of soya beans, dry beans, and sunflower.
The evaluation of adaptation measures in this study show that crops respond to adaptive measures differently. It is, however, important to note that not all adaptive strategies can improve crop yields. Among the different adaptation strategies evaluated, the combination of changing the planting date with full irrigation technique and the application of rainwater harvesting were found to be the most suitable measures for all crops studied.
4. Discussion
There is great uncertainty about the future effects of climate change on crop production. This analysis explores the potential implications of climate change on catchment crop yield based on CORDEX-RCM driven by six GCMs for two IPCC emission scenarios (RCP 4.5 and RCP 8.5). Furthermore, four possible adaptation strategies to cope with climate change impact in the Olifants catchment were considered: the combination of changing sowing date and application of full irrigation, application of rainwater harvesting, adoption of the deficit irrigation method, and the use of efficient irrigation devices.
Our analysis revealed an increased warming trend of between 1 °C to 5 °C for both climate change scenarios (RCP 4.5 and RCP 8.5) relative to the baseline climate of 1976–2005. This analysis aligns with the predictions of Durand [8]. On the other hand, average monthly precipitation is expected to decrease in the future for both climate change scenarios with the exception of the month of August and September for RCP 4.5 during the early term. This finding aligns with Kusangaya et al. [48] who also predicted decreased precipitation over Southern Africa. The changes in precipitation and temperature, particularly in the summer months when crops are being planted, have caused significant declines in crop yield. Such decreases are mostly attributed to increased temperature [17,20,21,49]. Contrary to this finding, a study by Cazadilla et al. [9] found an increase in crop production for South Africa under the MIROC AIB scenario. However, this contradiction may be due to the uncertainty associated with global climate models.
Considering the negative impacts of climate change on crop production in this study, we evaluated different adaptation strategies to improve crop production. Among the adaptation strategies assessed, the integration of changing sowing date with full irrigation application had the highest crop yield under both current and projected climate change scenarios as compared to other adaptation strategies evaluated. The adoption of changing sowing date alone might not be an effective measure to cope with climate change considering the significant decline in the catchment precipitation. However, few studies [50,51] have observed an increase in crop yield with the adoption of this strategy.
Combining changing sowing date with the application of full irrigation is seen to be an effective measure to cope with the long-term impact of climate change, but the application of full irrigation might prove to be challenging, as the Olifants catchment is already experiencing water stress arising from increased demands. The adoption of rainwater harvesting is therefore seen as an effective measure towards resolving this challenge as it involves harvesting rainwater from runoffs during periods of heavy rainfall. This approach would thus reduce the over-exploitation of fresh water from the system during irrigation. Our analysis has shown that the application of rainwater harvesting would improve the yield of crops under current and projected climate change which is consistent with the findings of Lebel et al. [52] and Rasuiba [53]. Contrary to the findings of the study conducted by Chimonyo et al. [54], where the application of the deficit irrigation method improved the yield of sorghum and cowpea plant, our experiments provided a different result. However, our findings aligned with the findings of a study by Shrestha L and Shrestha N [55] who also reported a decline in winter wheat yield with the adoption of the deficit irrigation approach. The application of an efficient irrigation device improved the yield of maize crops while the yield of other studied crops remained unchanged under current and projected climate change.
Findings from this study have shown that not all adaptive measures are capable of improving crop yield under the impact of climate change. It is therefore important to evaluate crop response to different adaptation measures before implementation in order to determine the most suitable and appropriate strategies to be adopted.
5. Conclusions
The analysis of climate change impacts has shown that crop yield may be declined by as much as 65% by the end of the century in the Olifants catchment of South Africa. Yet, studies have also suggested that much of the yield loss can be mitigated using adaptation measures. In this paper, we used an ensemble of six biased corrected GCMs downscaled with one regional climate model to assess crop yield response to projected climate change (RCP 4.5 and RCP 8.5) for the Olifants catchment. The WEAP-MABIA processed-based crop model was used for yield prediction and to investigate the effect of adaptation strategies. The findings from the study revealed that surface temperature in the Olifants catchment will increase in the future while precipitation, on the other hand, is expected to decrease, which will consequently decline crop production. The analysis also revealed that soil with high water holding capacity tends to retain more water for crop use and thus is able to improve crop yield under limited rainfall.
Based on the adaptation strategies evaluated to cope with the impacts of climate change, the combination of changing sowing date with full irrigation application as well as the adoption of rainwater harvesting resulted in a significant positive yield change.
Finally, the effect of climate change on crop yield is considerable and poses serious threats not just to farmers but also to regional food security, especially given the rapidly growing population of South Africa which necessitates the production of more food. Ultimately, the solution to climate change lies in the effective deployment of adaptive strategies that could mitigate the impacts of climate change. This study thus provides actionable knowledge and insights that could be used to avoid yield losses in the future. Adopting the measures proposed in this study are also well within the ability of policy-makers and the majority of the smallholder farmers. The implications of the analysis and findings of this study are to pave the way towards a more proactive agricultural management planning with regards to climate change and its impending impacts on food security in the region.
Author Contributions
Conceptualization, M.F.O. and T.N.; Methodology, M.F.O.; Software, M.F.O.; Validation, M.F.O., T.N. and N.D.; Formal Analysis, M.F.O.; Investigation, M.F.O.; Resources, M.F.O.; Data Curation, T.N. and M.F.O.; Writing—Original Draft Preparation, M.F.O.; Writing—Review & Editing, T.N. and N.D.; Visualization, M.F.O.; Supervision, T.N. and N.D.; Funding Acquisition, M.F.O. All authors have read and agreed to the published version of the manuscript.
Funding
This research was supported by the Nation Research foundation-The World Academy of Science (NRF-TWAS) Grant No. 110823.
Institutional Review Board Statement
The study was conducted according to the guidelines of the Declaration of Mary Olabanji, and approved by the Institutional Review Ethics Committee of the University of Pretoria (protocol code NAS133/2019 and approval date 21-08-2019).
Informed Consent Statement
Informed consent was obtained from all subjects involved in the study.
Data Availability Statement
Data available in a publicly accessible repository that does not issue DOIs. Publicly available datasets were analyzed in this study. This data can be found here: http://cordexesg.dmi.dk/esgf-web-fe/.
Acknowledgments
The authors wish to express their gratitude to the South African weather service for the provision of observed climate data used in this study.
Conflicts of Interest
Authors declare no conflict of interest.
References
- Intergovernmental Panel on Climate Change (IPCC). Climate Change 2014: Synthesis Report. Contribution of Working Groups I, II and III to the Fifth Assessment Report of the Intergovernmental Panel on Climate Change; IPCC: Geneva, Switzerland, 2014. [Google Scholar]
- Shrestha, S.; Thin, N.M.M.; Deb, P. Assessment of Climate Change Impacts on Irrigation Water Requirement and Rice Yield for Ngamoeyeik Irrigation Project in Myanmar. J. Water Clim. Chang. 2014, 5, 427–442. [Google Scholar] [CrossRef]
- Malla, G. Climate change and its impact on Nepalese agriculture. J. Agric. Environ. 2008, 9, 62–71. [Google Scholar] [CrossRef] [Green Version]
- Bhatt, D.; Maskey, S.; Babel, M.S.; Uhlenbrook, S.; Prasad, K.C. Climate Trends and Impacts on Crop Production in the Koshi River Basin of Nepal. Reg. Environ. Chang. 2014, 14, 1291–1301. [Google Scholar] [CrossRef] [Green Version]
- Nana, E.; Corbari, C.; Bocchiola, D. A Model for Crop Yield and Water Footprint Assessment: Study of Maize in the Po Valley. Agric. Syst. 2014, 127, 139–149. [Google Scholar] [CrossRef]
- Bouman, B. How much water does rice use. Management 2009, 69, 115–133. [Google Scholar]
- Kang, Y.; Khan, S.; Ma, X. Climate Change Impacts on Crop Yield, Crop Water Productivity and Food Security—A Review. Prog. Nat. Sci. 2009, 19, 1665–1674. [Google Scholar] [CrossRef]
- Durand, W. Assessing the Impact of Climate Change on Crop Water Use in South Africa; CEEPA DP28; University of Pretoria: Pretoria, South Africa, 2006. [Google Scholar]
- Calzadilla, A.; Zhu, T.; Rehdanz, K.; Tol, R.S.; Ringler, C. Climate change and agriculture: Impacts and adaptation options in South Africa. Water Resour. Econ. 2014, 1, 24–48. [Google Scholar] [CrossRef]
- Source OECD. OECD Review of Agricultural Policies—South Africa; OECD: Paris, France, 2006. [Google Scholar] [CrossRef]
- Adisa, O.M.; Botai, C.M.; Botai, J.O.; Hassen, A.; Darkey, D.; Tesfamariam, E.; Adisa, A.F.; Adeola, A.M.; Ncongwane, K.P. Analysis of Agro-Climatic Parameters and Their Influence on Maize Production in South Africa. Theor. Appl. Climatol. 2018, 134, 991–1004. [Google Scholar] [CrossRef]
- Muroyiwa, B.; Mushunje, A. Price discovery in the South African white and yellow maize futures market. Int. J. Sci. Res. 2017, 73, 73. [Google Scholar] [CrossRef]
- Botai, C.M.; Botai, J.O.; Dlamini, L.C.; Zwane, N.S.; Phaduli, E. Characteristics of Droughts in South Africa: A Case Study of Free State and North West Provinces. Water 2016, 8, 439. [Google Scholar] [CrossRef]
- Erasmus, B.; Van Zyl, J. The Effects of Climate Change on the Farm Sector in the Western Cape. Agrekon 2000, 39, 559–573. [Google Scholar] [CrossRef]
- Intergovernmental Panel on Climate Change (IPCC). Climate Change 2007: The Physical Science Basis; Cambridge University Press: Cambridge, UK, 2007. [Google Scholar]
- Lobell, D.B.; Burke, M.B.; Tebaldi, C.; Mastrandrea, M.D.; Falcon, W.P.; Naylor, R.L. Prioritizing Climate Change Adaptation Needs for Food Security in 2030. Science 2008, 319, 607–610. [Google Scholar] [CrossRef] [PubMed]
- Mangani, R.; Tesfamariam, E.H.; Engelbrecht, C.J.; Bellocchi, G.; Hassen, A.; Mangani, T. Potential Impacts of Extreme Weather Events in Main Maize (Zea Mays L.) Producing Areas of South Africa Under Rain-fed Conditions. Reg. Environ. Chang. 2019, 19, 1441–1452. [Google Scholar] [CrossRef]
- Thornton, P.K.; Jones, P.G.; Ericksen, P.J.; Challinor, A.J. Agriculture and Food Systems in Sub-Saharan Africa in a 4 °C + World. Philosophical Transactions: Mathematical. Phys. Eng. Sci. 2011, 369, 117–136. [Google Scholar]
- Du Toit, A.S.; Prinsloo, M.A.; Durand, W.; Kiker, G. Report on Vulnerability of Maize Production to Climate Change and Adaptation Assessment in South Africa; Agricultural Research Council, Grain Crops Institute: Potchefstroom, South Africa, 2001. [Google Scholar]
- Schulze, R.E.; Kiker, G.A.; Kunz, R.P. Global Climate Change and Agricultural Productivity in Southern Africa. Glob. Environ. Chang. 1993, 3, 330–349. [Google Scholar] [CrossRef]
- Akpalu, W.; Hassan, R.M.; Ringler, C. Climate variability and maize yield in South Africa. Environ. Prod. Technol. Div. IFPRI Pap. 2008. [Google Scholar]
- Matji, O. The Impact of Climate Change on Agricultural Crop Distribution in South Africa. Master’s Thesis, University of Witwatersrand, Johannesburg, South Africa, 2015. [Google Scholar]
- Mayowa, A.O. The Use of Satellite-Derived Data and Neural-Network Analysis to Examine Variation in Maize Yield Under Changing Climate. Ph.D. Thesis, University of Pretoria, Pretoria, South Africa, 2019. [Google Scholar]
- Gbetibouo, G.A.; Hassan, R.M. Measuring the Economic Impact of Climate Change on Major South African Field Crops: A Ricardian Approach. Glob. Planet. Chang. 2005, 47, 143–152. [Google Scholar] [CrossRef]
- Deressa, T.; Hassan, R.; Poonyth, D. Measuring the Impact of Climate Change on South African Agriculture: The Case of Sugarcane Growing Regions. Agrekon 2005, 44, 524–542. [Google Scholar] [CrossRef] [Green Version]
- Magagula, T.F.; van Koppen, B.; Sally, H. Water access and poverty in the Olifants Basin: A spatial analysis of population distribution, poverty prevalence and trends. In Proceedings of the 7th WaterNet/WARFSA/GWP Annual Symposium, Lilongwe, Malawi, 1–3 November 2006. [Google Scholar]
- Nkhonjera, G.K.; Dinka, M.O. Significance of Direct and Indirect Impacts of Climate Change on Groundwater Resources in the Olifants River Basin: A Review. Glob. Planet. Chang. 2017, 158, 72–82. [Google Scholar] [CrossRef]
- Richard, T.; Michael, S. Olifants River Irrigation Schemes: 1. Crop and Irrigation Data for Four Separate Irrigation Schemes: 2. Irrigation Management Structures for Four Separate Irrigation Schemes; South Africa working paper no. 5; International Water Management Institute (IWMI): Colombo, Sri Lanka, 2000. [Google Scholar]
- Olabanji, M.F.; Ndarana, T.; Davis, N.; Archer, E. Climate Change Impact on Water Availability in the Olifants Catchment (south Africa) with Potential Adaptation Strategies. Phys. Chem. Earth 2020, 120, 102939. [Google Scholar] [CrossRef]
- McCartney, M.P.; Yawson, D.K.; Magagula, T.F.; Seshoka, J. Hydrology and Water Resources Development in the Olifants River Catchment; Working Paper 76; International Water Management Institute (IWMI): Colombo, Sri Lanka, 2004. [Google Scholar]
- Ly, S.; Degre, A.; Charles, C. Geostatistical Interpolation of Daily Rainfall at Catchment Scale: The Use of Several Variogram Models in the Ourthe and Ambleve Catchments, Belgium. Hydrol. Earth Syst. Sci. 2011, 15, 2259–2274. [Google Scholar] [CrossRef] [Green Version]
- Amin, A.; Iqbal, J.; Asghar, A.; Ribbe, L. Analysis of Current and Future Water Demands in the Upper Indus Basin Under Ipcc Climate and Socio-Economic Scenarios Using a Hydro-Economic WEAP Model. Water 2018, 10, 537. [Google Scholar] [CrossRef] [Green Version]
- Riahi, K.; Grübler, A.; Nakicenovic, N. Scenarios of Long-Term Socio-Economic and Environmental Development under Climate Stabilization. Technol. Forecast. Soc. Chang. 2007, 74, 887–935. [Google Scholar] [CrossRef]
- Shrestha, M. Data Analysis Relied on Linear Scaling Bias Correction (V.1.0), Microsoft Excel File; ResearchGate GmbH: Berlin, Germany, 2015. [Google Scholar] [CrossRef]
- Jabloun, M.; Sahli, A. WEAP-MABIA Tutorial: A Collection of Stand-Alone Chapters to Aid in Learning the WEAP-MABIA Module; Federal Institute for Geosciences and Natural Resources: Hannover, Germany, 2012. [Google Scholar]
- Sieber, J.; Purkey, D. WEAP: Water Evaluation and Planning System. User Guide; Stockholm Environment Institute, US Center: Somerville, MA, USA, 2011; Available online: http://weap21.org/downloads/WEAP_User_Guide.pdf (accessed on 22 March 2020).
- Esteve, P.; Varela-Ortega, C.; Blanco-Gutiérrez, I.; Downing, T.E. A hydro-economic model for the assessment of climate change impacts and adaptation in irrigated agriculture. Ecol. Econ. 2015, 1, 49–58. [Google Scholar] [CrossRef] [Green Version]
- Rajendran, M.; Gunawardena, E.R.; Dayawansa, N.D. Runoff Prediction in an Ungauged Catchment of Upper Deduru Oya Basin, Sri Lanka: A Comparison of HEC-HMS and WEAP Models. Int. J. Progress. Sci. Technol. 2020, 18, 121–129. [Google Scholar]
- Allani, M.; Mezzi, R.; Abdallah, W.; Gharbi, A.; Zouabi, A.; Hedhli, K.; Beji, R.; Jemli, A.; Joumade-Mansouri, F.; Affli, E.; et al. A contribution to an advisory plan for integrated irrigation water management at Nebhana dam system: From research to operational support. EPiC Ser. Eng. 2018, 3, 26–35. [Google Scholar]
- Allen, R.G.; Pereira, L.S.; Raes, D.; Smith, M. Crop evapotranspiration-Guidelines for computing crop water requirements-FAO Irrigation and drainage paper 56. FAO Rome 1998, 300, D05109. [Google Scholar]
- Smith, M.; Allen, R.G.; Monteith, J.L.; Pereira, L.S.; Perrier, A.; Pruitt, W.O. Report on the Expert Consultation on Procedures for Revision of FAO Guidelines for Prediction of Crop Water Requirements; Land and Water Development Division, United Nations Food and Agriculture Service: Rome, Italy, 1992. [Google Scholar]
- Maponya, P.; Mpandeli, S. Climate change adaptation strategies used by Limpopo Province farmers in South Africa. J. Agric. Sci. 2012, 4, 39. [Google Scholar] [CrossRef]
- Parry, M.L.; Rosenzweig, C.; Iglesias, A.; Livermore, M.; Fischer, G. Effects of Climate Change on Global Food Production Under Sres Emissions and Socio-Economic Scenarios. Glob. Environ. Chang. 2004, 14, 53–67. [Google Scholar] [CrossRef]
- Mpandeli, S.; Nesamvuni, E.; Maponya, P. Adapting to the impacts of drought by smallholder farmers in Sekhukhune District in Limpopo Province, South Africa. J. Agric. Sci. 2015, 7, 115. [Google Scholar] [CrossRef]
- Sani, S.; Chalchisa, T. Farmers’ perception, impact and adaptation strategies to climate change among smallholder farmers in sub-Saharan Africa: A systematic review. J. Resour. Dev. Manag. 2016, 26, 1–8. [Google Scholar]
- Jalota, S.K.; Singh, S.; Chahal, G.B.; Ray, S.S.; Panigraghy, S.; Singh, K.B. Soil texture, climate and management effects on plant growth, grain yield and water use by rainfed maize–wheat cropping system: Field and simulation study. Agric. Water Manag. 2010, 97, 83–90. [Google Scholar] [CrossRef]
- Geerts, S.; Raes, D. Deficit Irrigation as an On-Farm Strategy to Maximize Crop Water Productivity in Dry Areas. Agric. Water Manag. 2009, 96, 1275–1284. [Google Scholar] [CrossRef] [Green Version]
- Kusangaya, S.; Warburton, M.L.; van Garderen, E.A.; Jewitt, G.P.W. Impacts of Climate Change on Water Resources in Southern Africa: A Review. Phys. Chem. Earth 2014, 67–69, 47–54. [Google Scholar] [CrossRef]
- Özdoğan, M. Modelling the impacts of climate change on wheat yields in North-western Turkey. Agric. Ecosyst. Environ. 2011, 1, 1–12. [Google Scholar] [CrossRef]
- Liangzhi, J.Z.D.G.; Chunlin, S. Food Crop Production Strategies for Adaptation to Global Climate Change in the Sampling Zones of Eastern China A modelling Study. J. Scientia Agric. Sinica. 1998, 31, 51–58. [Google Scholar]
- Sultana, H.; Ali, N.; Iqbal, M.M.; Khan, A.M. Vulnerability and Adaptability of Wheat Production in Different Climatic Zones of Pakistan under Climate Change Scenarios. Clim. Chang. 2009, 94, 123–142. [Google Scholar] [CrossRef]
- Lebel, S.; Fleskens, L.; Forster, P.M.; Jackson, L.S.; Lorenz, S. Evaluation of in Situ Rainwater Harvesting as an Adaptation Strategy to Climate Change for Maize Production in Rain-fed Africa. Water Resour. Manag. 2015, 29, 4803–4816. [Google Scholar] [CrossRef] [Green Version]
- Rasiuba, T. Water Budget Water Use Efficiency in Agriculture in Olifants Catchment. Master’s Thesis, University of the Witwatersrand, Johannesburg, South Africa, 2007. [Google Scholar]
- Chimonyo, V.G.P.; Mabhaudhi, T.; Modi, A.T. Assessment of Sorghum-Cowpea Intercrop System under Water-Limited Conditions Using a Decision Support Tool. Water SA 2016, 42, 316–327. [Google Scholar] [CrossRef] [Green Version]
- Shrestha, L.; Shrestha, N.K. Assessment of Climate Change Impact on Crop Yield and Irrigation Water Requirement of Two Major Cereal Crops (rice and Wheat) in Bhaktapur District, Nepal. J. Water Clim. Chang. 2017, 8, 320–335. [Google Scholar] [CrossRef]
Figure 1.
Map of Olifants River Basin showing towns, rivers, and irrigated areas.

Figure 2.
Diagrammatic representation of the conceptual framework of the study.
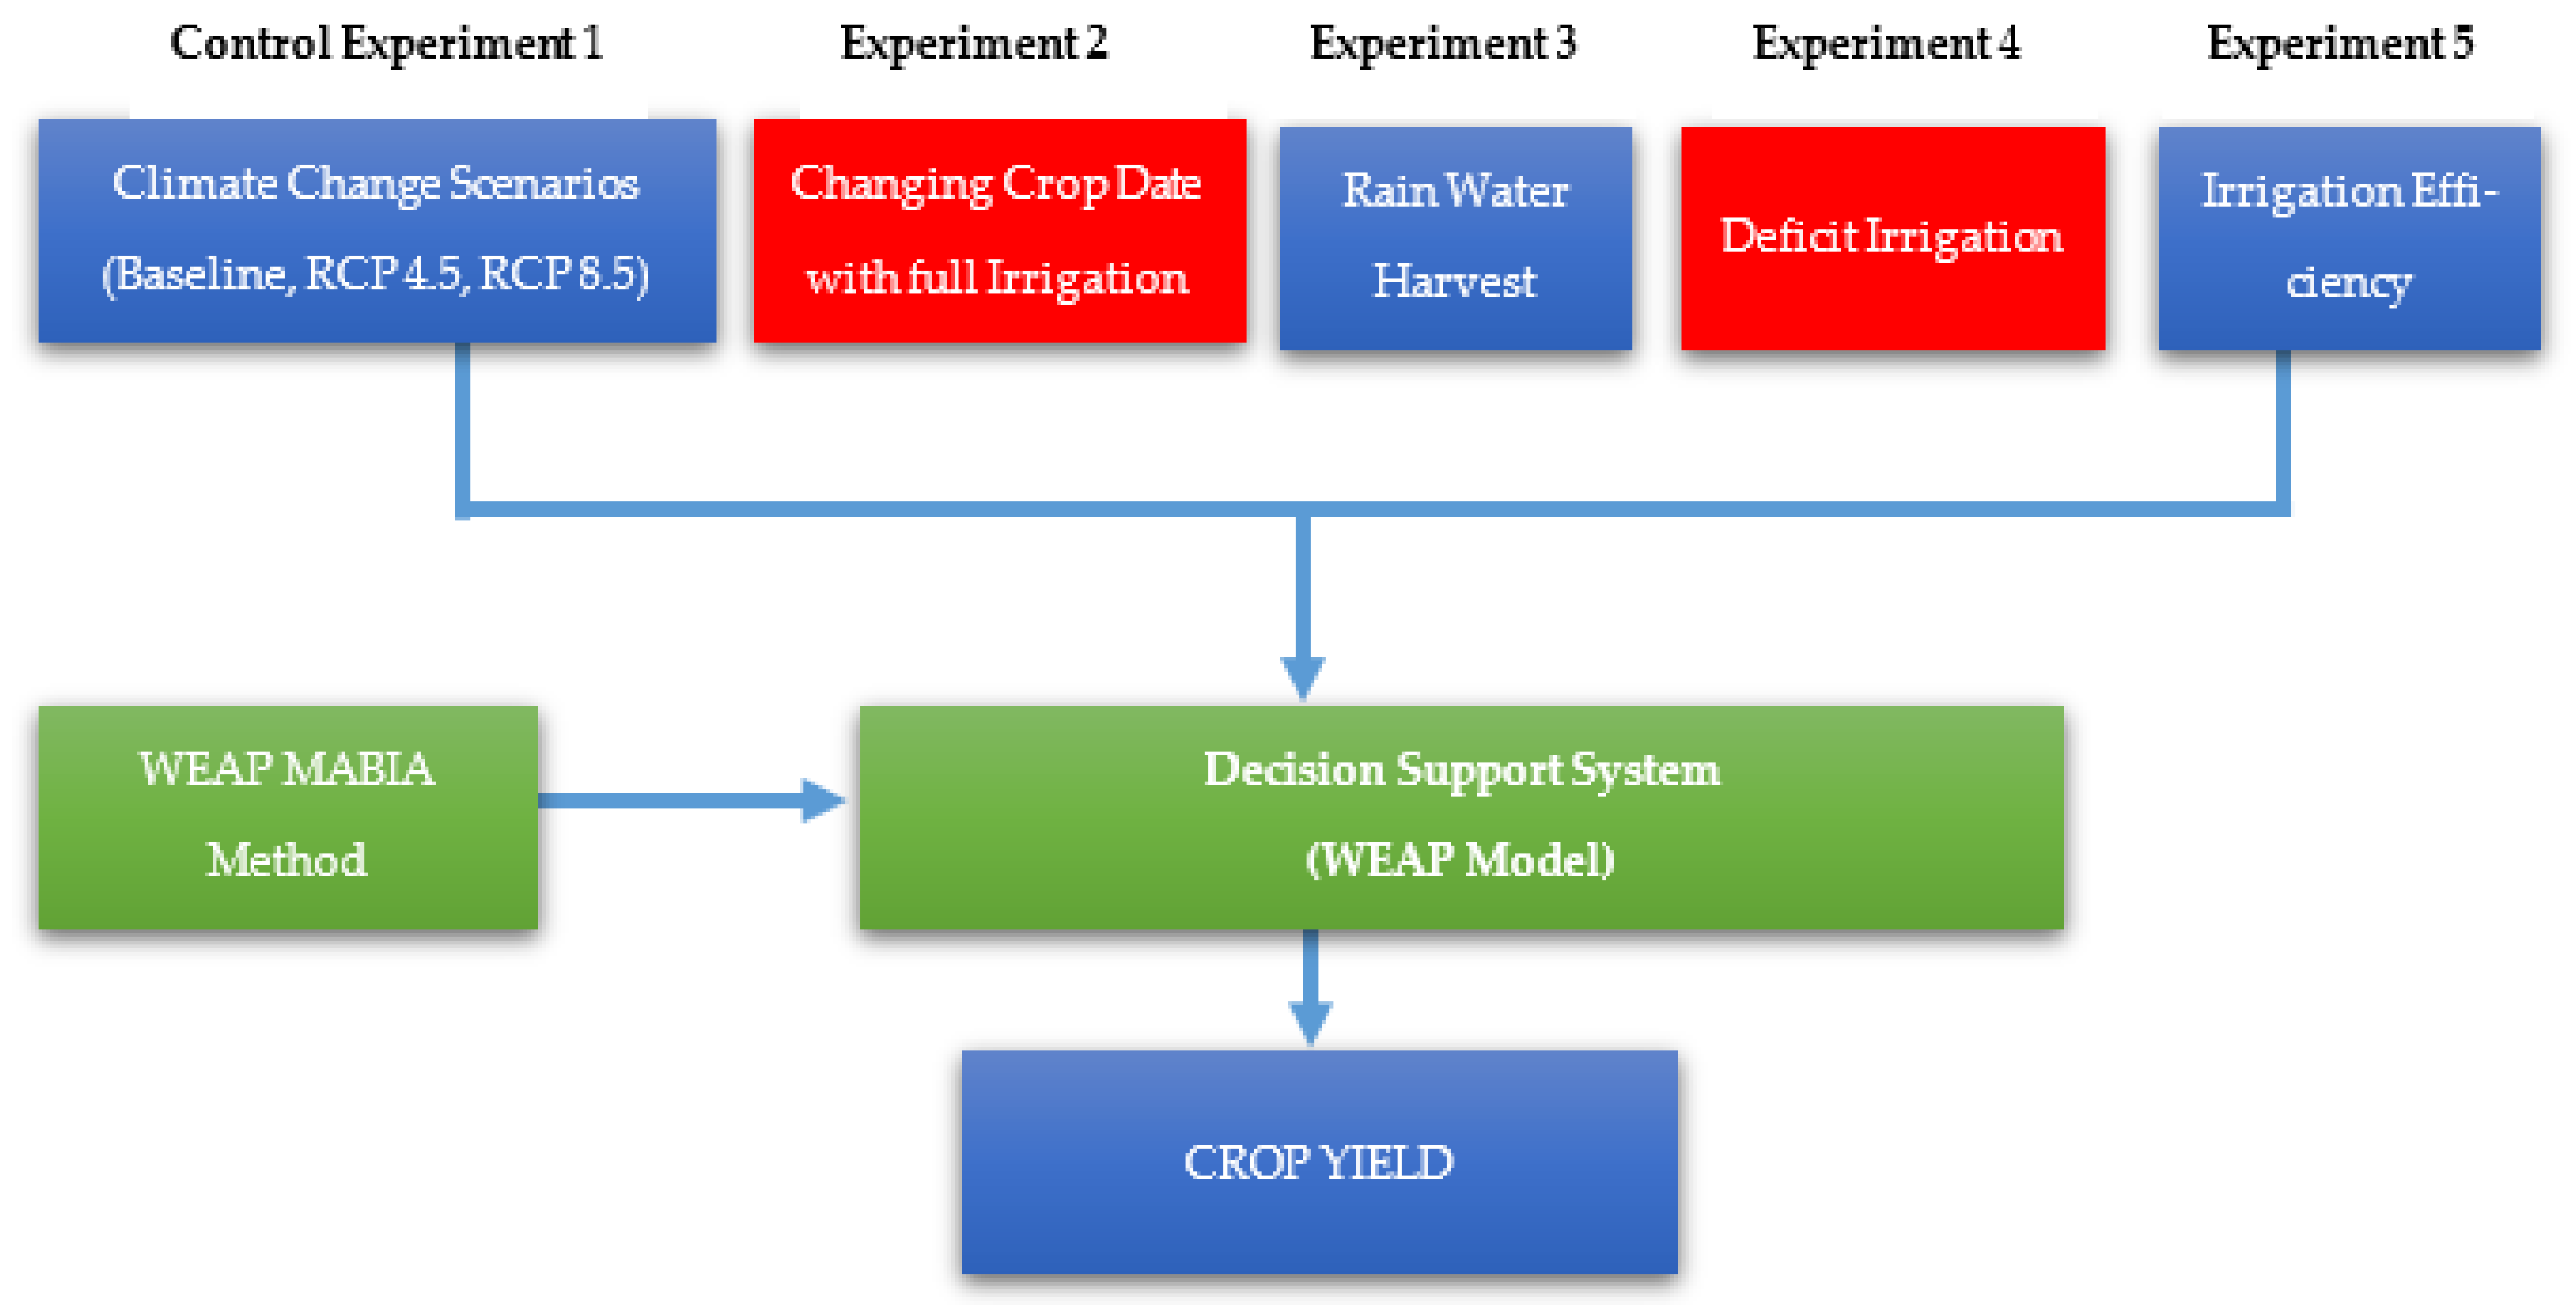
Figure 3.
Olifants catchment current monthly climate (a) showing observed monthly South African Weather service (SAWS) precipitation plotted against the uncorrected historical ensemble precipitation from the Regional Climate Model (RCM) and the bias-corrected ensemble RCM for the period 1976–2005; (b) ensemble historical average monthly temperature against SAWS average monthly temperature.
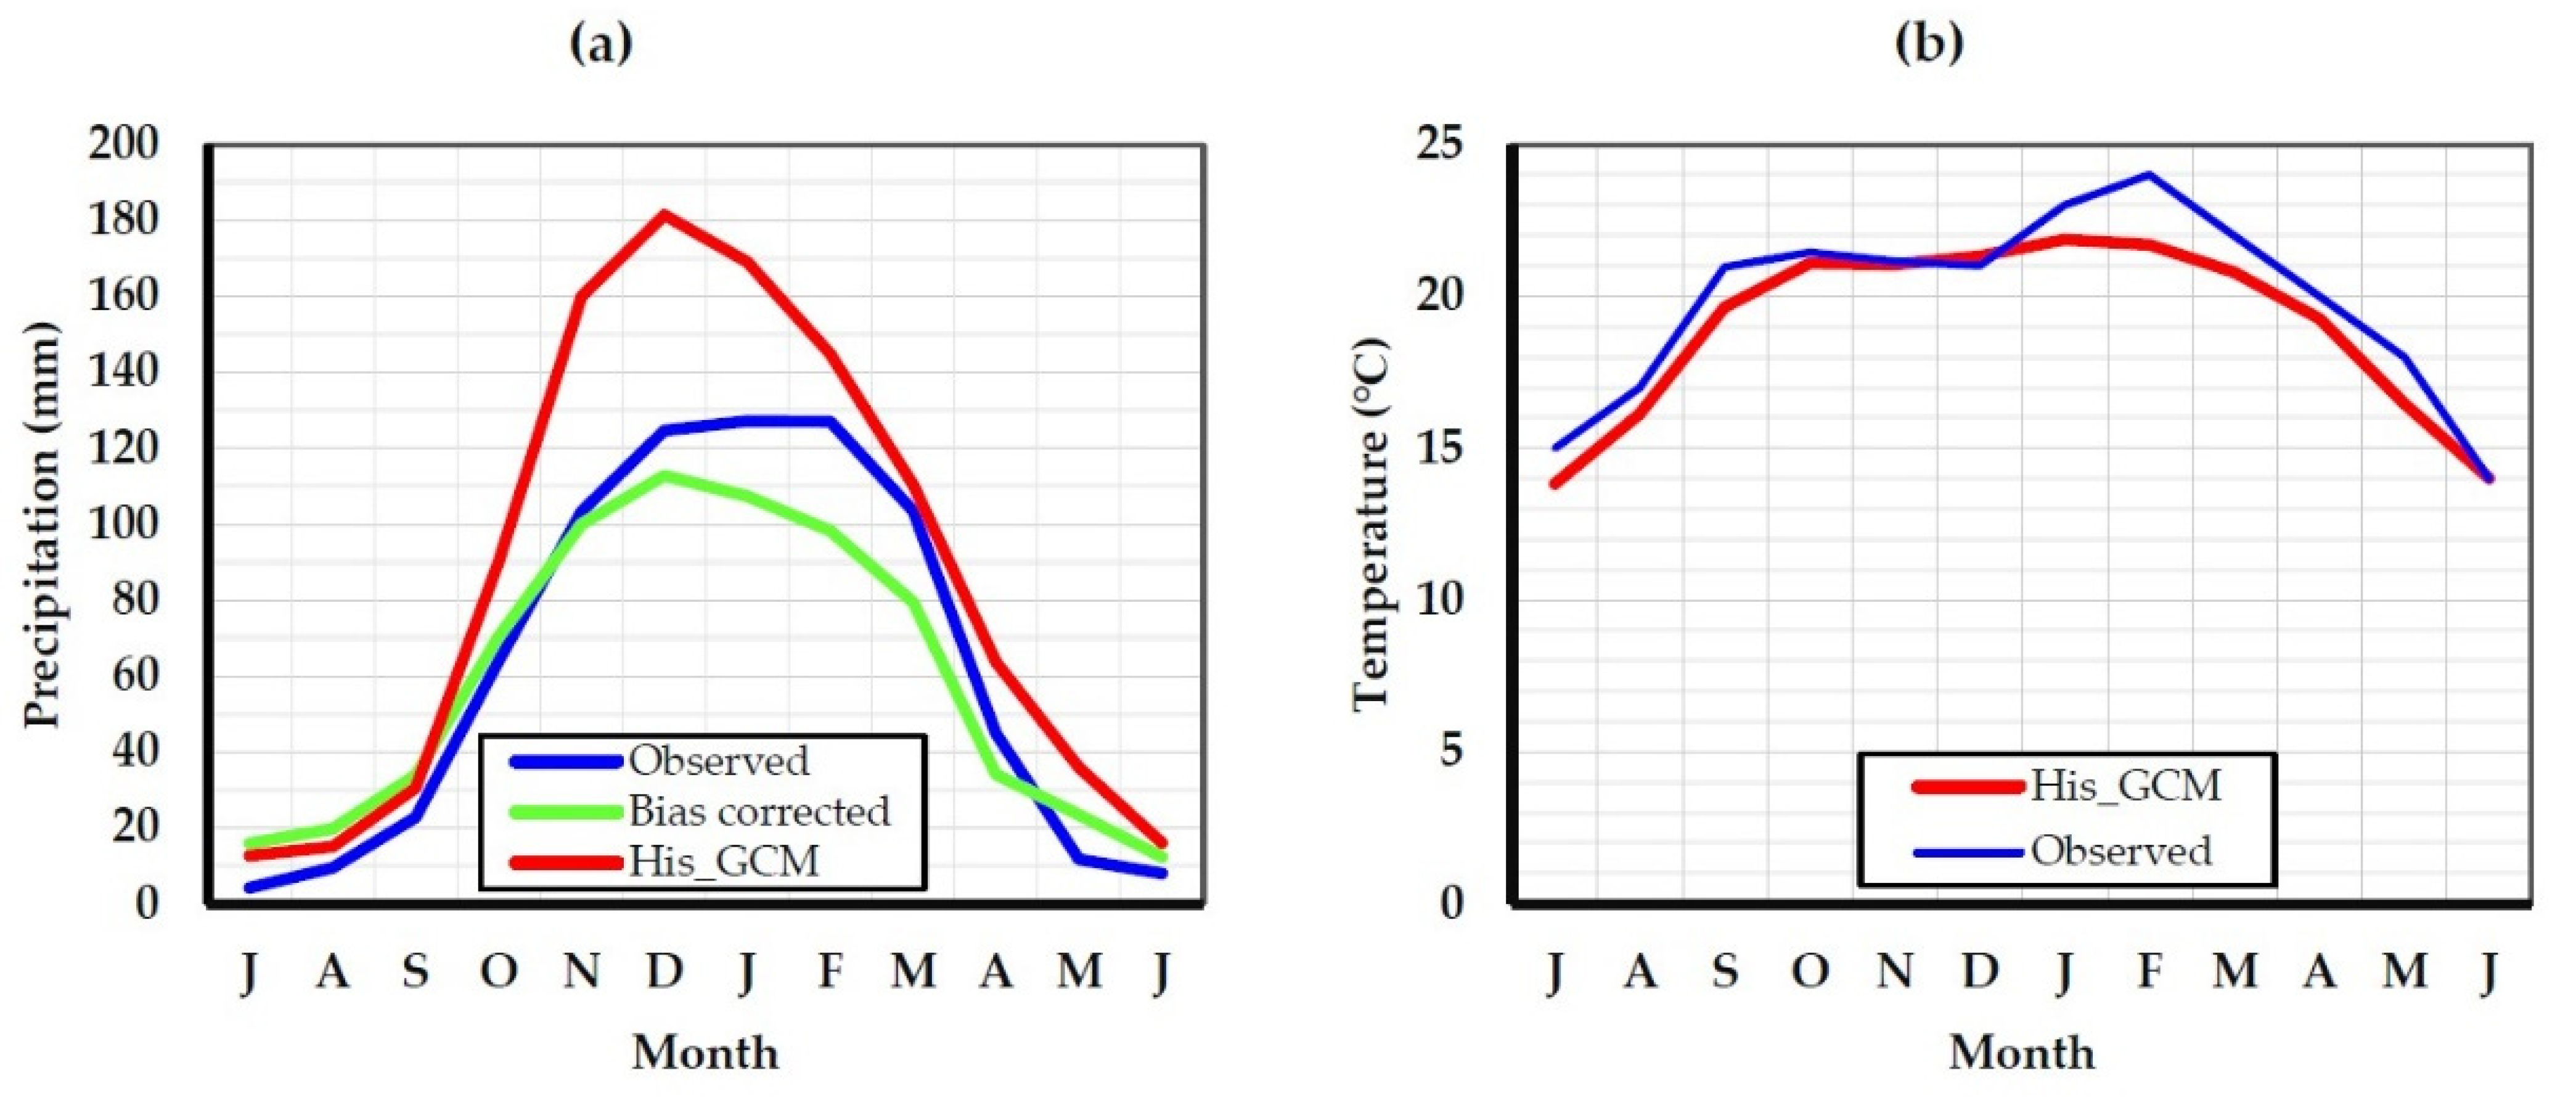
Figure 4.
Olifants catchment future monthly climate departure from observed climate: (a) temperature anomaly for representative concentration pathways (RCP) 4.5 and (b) for RCP 8.5; (c) and (d) showing precipitation anomaly for RCP 4.5 and RCP 8.5 for the period 2010–2039, 2040–2069, and 2070–2099 respectively.

Figure 5.
Predicted changes in the reference evapotranspiration for RCP 4.5 and RCP 8.5 relative to baseline climate (1976–2006) for the period (a) 2010–2039, (b) 2040–2069, and (c) 2070–2099.
Figure 5.
Predicted changes in the reference evapotranspiration for RCP 4.5 and RCP 8.5 relative to baseline climate (1976–2006) for the period (a) 2010–2039, (b) 2040–2069, and (c) 2070–2099.

Figure 6.
Influence of soil texture on crop yield, a plot showing crop yield response to different soil water holding capacity resulting from soil characteristics.
Figure 6.
Influence of soil texture on crop yield, a plot showing crop yield response to different soil water holding capacity resulting from soil characteristics.


Table 1.
Classification soil type used in this study (S1 = Sandy loam, S2 = Loamy sand, and S3 = Sandy clay loam).
Table 1.
Classification soil type used in this study (S1 = Sandy loam, S2 = Loamy sand, and S3 = Sandy clay loam).
| Texture Classes Soil | Properties as A Percentage (%) of Volume | |||
|---|---|---|---|---|
| Soil Type | Total Available Water (TAW) | Saturation (SAT) | Field Capacity (FC) | Wilt Point (WP) |
| S1 | 15.72 | 41.20 | 23.74 | 8.02 |
| S2 | 10.36 | 40.10 | 14.90 | 4.54 |
| S3 | 12.97 | 33.00 | 25.13 | 12.16 |
Table 2.
Database of crop parameters used in this study.
| Crop | Maize | Soya Beans | Dry Beans | Sunflower |
|---|---|---|---|---|
| Planting area (in thousand hectare) | 180 | 72 | 41 | 20 |
| Planting date | 10/24 | 11/05 | 11/17 | 11/25 |
| Stage length initial [days] | 25 | 15 | 20 | 25 |
| Stage length dev [days] | 40 | 30 | 30 | 35 |
| Stage length mid-season [days] | 45 | 60 | 40 | 45 |
| Stage length end-season [days] | 30 | 25 | 30 | 25 |
| Stage length total [days] | 140 | 130 | 120 | 130 |
| Kcb: initial | 0.15 | 0.15 | 0.15 | 0.15 |
| Kcb: mid-season | 1.15 | 1.10 | 1.00 | 1.10 |
| Kcb: end-season | 0.30 | 0.30 | 0.80 | 0.25 |
| Depletion factor initial | 0.55 | 0.50 | 0.45 | 0.45 |
| Depletion factor mid-season | 0.55 | 0.35 | 0.45 | 0.45 |
| Depletion factor: end-season | 0.55 | 0.50 | 0.45 | 0.45 |
| Yield response factor [ky] initial | 0.40 | 0.40 | 0.20 | 0.40 |
| Yield response factor dev | 0.40 | 0.80 | 0.60 | 0.60 |
| Yield response factor mid-season | 1.30 | 1.00 | 1.00 | 0.80 |
| Yield response factor end-season | 0.50 | 0.40 | 0.40 | 0.80 |
| Yield response factor total | 1.25 | 0.85 | 1.15 | 0.95 |
| Maximum Height [m] | 2.00 | 0.75 | 0.40 | 2.00 |
| Rooting Depth [m] Minimum | 0.15 | 0.15 | 0.15 | 0.15 |
| Rooting Depth [m] Maximum | 1.35 | 0.95 | 0.60 | 1.15 |
Table 3.
Model calibration and validation result using yearly simulated and observed crop yield.
| Crops | Crop Yield (t/ha) (Calibration) | Crop Yield (t/ha) (Validation) | ||||||
|---|---|---|---|---|---|---|---|---|
| Sim | Obs | R2 | NSE | Sim | Obs | R2 | NSE | |
| Maize | 4.30 | 4.62 | 0.98 | 0.97 | 4.32 | 5.17 | 0.95 | 0.92 |
| Soya beans | 0.40 | 0.45 | 0.99 | 0.98 | 0.65 | 0.72 | 0.96 | 0.94 |
| Dry beans | 0.35 | 0.37 | 1.0 | 0.99 | 0.36 | 0.45 | 0.92 | 0.87 |
| Sunflower | 0.20 | 0.23 | 1.0 | 0.98 | 0.21 | 0.25 | 0.98 | 0.96 |
Table 4.
Future changes in crop water requirements (in m3) for RCP 4.5 and RCP 8.5 climate change scenarios relative to baseline climate.
Table 4.
Future changes in crop water requirements (in m3) for RCP 4.5 and RCP 8.5 climate change scenarios relative to baseline climate.
| Baseline | RCP 4.5 | RCP 8.5 | |||||
|---|---|---|---|---|---|---|---|
| 1976–2005 | 2010–2039 | 2040–2069 | 2070–2099 | 2010–2039 | 2040–2069 | 2070–2099 | |
| Crops | CWR | CWR | CWR | CWR | CWR | CWR | CWR |
| Maize | 7.6 × 10⁸ | 8.7 × 10⁸ | 8.9 × 10⁸ | 9.1 × 10⁸ | 8.6 × 10⁸ | 9.3 × 10⁸ | 1.0 × 10⁹ |
| Soya beans | 2.2 × 10⁸ | 2.6 × 10⁸ | 3.0 × 10⁸ | 3.1 × 10⁸ | 2.5 × 10⁸ | 3.0 × 10⁸ | 3.6 × 10⁸ |
| Dry beans | 9.3 × 10⁷ | 1.1 × 10⁸ | 1.3 × 10⁸ | 1.4 × 10⁸ | 1.2 × 10⁸ | 1.4 × 10⁸ | 1.6 × 10⁸ |
| Sunflower | 4.3 × 10⁷ | 5.7 × 10⁷ | 7.0 × 10⁷ | 7.3 × 10⁷ | 6.0 × 10⁷ | 7.8 × 10⁷ | 9.1 × 10⁷ |
Table 5.
Changes in crop yield (in t/ha) for RCP 4.5 and RCP 8.5 emission scenarios relative to the average 30 years historical baseline (1976–2005).
Table 5.
Changes in crop yield (in t/ha) for RCP 4.5 and RCP 8.5 emission scenarios relative to the average 30 years historical baseline (1976–2005).
| Crops Yield (t/ha) | 1976–2005 | 2010–2039 | 2040–2069 | 2070–2099 | |||
|---|---|---|---|---|---|---|---|
| Mean | Mean | % Change | Mean | % Change | Mean | % Change | |
| Maize | 4.46 | 3.57 | −19 | 2.93 | −34 | 2.69 | −40 |
| 3.55 | −20 | 2.54 | −43 | 1.65 | −63 | ||
| Soya beans | 0.65 | 0.57 | −12 | 0.51 | −22 | 0.49 | −25 |
| 0.58 | −11 | 0.47 | −28 | 0.40 | −38 | ||
| Dry beans | 0.31 | 0.25 | −19 | 0.23 | −26 | 0.21 | −32 |
| 0.26 | −16 | 0.21 | −32 | 0.18 | −42 | ||
| Sunflower | 0.20 | 0.19 | −5 | 0.17 | −15 | 0.16 | −20 |
| 0.18 | −10 | 0.16 | −20 | 0.14 | −30 | ||
Table 6.
Changes in crop yield with the adoption of a change in planting date along with full irrigation technique for the baseline and projected climate scenarios for the periods 1976–2005, 2010–2039, 2040–2069, and 2070–2099.
Table 6.
Changes in crop yield with the adoption of a change in planting date along with full irrigation technique for the baseline and projected climate scenarios for the periods 1976–2005, 2010–2039, 2040–2069, and 2070–2099.
| RCP 4.5 | RCP 8.5 | |||||||||||||
|---|---|---|---|---|---|---|---|---|---|---|---|---|---|---|
| 1976–2005 | 2010–2039 | 2040–2069 | 2070–2099 | 2010–2039 | 2040–2069 | 2070–2099 | ||||||||
| Crops | Y(t/h) | % | Y(t/h) | % | Y(t/h) | % | Y(t/h) | % | Y(t/h) | % | Y(t/h) | % | Y(t/h) | % |
| Maize | 6.18 | 39 | 6.13 | 72 | 6.12 | 108 | 6.13 | 128 | 6.13 | 72 | 6.13 | 141 | 6.10 | 270 |
| Soya beans | 1.00 | 52 | 0.99 | 74 | 0.98 | 92 | 0.98 | 100 | 0.99 | 71 | 0.98 | 104 | 0.95 | 138 |
| Dry beans | 0.45 | 45 | 0.44 | 69 | 0.44 | 91 | 0.44 | 100 | 0.45 | 73 | 0.44 | 110 | 0.44 | 144 |
| Sunflower | 0.23 | 15 | 0.23 | 21 | 0.22 | 29 | 0.22 | 38 | 0.23 | 28 | 0.22 | 38 | 0.22 | 57 |
Table 7.
Changes in crop yield with the adoption of rainwater harvesting for the baseline and projected climate scenarios for the periods 1976–2005, 2010–2039, 2040–2069, and 2070–2099.
Table 7.
Changes in crop yield with the adoption of rainwater harvesting for the baseline and projected climate scenarios for the periods 1976–2005, 2010–2039, 2040–2069, and 2070–2099.
| RCP 4.5 | RCP 8.5 | |||||||||||||
|---|---|---|---|---|---|---|---|---|---|---|---|---|---|---|
| 1976–2005 | 2010–2039 | 2040–2069 | 2070–2099 | 2010–2039 | 2040–2069 | 2070–2099 | ||||||||
| Crops | Y(t/h) | % | Y(t/h) | % | Y(t/h) | % | Y(t/h) | % | Y(t/h) | % | Y(t/h) | % | Y(t/h) | % |
| Maize | 5.10 | 14 | 4.17 | 17 | 3.43 | 17 | 3.16 | 17 | 4.14 | 16 | 3.06 | 20 | 2.00 | 21 |
| Soya beans | 0.69 | 5 | 0.60 | 5 | 0.55 | 8 | 0.52 | 6 | 0.61 | 5 | 0.51 | 6 | 0.43 | 8 |
| Dry beans | 0.33 | 6 | 0.27 | 4 | 0.24 | 4 | 0.23 | 5 | 0.28 | 8 | 0.23 | 10 | 0.19 | 6 |
| Sunflower | 0.21 | 5 | 0.20 | 5 | 0.18 | 6 | 0.18 | 13 | 0.19 | 6 | 0.17 | 6 | 0.15 | 7 |
Table 8.
Changes in crop yield with the adoption of the deficit irrigation method for the baseline and projected climate scenarios for the periods 1976–2005, 2010–2039, 2040–2069, and 2070–2099.
Table 8.
Changes in crop yield with the adoption of the deficit irrigation method for the baseline and projected climate scenarios for the periods 1976–2005, 2010–2039, 2040–2069, and 2070–2099.
| RCP 4.5 | RCP 8.5 | |||||||||||||
|---|---|---|---|---|---|---|---|---|---|---|---|---|---|---|
| 1976–2005 | 2010–2039 | 2040–2069 | 2070–2099 | 2010–2039 | 2040–2069 | 2070–2099 | ||||||||
| Crops | Y(t/h) | % | Y(t/h) | % | Y(t/h) | % | Y(t/h) | % | Y(t/h) | % | Y(t/h) | % | Y(t/h) | % |
| Maize | 4.37 | −2 | 3.48 | −3 | 2.85 | −3 | 2.63 | −2 | 3.46 | −3 | 2.48 | −2 | 1.63 | −1 |
| Soya beans | 0.67 | 2 | 0.58 | 2 | 0.53 | 4 | 0.50 | 2 | 0.60 | 3 | 0.49 | 2 | 0.41 | 3 |
| Dry beans | 0.31 | 0 | 0.26 | 0 | 0.23 | 0 | 0.22 | 0 | 0.27 | 4 | 0.22 | 5 | 0.18 | 0 |
| Sunflower | 0.20 | 0 | 0.19 | 0 | 0.17 | 0 | 0.16 | 0 | 0.18 | 0 | 0.16 | 0 | 0.14 | 0 |
Table 9.
Changes in crop yield with the adoption of an irrigation efficiency device for the baseline and projected climate scenarios for the periods 1976–2005, 2010–2039, 2040–2069, and 2070–2099.
Table 9.
Changes in crop yield with the adoption of an irrigation efficiency device for the baseline and projected climate scenarios for the periods 1976–2005, 2010–2039, 2040–2069, and 2070–2099.
| RCP 4.5 | RCP 8.5 | |||||||||||||
|---|---|---|---|---|---|---|---|---|---|---|---|---|---|---|
| 1976–2005 | 2010–2039 | 2040–2069 | 2070–2099 | 2010–2039 | 2040–2069 | 2070–2099 | ||||||||
| Crops | Y(t/h) | % | Y(t/h) | % | Y(t/h) | % | Y(t/h) | % | Y(t/h) | % | Y(t/h) | % | Y(t/h) | % |
| Maize | 4.47 | 0.2 | 3.59 | 0.5 | 2.94 | 0.3 | 2.70 | 0.4 | 3.57 | 0.3 | 2.55 | 0.4 | 1.66 | 0.6 |
| Soya beans | 0.66 | 0 | 0.57 | 0 | 0.51 | 0 | 0.49 | 0 | 0.58 | 0 | 0.48 | 0 | 0.40 | 0 |
| Dry beans | 0.31 | 0 | 0.26 | 0 | 0.23 | 0 | 0.22 | 0 | 0.26 | 0 | 0.21 | 0 | 0.18 | 0 |
| Sunflower | 0.20 | 0 | 0.19 | 0 | 0.17 | 0 | 0.16 | 0 | 0.18 | 0 | 0.16 | 0 | 0.14 | 0 |
Publisher’s Note: MDPI stays neutral with regard to jurisdictional claims in published maps and institutional affiliations. |
© 2020 by the authors. Licensee MDPI, Basel, Switzerland. This article is an open access article distributed under the terms and conditions of the Creative Commons Attribution (CC BY) license (http://creativecommons.org/licenses/by/4.0/).
Share and Cite
MDPI and ACS Style
Olabanji, M.F.; Ndarana, T.; Davis, N. Impact of Climate Change on Crop Production and Potential Adaptive Measures in the Olifants Catchment, South Africa. Climate 2021, 9, 6. https://0-doi-org.brum.beds.ac.uk/10.3390/cli9010006
AMA Style
Olabanji MF, Ndarana T, Davis N. Impact of Climate Change on Crop Production and Potential Adaptive Measures in the Olifants Catchment, South Africa. Climate. 2021; 9(1):6. https://0-doi-org.brum.beds.ac.uk/10.3390/cli9010006
Chicago/Turabian StyleOlabanji, Mary Funke, Thando Ndarana, and Nerhene Davis. 2021. "Impact of Climate Change on Crop Production and Potential Adaptive Measures in the Olifants Catchment, South Africa" Climate 9, no. 1: 6. https://0-doi-org.brum.beds.ac.uk/10.3390/cli9010006
Note that from the first issue of 2016, this journal uses article numbers instead of page numbers. See further details here.