Next Issue
Volume 9, February
Previous Issue
Volume 8, December


Climate, Volume 9, Issue 1 (January 2021) – 17 articles

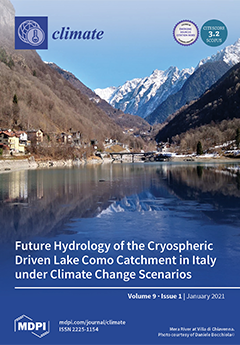
Cover Story (view full-size image): The goal of our study is to evaluate the effects of climate change upon the Lake Como inflows, to provide a tool to help policy makers to evaluate adaptation strategies, under the framework of the Interreg Project GE.RI.KO. MERA, focusing upon the Mera river. The Poli-Hydro model is used to simulate the cryospheric processes of this catchment. Model accuracy is demonstrated against historical hydrological observations (2002-2018). We then used four scenarios, provided by three GCMs under the IPCC AR6, to project potential climate change and hydrological impact until 2100. The climate projections highlight an increase in temperature at the end of the century, possibly leading to a decrease of the contribution of snow and ice melt. Overall, annual Lake inflows would increase during autumn and winter and decrease in summer. View this paper.
  • Issues are regarded as officially published after their release is announced to the table of contents alert mailing list.
  • You may sign up for e-mail alerts to receive table of contents of newly released issues.
  • PDF is the official format for papers published in both, html and pdf forms. To view the papers in pdf format, click on the "PDF Full-text" link, and use the free Adobe Reader to open them.
Order results
Result details
Section
Select all
Export citation of selected articles as:
20 pages, 9376 KiB  
Article
Impact on Renewable Design Requirements of Net-Zero Carbon Buildings under Potential Future Climate Scenarios
by Dongsu Kim, Heejin Cho, Pedro J. Mago, Jongho Yoon and Hyomun Lee
Climate 2021, 9(1), 17; https://0-doi-org.brum.beds.ac.uk/10.3390/cli9010017 - 19 Jan 2021
Cited by 6 | Viewed by 2965
Abstract
This paper presents an analysis to foresee renewable design requirement changes of net- zero carbon buildings (NZCBs) under different scenarios of potential future climate scenarios in the U.S. Northeast and Midwest regions. A climate change model is developed in this study using the [...] Read more.
This paper presents an analysis to foresee renewable design requirement changes of net- zero carbon buildings (NZCBs) under different scenarios of potential future climate scenarios in the U.S. Northeast and Midwest regions. A climate change model is developed in this study using the Gaussian random distribution method with monthly temperature changes over the whole Northeast and Midwest regions, which are predicted based on a high greenhouse gas (GHG) emission scenario (i.e., the representative concentration pathways (RCP) 8.5). To reflect the adoption of NZCBs potential in future, this study also considers two representative future climate scenarios in the 2050s and 2080s of climate change years in the U.S. Northeast and Midwest regions. An office prototype building model integrates with an on-site photovoltaics (PV) power generation system to evaluate NZCB performance under the climate change scenarios with an assumption of a net-metering electricity purchase agreement. Appropriate capacities of the on-site PV system needed to reach NZCB balances are determined based on the building energy consumption impacted by the simulated climate scenarios. Results from this study demonstrated the emission by electricity consumption increases as moving toward the future scenarios of up to about 25 tons of CO2-eq (i.e., about 14% of the total CO2-eq produced by the electricity energy source) and the PV installation capacity to offset the emission account for the electricity consumption increases significantly up to about 40 kWp (i.e., up to more than 10% of total PV installation capacities) as the different climate scenarios are applied. It is concluded that the cooling energy consumption of office building models would significantly impact GHG emission as future climate scenarios are considered. Consequently, designers of NZCBs should consider high performance cooling energy systems in their designs to reduce the renewable energy generation system capacity to achieve net-zero carbon emission goals. Full article
Show Figures

Figure 1

13 pages, 3815 KiB  
Article
Predicted Future Benefits for an Endemic Rodent in the Irano-Turanian Region
by Suzanna E. J. Meeussen and Anouschka R. Hof
Climate 2021, 9(1), 16; https://0-doi-org.brum.beds.ac.uk/10.3390/cli9010016 - 18 Jan 2021
Cited by 2 | Viewed by 2663
Abstract
Climate change is expected to have an impact on the geographical distribution ranges of species. Endemic species and those with a restricted geographic range may be especially vulnerable. The Persian jird (Meriones persicus) is an endemic rodent inhabiting the mountainous areas [...] Read more.
Climate change is expected to have an impact on the geographical distribution ranges of species. Endemic species and those with a restricted geographic range may be especially vulnerable. The Persian jird (Meriones persicus) is an endemic rodent inhabiting the mountainous areas of the Irano-Turanian region, where future desertification may form a threat to the species. In this study, the species distribution modelling algorithm MaxEnt was used to assess the impact of future climate change on the geographic distribution range of the Persian jird. Predictions were made under two Representative Concentration Pathways and five different climate models for the years 2050 and 2070. It was found that both bioclimatic variables and land use variables were important in determining potential suitability of the region for the species to occur. In most cases, the future predictions showed an expansion of the geographic range of the Persian jird which indicates that the species is not under immediate threat. There are however uncertainties with regards to its current range. Predictions may therefore be an over or underestimation of the total suitable area. Further research is thus needed to confirm the current geographic range of the Persian jird to be able to improve assessments of the impact of future climate change. Full article
(This article belongs to the Special Issue Impacts of Climate Change on Species)
Show Figures

Figure 1

22 pages, 2139 KiB  
Article
Promoting Low-Carbon Tourism through Adaptive Regional Certification
by Alex Baumber, John Merson and Chris Lockhart Smith
Climate 2021, 9(1), 15; https://0-doi-org.brum.beds.ac.uk/10.3390/cli9010015 - 14 Jan 2021
Cited by 7 | Viewed by 4006
Abstract
Climate change is a key issue in sustainable tourism, both in terms of the greenhouse gas emissions generated by the tourism sector and the potential impacts of climate change on tourism-dependent regions. Low-carbon tourism is an emerging paradigm based around emissions reduction by [...] Read more.
Climate change is a key issue in sustainable tourism, both in terms of the greenhouse gas emissions generated by the tourism sector and the potential impacts of climate change on tourism-dependent regions. Low-carbon tourism is an emerging paradigm based around emissions reduction by tourism businesses, as well as broader values of adaptation, transition and behavioral change. This article presents the results of a low-carbon tourism case study in the Blue Mountains of New South Wales, Australia, where the Low-Carbon Living Program has successfully designed and implemented a low-carbon rating and certification scheme. This scheme covers emissions related to energy, waste and water and is based on regionally-specific data. The program has also succeeded in its aim of using the tourism industry as a catalyst for broader community action, having been expanded to schools and retailers in the case study region. A transferable regional model has been developed that is being adapted for use in new regions under a modular and decentralised program structure. However, questions remain around the impact of the program on participants’ carbon footprints and customer levels over time, as well as the suitability of a common scorecard system to diverse participant types. Full article
(This article belongs to the Section Climate Adaptation and Mitigation)
Show Figures

Figure 1

17 pages, 1327 KiB  
Article
Excess Mortality in England during the 2019 Summer Heatwaves
by Natasha Rustemeyer and Mark Howells
Climate 2021, 9(1), 14; https://0-doi-org.brum.beds.ac.uk/10.3390/cli9010014 - 14 Jan 2021
Cited by 8 | Viewed by 4244
Abstract
There is increasing evidence that rising temperatures and heatwaves in the United Kingdom are associated with an increase in heat-related mortality. However, the Public Health England (PHE) Heatwave mortality monitoring reports, which use provisional death registrations to estimate heat-related mortality in England during [...] Read more.
There is increasing evidence that rising temperatures and heatwaves in the United Kingdom are associated with an increase in heat-related mortality. However, the Public Health England (PHE) Heatwave mortality monitoring reports, which use provisional death registrations to estimate heat-related mortality in England during heatwaves, have not yet been evaluated. This study aims to retrospectively quantify the impact of heatwaves on mortality during the 2019 summer period using daily death occurrences. Second, using the same method, it quantifies the heat-related mortality for the 2018 and 2017 heatwave periods. Last, it compares the results to the estimated excess deaths for the same period in the PHE Heatwave mortality monitoring reports. The number of cumulative excess deaths during the summer 2019 heatwaves were minimal (161) and were substantially lower than during the summer 2018 heatwaves (1700 deaths) and summer 2017 heatwaves (1489 deaths). All findings were at variance with the PHE Heatwave mortality monitoring reports which estimated cumulative excess deaths to be 892, 863 and 778 during the heatwave periods of 2019, 2018 and 2017, respectively. Issues are identified in the use of provisional death registrations for mortality monitoring and the reduced reliability of the Office for National Statistics (ONS) daily death occurrences database before 2019. These findings may identify more reliable ways to monitor heat mortality during heatwaves in the future. Full article
Show Figures

Figure 1

20 pages, 1622 KiB  
Article
The Influence of Socioeconomic Factors on Households’ Vulnerability to Climate Change in Semiarid Towns of Mopani, South Africa
by Musa Yusuf Jimoh, Peter Bikam and Hector Chikoore
Climate 2021, 9(1), 13; https://0-doi-org.brum.beds.ac.uk/10.3390/cli9010013 - 13 Jan 2021
Cited by 8 | Viewed by 11065
Abstract
The changing climate and its current rate, frequency, as well as its life-threatening impacts are undoubtedly abnormal and globally worrisome. Its effects are expected to be severely different across segments of the society. It is disposed to leaving no facet of human endeavor [...] Read more.
The changing climate and its current rate, frequency, as well as its life-threatening impacts are undoubtedly abnormal and globally worrisome. Its effects are expected to be severely different across segments of the society. It is disposed to leaving no facet of human endeavor immune, particularly in vulnerable cities of developing countries where there is dearth of empirical studies. For the context-specific nature of climate change impacts and place-based character of vulnerability, this study explores the influence of socioeconomic attributes on household vulnerability in Mopani District northeast of South Africa to provide basis for targeting, formulating, evaluating, and monitoring adaptation policies, programs, and projects. The study adopted a multistage random sampling to draw 500 households from six towns in Mopani District, Limpopo Province. Mixed methods approach was used for data collection, while Household Vulnerability Index (HVI) was estimated using principal component analysis and regressed with socioeconomic attributes. The study reveals that climate is changing with high HVI across selected towns. It further depicted that age and marital status have positive and significant relationships with HVI, while gender and educational levels have inverse and significant relationship with HVI in some towns. The study recommends the need for municipalities to partner with private sector to empower household and mainstream micro level coping strategies in urban planning across the district. Full article
(This article belongs to the Section Policy, Governance, and Social Equity)
Show Figures

Figure 1

18 pages, 1237 KiB  
Review
Flood Vulnerability Analysis in Urban Context: A Socioeconomic Sub-Indicators Overview
by Velia Bigi, Elena Comino, Magda Fontana, Alessandro Pezzoli and Maurizio Rosso
Climate 2021, 9(1), 12; https://0-doi-org.brum.beds.ac.uk/10.3390/cli9010012 - 09 Jan 2021
Cited by 23 | Viewed by 5036
Abstract
Despite indicators-based assessment models for flood vulnerability being a well-established methodology, a specific set of indicators that are universally or widely accepted has not been recognized yet. This work aims to review previous studies in the field of vulnerability analysis in order to [...] Read more.
Despite indicators-based assessment models for flood vulnerability being a well-established methodology, a specific set of indicators that are universally or widely accepted has not been recognized yet. This work aims to review previous studies in the field of vulnerability analysis in order to overcome this knowledge gap identifying the most accepted sub-indicators of exposure, sensitivity and adaptive capacity. Moreover, this review aims to clarify the use of the terms of vulnerability and risk in vulnerability assessment. Throughout a three-phase process, a matrix containing all the sub-indicators encountered during the review process was constructed. Then, based on an adaptation of the Pareto diagram, a set of the most relevant sub-indicators was identified. According to the citation count of each sub-indicator, indeed, 33 sub-indicators were chosen to represent the most universally or widely accepted sub-indicators. Full article
(This article belongs to the Special Issue Flood Risk Analysis and Assessment)
Show Figures

Figure 1

17 pages, 15522 KiB  
Article
Increasing Trend on Storm Wave Intensity in the Western Mediterranean
by Khalid Amarouche and Adem Akpınar
Climate 2021, 9(1), 11; https://0-doi-org.brum.beds.ac.uk/10.3390/cli9010011 - 08 Jan 2021
Cited by 30 | Viewed by 4026
Abstract
Annual trends in storm wave intensity over the past 41 years were evaluated during the present study. Storm wave intensity is evaluated in terms of total storm wave energy (TSWE) and storm power index (SPI) of Dolan and Davis (1992). Using an accurate [...] Read more.
Annual trends in storm wave intensity over the past 41 years were evaluated during the present study. Storm wave intensity is evaluated in terms of total storm wave energy (TSWE) and storm power index (SPI) of Dolan and Davis (1992). Using an accurate long-term wave hindcast developed using a calibrated SWAN model, all storm wave events occurring over the past 41 years were characterized in terms of significant wave height (Hs) and total storm duration. Thus, both SPI and TSWE was computed for each storm wave event. The Theil–Sen slope estimator was used to estimate the annual slopes of the SPI and TSWE and the Mann–Kendall test was used to test the trend significance with different confidence levels. The present study is spatially performed for the western Mediterranean Sea basin considering 2308 grid points in a regular grid of 0.198° resolution in both directions. Results allow as to define five hotspots covering a large area, experienced a significant increasing slope in both SPI and TSWE (annual maxima and average). The confidence level in this area exceed 95%, with a steep slope between 100 kWh·m−1·year−1 and 240 kWh·m−1·year−1 for annual max TSWE and between 28 m²·h·year−1 and 49 m²·h·year−1 for annual max SPI. Consideration of the present findings is strongly recommended for risk assessment and for sustainable development in coastal and offshore area and to identify areas sensitive to global climate change in the western Mediterranean Sea. Full article
(This article belongs to the Special Issue Wave Climate)
Show Figures

Figure 1

21 pages, 30311 KiB  
Article
Climate Change and Thermal Comfort in Greece
by Harry D. Kambezidis, Basil E. Psiloglou, Konstantinos V. Varotsos and Christos Giannakopoulos
Climate 2021, 9(1), 10; https://0-doi-org.brum.beds.ac.uk/10.3390/cli9010010 - 08 Jan 2021
Cited by 9 | Viewed by 3255
Abstract
Global warming is an environmental issue keeping all nations alert. Under this consideration, the present work investigates the future thermal sensation of the Greek population. Three periods are selected (2021–2050, 2046–2075, 2071–2100) and two Intergovernmental Panel for Climate Change (IPCC) representative concentration pathway [...] Read more.
Global warming is an environmental issue keeping all nations alert. Under this consideration, the present work investigates the future thermal sensation of the Greek population. Three periods are selected (2021–2050, 2046–2075, 2071–2100) and two Intergovernmental Panel for Climate Change (IPCC) representative concentration pathway (RCP) 4.5 and 8.5 scenarios. Use of Thom’s discomfort index (TDI) is made, which is calculated from air temperature and relative humidity included in typical meteorological years (TMYs) derived for 1985–2014 and future periods (both IPCC scenarios) for 33 locations in Greece. TDI is discriminated into 6 classes. The analysis shows that there is no significant shift from past to future annual mean TDIs in terms of its classification. The same is found for the summer TDI values. Nevertheless, a distribution of the various TDI classes is provided within the TMYs. Maps of annual TDI values are prepared for Greece by using the kriging method; higher values are found in the southern part of Greece and lower values in the northern. Best-fit regression equations derived show the intra-annual TDI variation in all periods. Also, scatter plots of annual TDIs in the future epochs in comparison with the historical period show a linear relationship. Full article
(This article belongs to the Special Issue Human-Induced Climate Change: Truths and Controversies)
Show Figures

Figure 1

18 pages, 2752 KiB  
Article
Impacts of Global Warming of 1.5, 2.0 and 3.0 °C on Hydrologic Regimes in the Northeastern U.S.
by Ridwan Siddique, Alfonso Mejia, Naoki Mizukami and Richard N. Palmer
Climate 2021, 9(1), 9; https://0-doi-org.brum.beds.ac.uk/10.3390/cli9010009 - 07 Jan 2021
Cited by 7 | Viewed by 2760
Abstract
Regional climate change impacts show a wide range of variations under different levels of global warming. Watersheds in the northeastern region of the United States (NEUS) are projected to undergo the most severe impacts from climate change in the forms of extreme precipitation [...] Read more.
Regional climate change impacts show a wide range of variations under different levels of global warming. Watersheds in the northeastern region of the United States (NEUS) are projected to undergo the most severe impacts from climate change in the forms of extreme precipitation events, floods and drought, sea level rise, etc. As such, there is high possibility that hydrologic regimes in the NEUS may be altered in the future, which can be absolutely devastating for managing water resources and ecological balance across different watersheds. In this study, we present a comprehensive impact analysis using different hydrologic indicators across selected watersheds in the NEUS under different thresholds of global temperature increases (1.5, 2.0 and 3.0 °C). Precipitation and temperature projections from fourteen downscaled Global Circulation Models (GCMs) under the representative concentration pathway (RCP) 8.5 greenhouse gas concentration pathway are used as inputs into a distributed hydrological model to obtain future streamflow conditions. Overall, the results indicate that the majority of the selected watersheds will enter a wetter regime, particularly during the months of winter, while flow conditions during late summer and fall indicate a dry future under all three thresholds of temperature increase. The estimation of time of emergence of new hydrological regimes show large uncertainties under 1.5 and 2.0 °C global temperature increases; however, most of the GCM projections show a strong consensus that new hydrological regimes may appear in the NEUS watersheds under 3.0 °C temperature increase. Full article
(This article belongs to the Section Climate Dynamics and Modelling)
Show Figures

Figure 1

24 pages, 6619 KiB  
Article
Future Hydrology of the Cryospheric Driven Lake Como Catchment in Italy under Climate Change Scenarios
by Flavia Fuso, Francesca Casale, Federico Giudici and Daniele Bocchiola
Climate 2021, 9(1), 8; https://0-doi-org.brum.beds.ac.uk/10.3390/cli9010008 - 06 Jan 2021
Cited by 13 | Viewed by 6095
Abstract
We present an assessment of climate change impact on the hydrology of the Lago di Como lake catchment of Italy. On one side, the lake provides water for irrigation of the Po valley during summer, and on the other side its regulation is [...] Read more.
We present an assessment of climate change impact on the hydrology of the Lago di Como lake catchment of Italy. On one side, the lake provides water for irrigation of the Po valley during summer, and on the other side its regulation is crucial to prevent flood risk, especially in fall and winter. The dynamics of lake Como are linked to the complex cryospheric hydrology of its Alpine contributing catchment, which is in turn expected to change radically under prospective global warming. The Poli-Hydro model is used here to simulate the cryospheric processes affecting the hydrology of this high-altitude catchment. We demonstrated the model’s accuracy against historical hydrological observations, available during 2002–2018. We then used four Representative Concentration Pathways scenarios, provided by three Global Circulation Models under the AR6 of IPCC, to project potential climate change until 2100. We thereby derived daily series of rainfall and temperature, to be used as inputs for hydrological simulations. The climate projections here highlight a substantial increase in temperature at the end of the century, between +0.61° and +5.96°, which would lead to a decrease in the total ice volume in the catchment, by −50% to −77%. Moreover, there would be a decrease in the contribution of snow melt to the annual lake inflow, and an increase in ice melt under the worst-case scenarios. Overall, the annual Lake inflows would increase during autumn and winter and would decrease in summer. Our study may provide a tool to help policy makers to henceforth evaluate adaptation strategies in the area. Full article
Show Figures

Figure 1

14 pages, 324 KiB  
Review
Sociological Perspectives on Climate Change and Society: A Review
by Md Saidul Islam and Edson Kieu
Climate 2021, 9(1), 7; https://0-doi-org.brum.beds.ac.uk/10.3390/cli9010007 - 04 Jan 2021
Cited by 10 | Viewed by 25056
Abstract
Society is at an important intersection in dealing with the challenges of climate change, and this paper is presented at a critical juncture in light of growing recognition that the natural sciences are insufficient to deal with these challenges. Critical aspects of sociological [...] Read more.
Society is at an important intersection in dealing with the challenges of climate change, and this paper is presented at a critical juncture in light of growing recognition that the natural sciences are insufficient to deal with these challenges. Critical aspects of sociological perspectives related to climate change research are brought together in this review in the hope of fostering greater interdisciplinary collaboration between the natural and social sciences. We fervently argue for the need to inculcate interdisciplinary approaches that can provide innovative perspectives and solutions to the challenges we face from the impacts of climate change. As such, some critical sociological perspectives are addressed, with two objectives: (a) to provide a foundational opening for readers seeking an introductory perspective and potential core contributions of sociological insights on climate change; and (b) to explore opportunities and obstacles that may occur with increased interdisciplinary cooperation and collaboration. We lay out fundamental ideas by assembling a loosely connected body of sociological research, hoping to develop and advance the collaborative research agenda between sociology and other disciplines for the near future. Full article
(This article belongs to the Special Issue Anthropogenic Climate Change: Social Science Perspectives)
Show Figures

Figure 1

19 pages, 2445 KiB  
Article
Impact of Climate Change on Crop Production and Potential Adaptive Measures in the Olifants Catchment, South Africa
by Mary Funke Olabanji, Thando Ndarana and Nerhene Davis
Climate 2021, 9(1), 6; https://0-doi-org.brum.beds.ac.uk/10.3390/cli9010006 - 31 Dec 2020
Cited by 16 | Viewed by 10745
Abstract
Climate change is expected to substantially reduce future crop yields in South Africa, thus affecting food security and livelihood. Adaptation strategies need to be implemented to mitigate the effect of climate change-induced yield losses. In this paper, we used the WEAP-MABIA model, driven [...] Read more.
Climate change is expected to substantially reduce future crop yields in South Africa, thus affecting food security and livelihood. Adaptation strategies need to be implemented to mitigate the effect of climate change-induced yield losses. In this paper, we used the WEAP-MABIA model, driven by six CORDEX climate change data for representative concentration pathways (RCPs) 4.5 and 8.5, to quantify the effect of climate change on several key crops, namely maize, soya beans, dry beans, and sunflower, in the Olifants catchment. The study further investigated climate change adaptation such as the effects of changing planting dates with the application of full irrigation, rainwater harvesting, deficit irrigation method, and the application of efficient irrigation devices on reducing the impact of climate change on crop production. The results show that average monthly temperature is expected to increase by 1 °C to 5 °C while a reduction in precipitation ranging between 2.5% to 58.7% is projected for both RCP 4.5 and RCP 8.5 relative to the baseline climate for 1976–2005, respectively. The results also reveal that increased temperature and decreased precipitation during planting seasons are expected to increase crop water requirements. A steady decline in crop yield ranging between 19–65%, 11–38%, 16–42%, and 5–30% for maize, soya beans, dry beans, and sunflower, respectively, is also projected under both RCPs climate change scenarios. The study concludes that adaptation measures such as the integration of changing planting dates with full irrigation application and the use of rainwater harvest will help improve current and future crop production under the impact of climate change. Full article
(This article belongs to the Special Issue Climate Change and Food Insecurity)
Show Figures

Graphical abstract

14 pages, 1051 KiB  
Review
The Agro-Meteorological Caused Famines as an Evolutionary Factor in the Formation of Civilisation and History: Representative Cases in Europe
by Ioannis Charalampopoulos and Fotoula Droulia
Climate 2021, 9(1), 5; https://0-doi-org.brum.beds.ac.uk/10.3390/cli9010005 - 31 Dec 2020
Cited by 9 | Viewed by 3729
Abstract
Throughout history, food adequacy has been one of the most critical parameters for the survival of human societies. The prevailing atmospheric conditions have always been recognised as the primary and most uncontrolled factors that determine crop production, both quantitatively and qualitatively. However, this [...] Read more.
Throughout history, food adequacy has been one of the most critical parameters for the survival of human societies. The prevailing atmospheric conditions have always been recognised as the primary and most uncontrolled factors that determine crop production, both quantitatively and qualitatively. However, this is only a part of the effects chain. In order to assess the magnitude of the potential cultural impacts of weather changes in a region, it is crucial to comprehend the underlying mechanism of successive consequences that relate the proximate causes, which in our case are the adverse Agro-Meteorological Conditions (AMC), to their effects on society. The present study focuses on the analysis of the impacts’ mechanism on human societies. Moreover, several characteristic agro-meteorological events that have led to significant changes in European civilisation are presented as case studies. The results highlight the linkage between weather and its impact on history evolution based on Agro-Meteorological Famine (AMF). The proposed concept and its analysis by the schematic presentation are in corroboration with the documented historical events of European history. Moreover, the presented connections between weather, agricultural production, and society revealed the significant contribution of the short-term adverse weather conditions on the mechanism of the human civilisation evolution. Full article
Show Figures

Figure 1

18 pages, 1277 KiB  
Article
Determinants of Household-Level Coping Strategies and Recoveries from Riverine Flood Disasters: Empirical Evidence from the Right Bank of Teesta River, Bangladesh
by Md. Sanaul Haque Mondal, Takehiko Murayama and Shigeo Nishikizawa
Climate 2021, 9(1), 4; https://0-doi-org.brum.beds.ac.uk/10.3390/cli9010004 - 29 Dec 2020
Cited by 18 | Viewed by 3853
Abstract
Although recurrent floods cause detrimental impact for the people living in riverine floodplains, households are taking up various risks management strategies to deal with them. This paper examined household’s post-disaster coping strategies to respond and recover from riverine floods in 2017. Data were [...] Read more.
Although recurrent floods cause detrimental impact for the people living in riverine floodplains, households are taking up various risks management strategies to deal with them. This paper examined household’s post-disaster coping strategies to respond and recover from riverine floods in 2017. Data were collected through a questionnaire survey from 377 households from the right bank of Teesta River in Bangladesh. Households employed different coping strategies including borrowing money, assets disposal, consumption reduction, temporary migration, and grants from external sources, to cope with flood. Results from logistic regression models suggested that increasing severity of flood reduced households’ consumption. Exposed households were more likely to borrow money. Consumption reduction and temporary migration were mostly adopted by agricultural landless households. Income from nonfarm sources was found to be an important factor influencing household’s decisions on coping. Furthermore, households that recovered from the last flood disaster seek insurance through their own savings and available physical assets, highlighting the role of disaster preparedness in resilient recovery. This study calls for the policy intervention at the household-level to enhance the adaptive capacity of riverine households so that people at risk can cope better and recover from flood disaster using their resources. Full article
(This article belongs to the Special Issue Climate Resilient Cities and Communities)
Show Figures

Figure 1

9 pages, 549 KiB  
Article
Forest Resource Management and Its Climate-Change Mitigation Policies in Taiwan
by Wen-Tien Tsai
Climate 2021, 9(1), 3; https://0-doi-org.brum.beds.ac.uk/10.3390/cli9010003 - 29 Dec 2020
Cited by 5 | Viewed by 2882
Abstract
Based on high carbon emissions in recent years (i.e., about 11 metric tons in 2018) per capita in terms of carbon dioxide equivalents, Taiwan has actively development greenhouse gas (GHG) reduction action plans. One of the action plans has been to promote afforestation [...] Read more.
Based on high carbon emissions in recent years (i.e., about 11 metric tons in 2018) per capita in terms of carbon dioxide equivalents, Taiwan has actively development greenhouse gas (GHG) reduction action plans. One of the action plans has been to promote afforestation and reforestation in non-forested lands for carbon sequestration. Thus, this paper aims to address the forest resources in Taiwan by using the latest national survey, reporting on an interactive analysis of forest carbon sequestration, GHG emissions, and climate-change mitigation policies. In this regard, the methodology is based on the official websites of forest resources, GHG emissions, and carbon sequestration from the yearbooks, national statistics, and regulations relevant to the mitigation policies in the forestry sector. It is found that Taiwan’s forest area is estimated to be 2.197 million hectares, which corresponds to a total forest stock volume of about 502.0 million cubic meters. During the period of 1990–2018, the change in total carbon sequestration did not vary much (with the exception of 2009), decreasing from 23.4 million metric tons in 1990 to 21.4 million metric tons in 2018. Compared to the total carbon dioxide emissions (i.e., 102.4 million metric tons in 1990 and 282.8 million metric tons in 2018), the contribution to GHG mitigation in the forestry sector shows a declining trend. However, biomass (i.e., wood) carbon sequestration indicates a slight increase from 20.4 million metric tons in 2010 to 20.7 million metric tons in 2018 due to the afforestation policy. Obviously, regulatory policies, based on the Forestry Act and the Greenhouse Gas Reduction & Management Act in 2015, play a vital role in mitigating GHG emissions in Taiwan. The discussion on the regulations is further addressed to highlight climate-change mitigation policies in Taiwan’s forestry sector. Full article
Show Figures

Figure 1

22 pages, 1575 KiB  
Article
Kelvin/Rossby Wave Partition of Madden-Julian Oscillation Circulations
by Patrick Haertel
Climate 2021, 9(1), 2; https://0-doi-org.brum.beds.ac.uk/10.3390/cli9010002 - 25 Dec 2020
Cited by 8 | Viewed by 3180
Abstract
The Madden Julian Oscillation (MJO) is a large-scale convective and circulation system that propagates slowly eastward over the equatorial Indian and Western Pacific Oceans. Multiple, conflicting theories describe its growth and propagation, most involving equatorial Kelvin and/or Rossby waves. This study partitions MJO [...] Read more.
The Madden Julian Oscillation (MJO) is a large-scale convective and circulation system that propagates slowly eastward over the equatorial Indian and Western Pacific Oceans. Multiple, conflicting theories describe its growth and propagation, most involving equatorial Kelvin and/or Rossby waves. This study partitions MJO circulations into Kelvin and Rossby wave components for three sets of data: (1) a modeled linear response to an MJO-like heating; (2) a composite MJO based on atmospheric sounding data; and (3) a composite MJO based on data from a Lagrangian atmospheric model. The first dataset has a simple dynamical interpretation, the second provides a realistic view of MJO circulations, and the third occurs in a laboratory supporting controlled experiments. In all three of the datasets, the propagation of Kelvin waves is similar, suggesting that the dynamics of Kelvin wave circulations in the MJO can be captured by a system of equations linearized about a basic state of rest. In contrast, the Rossby wave component of the observed MJO’s circulation differs substantially from that in our linear model, with Rossby gyres moving eastward along with the heating and migrating poleward relative to their linear counterparts. These results support the use of a system of equations linearized about a basic state of rest for the Kelvin wave component of MJO circulation, but they question its use for the Rossby wave component. Full article
(This article belongs to the Special Issue Climate Change Dynamics and Modeling: Future Perspectives)
Show Figures

Figure 1

19 pages, 3088 KiB  
Article
Long-Term Changes and Variability of Ecologically-Based Climate Indices along an Altitudinal Gradient on the Qinghai-Tibetan Plateau
by Tong Guo
Climate 2021, 9(1), 1; https://0-doi-org.brum.beds.ac.uk/10.3390/cli9010001 - 24 Dec 2020
Cited by 3 | Viewed by 2776
Abstract
Extreme climate events are typically defined based on the statistical distributions of climatic variables; their ecological significance is often ignored. In this study, precipitation and temperature data from 78 weather stations spanning from 1960 to 2015 on the Qinghai-Tibetan Plateau were examined. Specifically, [...] Read more.
Extreme climate events are typically defined based on the statistical distributions of climatic variables; their ecological significance is often ignored. In this study, precipitation and temperature data from 78 weather stations spanning from 1960 to 2015 on the Qinghai-Tibetan Plateau were examined. Specifically, long-term and altitudinal variability in ecologically relevant climate indices and their seasonal differences was assessed. The results show that indices of daily temperatures greater than 10 °C and 25 °C show positive annual change trends during the growing season (May to September). Indices of daily rainfall greater than 2 mm, 3 mm and 5 mm positively alternate with years both in and around the growing season (May–September, April and October). In contrast, the index of daily snowfall greater than 2 mm shows opposite annual variability. Additionally, a higher altitude significantly leads to fewer days with temperature deviations above 20 °C, except for in October. The three abovementioned rainfall indices present significantly positive variability with increasing altitude during the growing season. In contrast, the snow index shows similar altitudinal changes in the months surrounding the growing season. This study allows us to better cope with the threats of climate change to vulnerable ecosystems. Full article
(This article belongs to the Section Climate and Environment)
Show Figures

Figure 1

Previous Issue
Next Issue
Back to TopTop