
Determinants of Smallholder Livestock Farmers’ Household Resilience to Food Insecurity in South Africa


Department of Agricultural Economics, University of the Free State, P.O. Box 339, Bloemfontein 9300, South Africa
*
Author to whom correspondence should be addressed.
Climate 2021, 9(7), 117; https://0-doi-org.brum.beds.ac.uk/10.3390/cli9070117
Submission received: 12 April 2021
/
Revised: 25 June 2021
/
Accepted: 2 July 2021
/
Published: 13 July 2021
(This article belongs to the Special Issue Climate Change and Food Insecurity)
Abstract
:This study identified factors affecting livestock farmers’ agricultural drought resilience to food insecurity in Northern Cape Province, South Africa. Data of 217 smallholder livestock farmers were used in a principal component analysis to estimate the agricultural drought resilience index. The structural equation approach was then applied to assess smallholder livestock farmers’ resilience to food insecurity. The study found that most smallholder livestock farmers (81%) were not resilient to agricultural drought. Assets (β = 0.150), social safety nets (β = 0.001), and adaptive capacity (β = 0.171) indicators positively impacted households’ resilience to food insecurity with 5% significance. Climate change indicators negatively impacted households’ resilience to food insecurity. Two variables were included under climate change, focusing on drought, namely drought occurrence (β = −0.118) and drought intensity (β = −0.021), which had a negative impact on household resilience to food insecurity with 10% significance. The study suggests that smallholder livestock farmers need assistance from the government and various stakeholders to minimize vulnerability and boost their resilience to food insecurity.
1. Introduction
Agriculture, including the livestock sector, is one of the industries on which drought has a major influence, causing loss of agricultural production. The impact of agricultural drought on livestock production is becoming a significant physical stressor in temperate and humid regions, including South Africa [1]. Agricultural drought impacts livestock production and quality, which is dependent on several factors, such as intensity, recurrent agricultural drought, vulnerability, water stress, and socio-economic factors [2]. Globally, agricultural drought is the costliest natural disaster compared to other natural disasters such as floods, hurricanes, tornadoes, and earthquakes. Loss caused by agricultural drought is estimated to cost from USD 6 to 8 billion annually [3]. An estimated 40 million people have been affected by drought in southern Africa, with a cereal deficit of 9.3 million tonnes recorded at the end of the 2015/16 cropping season [4,5]. The high regional deficit raised staple food prices and constrained the already limited purchasing power of vulnerable families. More than 643,000 livestock deaths were reported in five countries alone due to lack of feed and water and disease outbreaks in southern Africa. In addition, the income sources of many households were diminished due to the loss of crops, livestock, labor, trading, and self-employment activities [4,5]. During 2015, agricultural production in South Africa declined by 8.4% due to drought. The livestock industry, for example, had a 15% reduction in the national herd stock due to the drought [6].
Smallholders are characterized by labor-intensive farming, adoption of traditional production techniques, and inadequate institutional capacity and support [7]. Smallholder agriculture in general and the smallholder livestock sector in particular remain at the center of rural development policy discussions in Africa [8]. Smallholder agriculture plays a significant role and will contribute to feeding approximately 9 billion people worldwide by 2050, although there are still debates about the role of smallholder agriculture. The contribution of agriculture to poverty reduction depends on its own growth performance, its indirect impact on growth in other sectors, the extent to which poor people participate in the sector, and the sector’s size in the overall economy. Agriculture is significantly more effective than non-agriculture in reducing poverty among the poorest of the poor (as reflected by the USD 1/day squared poverty gap). It is also up to 3.2 times better at reducing USD 1/day headcount poverty in low-income and resource-rich countries (including those in Sub-Saharan Africa), at least when societies are fundamentally equal. However, when it comes to the better-off poor (reflected in the USD 2/day measure), non-agriculture has the edge [9].
Smallholder livestock farming contributes to improving the livelihoods of the rural poor in South Africa and plays a vital role by providing food and has the potential to strengthen households’ economy. Livestock production plays multiple roles in the lives of the poor and meets the various objectives desired by resource-poor farmers [10]. Smallholder agriculture, including the livestock sector in South Africa, has been identified as a notable vehicle to foster poverty reduction, solve household food insecurity, and enhance resilient livelihoods.
Even though smallholder agriculture has the potential to enhance resilience, the decline in average rainfall and rapid population growth have resulted in food insecurity [11]. In Sub-Saharan Africa, smallholder livestock farmers do not produce output beyond household consumption. Their output does not generate enough income nor do they engage in off-farm or non-farm income-generating activities, even in export. The insufficient production is further undermined by factors such as a lack of assets (resources), a lack of adaptive capacity, climate change (agricultural drought), a lack of social safety nets, increasing farm input prices, a lack of information, and inadequate institutional infrastructure [12,13].
International and national studies, such as those of Boukary et al. [11], Melketo et al. [14], Ogunniyi et al. [15], Chamdimba et al. [16], and Galarza [17], focus on the impact of Jatropha cultivation for resilience in food insecurity, pastoral households’ resilience, rural households’ resilience to food insecurity, drought impact, coping and adaptation, and socio-economic drivers of food security. However, none of the studies empirically assess smallholder livestock farmers’ resilience to food insecurity in the livestock sector.
To our knowledge, no studies have specifically focused on smallholder livestock farming households’ resilience to food insecurity. Therefore, this study identified factors affecting livestock farmers’ agricultural drought resilience to food insecurity in Northern Cape Province, South Africa, using a survey, principal component analysis, and structural equation approach. The findings of this study could help government and policymakers to develop suitable policies and mitigation strategies to build and boost smallholder livestock farmers’ resilience to agricultural drought with the alignment of the National Development Plan (NDP) of South Africa and the Sustainable Development Goal of ending hunger and poverty. The NDP considers small livestock producers as a strategy given the role of the livestock sector in food security. This work is original academic research carried out by the authors and part of an MSc dissertation by Vuyiseka A. Myeki [18] entitled “Factors affecting smallholder livestock farmers’ agricultural drought resilience to food insecurity in the Northern Cape, South Africa”. The University of the Free State, Bloemfontein, South Africa.
2. Literature Review and Conceptual Framework
The definitions and conceptual framework used to identify factors affecting livestock farmers’ agricultural drought resilience to food insecurity in Northern Cape Province, South Africa, were adopted from international and national studies/literature.
There are different definitions for resilience with shared characteristics [19,20,21,22]. However, nearly all definitions stress the common elements of resilience: ability, mitigation, adaptation, coping, recovery, withstanding shocks, resistance, and bouncing back against shocks. Resilience in this study is considered to be the ability of a household to “bounce back” after exposure to livelihood threats, shocks, or stressors (such as agricultural drought and vulnerability to food insecurity).
Household resilience to food insecurity is defined as the ability of a household to maintain a certain level of well-being (food security) when faced with agricultural drought, and depends on the options available to make a living, and on the ability to handle agricultural drought. Therefore, it refers to ex ante actions aimed at reducing or mitigating agricultural drought and ex post actions to cope with agricultural drought. Thus, the options available for a household to make a living and cope with agricultural drought will determine the resilience of the household [23]. In scenarios where the ecosystems that communities depend on during shocks are vulnerable and exhibit eroding resilience, it is evident that the coping and adaptive strategies tend to overlap. Therefore, the concept of resilience stresses the dynamic nature of agricultural drought and usefully categorizes resilience into absorptive, adaptive, and transformative capacities. Absorptive capacity highlights the ability to show an initial “persisting” response to cope with agricultural drought. Adaptive capacity reflects the ability to function consistently as before in the face of incremental changes in climate change shocks, including agricultural drought. Transformative capacity reflects the ability to show a substantial changing response to agricultural drought or prolonged disturbance, including value systems, regimes, financial systems, technological systems, and biological systems [24,25].
Further, it might involve improving infrastructure, supporting social protection mechanisms, providing basic social services, or developing institutional capacity. These changes might be voluntarily chosen or forced (such as conflict forcing people to flee their country). To be successful, these transformational changes typically require shifts in economic and social policies, land use legislation, and resource management practices, as well as inclusion of various institutions and social practices [24,25].
Food insecurity is defined as a household’s inability to meet target consumption levels in the face of shocks, such as agricultural drought [14]. In this paper, the concept of resilience to food insecurity refers to the adaptive capacity of smallholder livestock farmers in Northern Cape Province of South Africa.
Rockstrom [26] highlighted that social, economic, situational, and institutional preparedness to cope with stresses and shocks as well as their effects are the core mechanisms of household resilience to food insecurity. In addition, numerous studies have documented several factors determining the means and processes of achieving household resilience [27,28,29,30,31].
Various resilience analysis frameworks have been suggested [32]. However, Hoddinott [33] argues that the plethora of frameworks for resilience analysis have similar components. These include highlighting the broader environment in which a household (or individual or some other unit of observation) resides; the resources available to that household; how that household uses those resources; how the economic returns on those uses are affected by shocks that the household experiences; and how the outcomes of those uses lead to consumption of food and other goods and services, savings, health, nutritional status, and other such outcomes.
Therefore, resilience frameworks commonly guide studies on household resilience to food insecurity [14,34,35]. This study adopted an updated framework developed by Alinovi et al. [22,36]. Figure 1 presents the conceptual framework applied in this study. The selection of the framework is justified, because it is mainly proposed for analysis (Equations (5)–(7)) of households’ resilience to food security shocks such as agricultural drought. This framework elicits the extent of resilience-building variation from one household to another and that the variation is determined by diverse factors. Factors include assets (herd/flock size (HFS); agricultural assets (AA); non-agricultural assets (NAA)), adaptive capacity (perception; source of income (Incsource); migration; credit), social safety nets (cash; training; food support; water rights; garden equipment; sanitary latrines, farm input), climate change (occurrence and intensity of drought). The factors are associated with the outcome variable of the agricultural drought resilience index (ADRI) as illustrated in Figure 1 and Equations (5)–(7).
As shown in Figure 1 and Equation (5), the ADRI is calculated using principal component analysis (PCA) and variables related to livestock production and consumption with or without a drought season. Furthermore, as demonstrated in Figure 1 and Equations (6) and (7), the ADRI is determined using a structural equation model against independent variables as aggregate and disaggregate variables of assets, adaptive capacity, social safety nets, and climate change.
3. Materials and Methods
3.1. Description of the Study Area
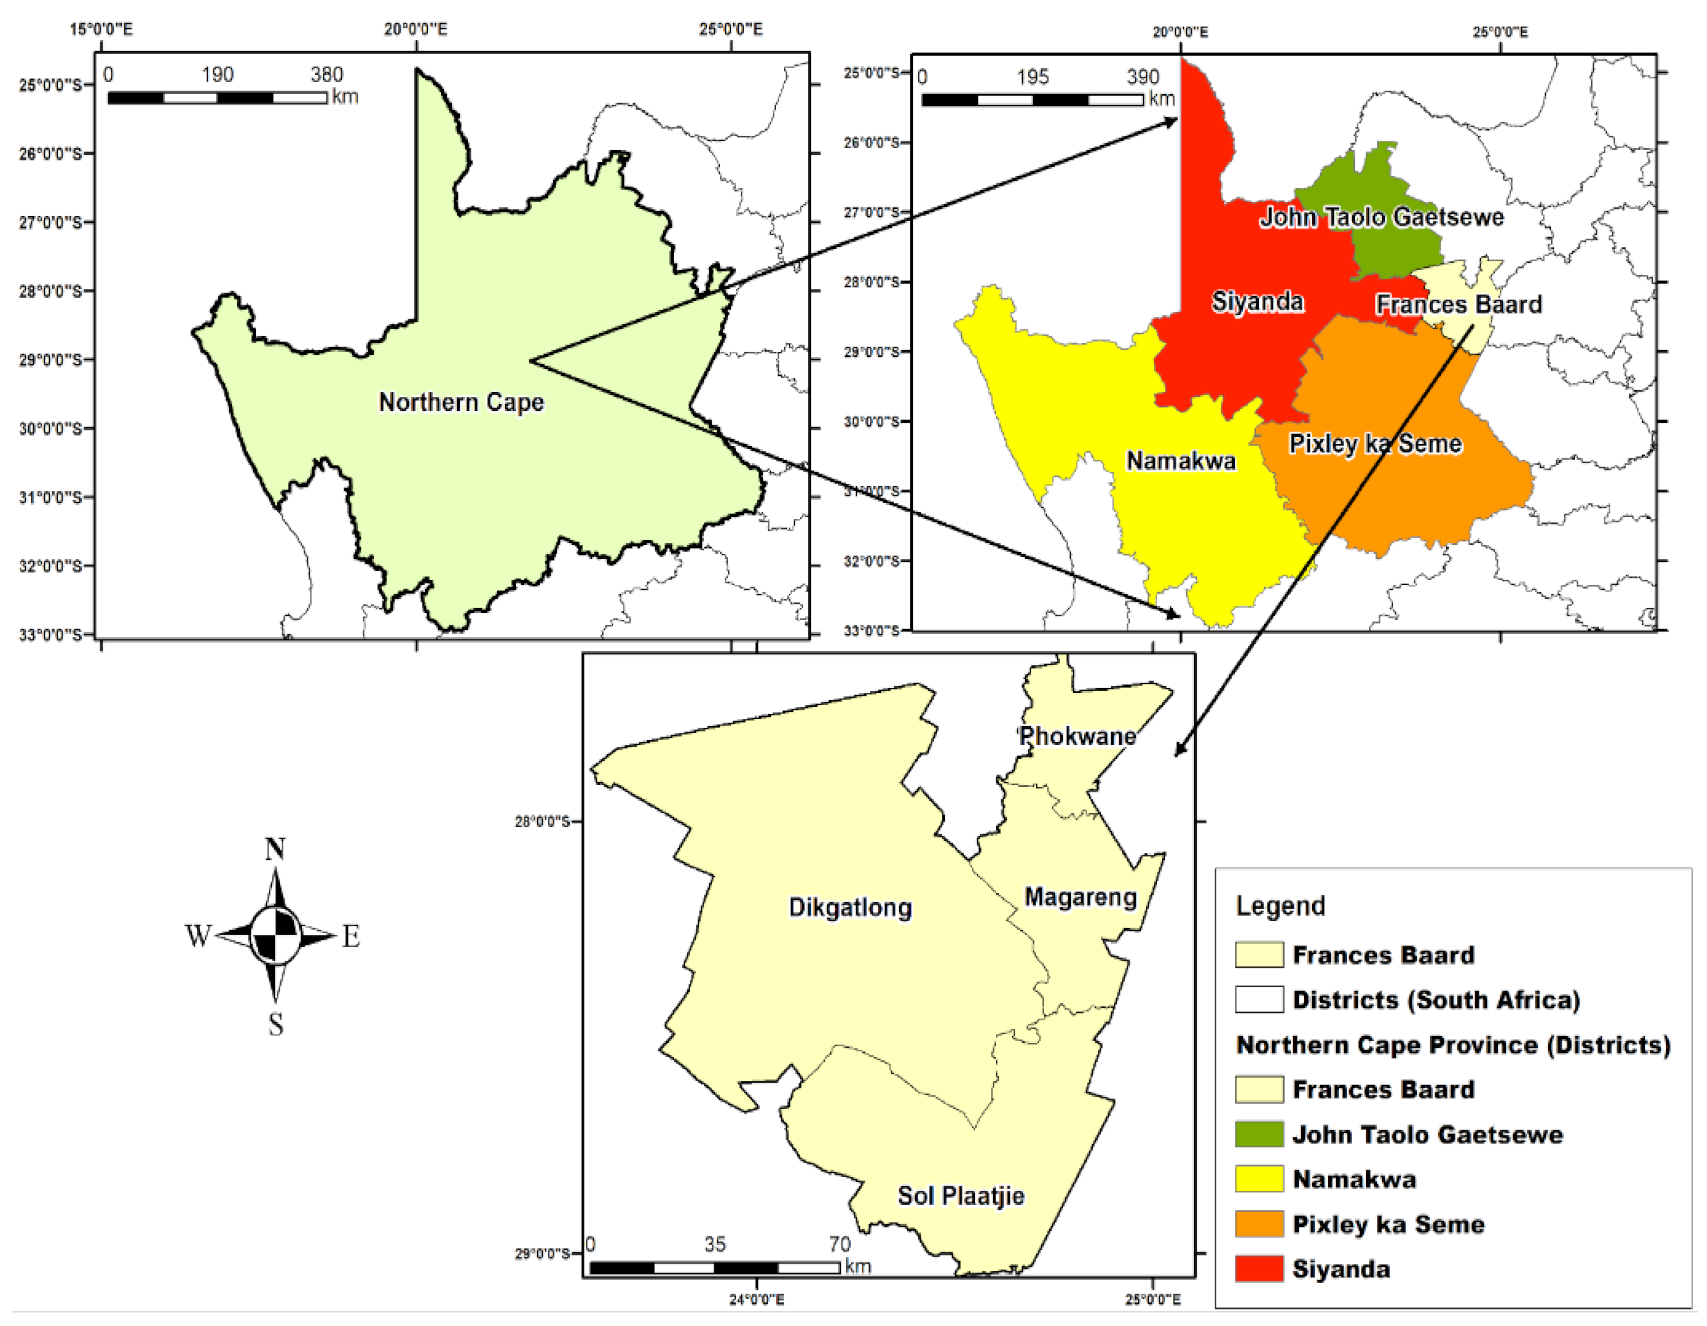
This study was conducted in Northern Cape Province of South Africa, in the Frances Baard District Municipality. The municipality’s total geographical area is 12,384 km2 and accounts for 3.4% of the total area of Northern Cape Province [37]. The study was conducted in the following four local municipalities: Sol Plaatje, Dikgatlong, Magareng, and Phokwane (Figure 2).
3.2. Sampling Procedure and Sample Size Determination
A multiple-stage sampling procedure was employed. Firstly, Northern Cape Province was chosen from the nine provinces of South Africa, because most households were involved in livestock production, and the province was declared a disaster zone by the South African Government due to agricultural drought. Secondly, four district municipalities in the province were randomly selected using balloting and included Dikgatlong, Magareng, Sol Plaatje, and Phokwane.
Appropriate sample sizes were calculated using the simple random sampling formulae of Cochran [39] and Bartlett et al. [40]. Subsequently, 217 smallholder livestock farmers were selected from 878 farmers registered for government and local government assistance during the 2015/2016 production season (Table 1); this season was the worst drought season in South African history [41]. The assistance from the government included feed and medication for livestock, strengthening access to agricultural credit and farm input, and enhancing smallholder farmers’ involvement in agricultural drought resilience activities by giving training and disseminating information.
A sample of 217 smallholder livestock farmers were interviewed. Cochran’s [40] sample size formula was applied to determine the correct sample size (Equation (1)):
where y is the level of confidence/alpha level, f and g are the estimates of the variance of the population, and z is the margin of error (5% (0.05)). Therefore (Equation (2)):
Resulting in a sample size of 288.3. Note that, if the sample size exceeds 5% of the population, the Cochran’s correctional formula should be applied (Equations (3) and (4)):
3.3. Data Collection
This research was qualitative and quantitative. Data were collected using a structured questionnaire and face-to-face interviews. The questionnaire included continuous and categorical data, which comprised socio-economic characteristics, livestock production, assets, adaptive capacity, climate change, social safety net, and other variables. Face-to-face interviews were conducted from October to December 2020 using a structured questionnaire (part of the questionnaire is available in Appendix A). Ethical clearance was obtained from the University of the Free State.
3.4. Analytical Procedures
3.4.1. Agricultural Drought Resilience Index (ADRI)
Principal component analysis (PCA) was used to construct the agricultural drought resilience index (ADRI). Production of livestock in a normal year (WnPn), production of livestock with agricultural drought (WdPd), the number of months a household consumes food produced by the household in a normal year (WcnMn), and the number of months a household consumes food produced by the household in agricultural drought (WcdMd) were aggregated in PCA to develop the ADRI. The ADRI formula is expressed as (Equation (5)):
where W represents each component as a weighted linear combination of the variables and is determined from the component loadings from principal components with a zero mean and unit variance.
ADRI = WnPn + WdPd + WcnMn + WcdMd
The four variables, production of livestock produced in a normal year (Pn), livestock produced in a year with agricultural drought (Pd), the number of months a household consumes food produced by the household in a normal year (Mn), and the number of months a household consumes food produced by the household in drought (Md), were analyzed using Bartlett’s test of sphericity and Kaiser–Meyer–Olkin (KMO) using SPSS software.
3.4.2. Structural Equation Modeling
A structural equation model was applied to the determinants of smallholder livestock farming households’ resilience to food insecurity (Table 2). The model applies a factor analysis-type model to measure the latent variables via observed variables, simultaneously using a regression-type model for the relationship among the latent variables [36,42]. The structural equation model for a household i is illustrated as (Equation (6)):
ADRIi = f(ASSi, ADCi, SSFi, CH)
Equation (6) is disaggregated in detail as (Equation (7)):
ADRIi = f(ASSi(herd/flock size (HFS); agricultural assets (AA); non-agricultural assets (NAA)), ADCi (perception; source of income (Incsource); migration; credit), SSFi (cash; training; food support; water rights; garden equipment; sanitary latrines, farm input), herd/flock size (HFS); CH (drought occurrence and intensity))
4. Results
4.1. Socio-Economic Characteristics of the Respondents
Table 3 depicts the socio-economic characteristics of the respondents. When it comes to farming, age is a debatable topic; the average age of the farmers was 52 years. The average formal education of smallholder livestock farmers was eight years (Table 3). The results show that 54% of the respondents had primary education, 42% secondary education, and only 4% had tertiary education.
An average of 11 years of farming experience was observed. As indicated in Table 3, the minimum length of farming experience was half a year, and the maximum was 60 years. The average number of household members was five, with a minimum of one and a maximum of 25 members. From the study’s findings, 61 (28%) of the respondents were women, while 156 (72%) were men.
The majority of the respondents were married (57%), 27% single, 9% widowed, 2% divorced, 1% separated, and the remaining respondents (4%) noted other (Table 3). The findings indicated that 51% of the respondents used their family savings to support their farming business, while 8% borrowed money and 41% used other ways of supporting their farming business. Farming is considered a business entity, and thus the majority of the smallholder livestock farmers (86%) depended solely on farming, and 14% owned additional businesses. In addition, only 5% of the respondents owned additional property as a source of income besides livestock farming.
4.2. Respondents’ Agricultural Drought Resilience Profile
As indicated, a PCA was applied to construct the outcome variable of the ADRI. Table 4 shows the communalities, component factors, and correlations of variables utilized when constructing the ADRI. All the initial commonalities were above 0.30, which was good. The component variance explained 94% of the total variance. The variables used in PCA were not inter-correlated, and Bartlett’s test of sphericity and Kaiser–Meyer–Olkin (KMO) were applied. Bartlett’s test of sphericity was significant (p-value = 0.000 with chi-square = 2224.837). As a result, the variables were suitability correlated, warranting the application of PCA, because the inter-correlation matrix did not derive from a population. The KMO was 0.64, which was above 0.5, showing that KMO was suitable for PCA. Therefore, the data set met both KMO and Bartlett’s sphericity test requirements and was considered suitable for dimension reduction using PCA.
As a result, Equation (5) is rewritten to estimate the ADRI (Equation (8)):
ADRI = PN ∗ 0.967 + PD ∗ 0.979 + Mn ∗ 0.963 + Md ∗ 0.977
Based on the findings using Equations (5) and (8), Table 5 presents the ADRI of the study area. An ADRI greater than zero represents households that were resilient to drought, while ADRI less than zero represents households that were not resilient. An estimated 81% (176) of the farming households were not resilient to agricultural drought.
4.3. Econometric Results (Structural Equation Modeling)
The ADRI as an outcome variable was regressed using Equation (6) at the aggregate level (general) and Equation (7) at disaggregate level against the explanatory variables to the determinants of smallholder livestock farmers’ household resilience to food insecurity. A structural equation modeling approach was applied to empirically assess smallholder livestock farmers’ resilience to food insecurity in Northern Cape Province of South Africa. The results in Table 6 (aggregated) and Table 7 (disaggregated) show that assets, adaptive capacity, safety nets, and climate change indicators significantly impacted households’ resilience to food insecurity. ADC (β = 0.171), ASS (β = 0.150), CH (β = 0.053), and SSF (β = 0.001) contributed to the regression model. Asset, SSF, and adaptive capacity indicators positively impacted households’ resilience to food insecurity and were significant at 5%. The variance inflation factor (VIF) statistics indicated that there was no multicollinearity problem in the analysis.
Households’ resilience to food insecurity in the Northern Cape was empirically assessed in detail (Table 7). The results indicated that HFS (β = 0.333), AA (β = 0.089), and NAA (β = −0.019) influenced households’ resilience to food insecurity. Herd/flock size (HFS) and AA indicators positively impacted households’ resilience to food insecurity. The HFS was the most crucial dimension compared to the other components of assets. Smallholder farmers used livestock as a coping and adaptation mechanism, because they sold livestock during agricultural drought to enhance their resilience.
Four dummy variables were used to estimate the resilience impact of adaptive capacity on food insecurity. The results in Table 7 showed that migration indicators positively impacted households’ resilience to food insecurity. Migration (β = 0.037), credit (β = −0.250), perception (β = −0.181), and income source (β = −0.122) contributed to the regression model.
The results in Table 7 showed that all the social safety net indicators had a positive and significant impact on households’ resilience to food insecurity. Cash (β = 0.044), training (β = 0.124), food support (β = 0.075), water rights (β = 0.111), garden equipment (β = 0.195), sanitary latrines (β = 0.037), and farm input (β = 0.145) contributed to the regression model.
The two variables that were included under climate change, focusing on drought, namely, drought occurrence and drought intensity, had a negative and significant impact at 10% on household resilience to food insecurity (Table 7). Drought occurrence (β = −0.118) and drought intensity (β = −0.021) contributed to the regression model.
5. Discussion
The socio-economic variables, such as age, gender, sex, marital status, access to credit, and assets, were the main factors determining the enhancement of resilience to agricultural drought. It is concerning that the average age of farmers was relatively high. It meant that fewer young people were farming and mostly joined other industries. This could be due to a lack of funding for start-up farmers and the negative stigmas surrounding agriculture as a career choice. This finding is supported by Meterlerkamp et al. [43], who found that one-third of young people show a positive attitude towards farming and choose agriculture as a career.
The male household heads spent more years in school than their female counterparts. This implied that the more educated and higher-skilled individuals were likely to be the least vulnerable to climate shocks such as agricultural drought. This is consistent with the finding of Brenda [44], who highlighted that, commonly, the more educated and higher-skilled individuals of a household are likely to be the least vulnerable to climate shocks such as agricultural drought and have more adaptive capacity than less-educated farmers, because they could obtain information about climate change to assess their situation.
Gender and its impact on social and economic aspects are essential for decision making. It is clear that there is a gender imbalance in farming, agreeing with the study of Matlou and Bahta [45]. Marital status is critical in the determination of the level of involvement in farming. Married household heads can make better decisions during agricultural drought with the assistance of their partners. This finding is in line with a study by Ngeywo et al. [46], who found that the youth who dedicate their energy to farming as a business are denied a chance to do so, because they believe they are not responsible enough if they are not married.
Access to credit or funding is the main challenge for smallholder farmers in Africa, including South Africa. The findings indicated that only a few respondents had access to credit. This finding is in line with the study of Bahta et al. [47]. They highlight that access to credit enhances the working capital of households and resilience to agricultural drought. The majority of the respondents depended on farming. Diversification of income helps to enhance the resilience of smallholder farmers when shocks (such as agricultural drought) occur. However, a minority of farmers owned additional property; this indicated that most smallholder farmers were not resilient to shocks such as agricultural drought. These findings concurred with the findings of Maltou and Bahta [45].
Results from the ADRI indicated that the majority of the respondents were not resilient to agricultural drought. This suggests that smallholder livestock farmers need assistance from the government and different stakeholders in industry to enhance their resilience. The assistance could be feed for livestock (fodder), medication for livestock, strengthening access to agricultural credit and farm input, as well as enhancing smallholder farmers’ involvement in agricultural drought resilience activities by giving training and disseminating information. This finding is in line with the study of Matlou and Bahta [45].
The structural equation modeling result indicated that assets, adaptive capacity, safety nets, and climate change indicators significantly impacted households’ resilience to food insecurity. This implied that the more assets a farming household owned, the higher the resilience to agricultural drought. These findings are consistent with literature stating that having more assets may increase a household’s resilience to food insecurity [11,13,14,15,16,48]. Further, the literature also indicates that resilience is the key to enhancing adaptive capacity [49].
The social safety net refers to benefits and protects vulnerable households from the risk of food insecurity. All the social safety net indicators (cash, training, food support, water rights, garden equipment, sanitary latrines, and farm input) had a positive and significant impact on households’ resilience to food insecurity. The finding indicates that benefiting from the social safety net provides support for individual households. Our findings concurred with Mane et al. [50], Boukary et al. [11], Szabo et al. [48], and Shah and Dulal [51].
Climate change (drought occurrence and intensity) had a negative and significant impact on household resilience to food insecurity. Indeed, the Northern Cape climate is characterized by hot summers (between 34 °C and 40 °C) and cold winters (below zero nightfall temperatures and frost). Coupled with low rainfall (mean annual precipitation of 200 mm), the climate is consistently dry, which leads to the reduction of livestock production. The findings concur with Shah and Dulal [51], who indicated that a climate shock such as agricultural drought affects food production.
6. Conclusions
This study identified factors affecting livestock farmers’ agricultural drought resilience to food insecurity in Northern Cape Province, South Africa. A principal component analysis was applied to estimate the agricultural drought resilience index. A structural equation model was then applied using a survey of 217 smallholder livestock farmers.
The study found that most (81%) smallholder livestock farmers were not resilient to agricultural drought. The study also showed that asset, social safety net, and adaptive capacity indicators positively and significantly impacted households’ resilience to food insecurity. However, climate change indicators had a negative and significant impact on households’ resilience to food insecurity. This implied that the more assets a farming household owned, the higher the resilience to agricultural drought. The findings further indicated that benefiting from the social safety net provided support for individual households. Indeed, the Northern Cape climate is characterized by hot summers (between 34 °C and 40 °C) coupled with low rainfall (mean annual precipitation of 200 mm). The climate is consistently dry, which leads the reduction of livestock production. As a result, the government needs to strengthen the drought relief program for affected smallholder farmers by supplying fodder, medication, and farming inputs, and strengthening access to agricultural credit.
The study suggests that smallholder livestock farmers need assistance from the government and various stakeholders to minimize vulnerability and boost their resilience to food insecurity. They should target disadvantaged smallholder farmers to build their resilience by enhancing their persistence and adaptability. The government may help smallholder livestock farmers to gather resources to acquire more assets and reduce vulnerability to food insecurity via strengthening access to agricultural credit and farm input. Additionally, the government should address viable off-farm employment as a source of income, and strengthen social safety nets, which include smallholder farmers’ involvement in agricultural drought resilience activities by giving training and disseminating information.
Furthermore, the government could improve water rights and access to boost the resilience of smallholder farmers to agricultural drought. This could be achieved through collaboration and coordination among all stakeholders. This includes coordination between monitoring agencies in terms of reliable early warning data, communicated in a comprehensive way to decision makers, farmers’ organizations such as the African Farmers’ Association of South Africa (AFASA; AFASA is very active in Northern Cape Province of South Africa), and the private sector, such as banks, to strengthen the resilience of farmers against shocks.
Collaboration with national and provincial governmental departments should also be strengthened. This includes collaboration with the Department of Agriculture, Forestry and Fisheries (DAFF), provincial Departments of Agriculture, National and Provincial Disaster Management Centres (NDMC and PDMC), the Department of Water Affairs (DWA), and the South African Weather Service (SAWS).
Author Contributions
All authors made a significant contribution to the manuscript preparation. V.A.M. was involved in data collection, analysis, and writing the first draft. Y.T.B. was a supervisor of the first author, and aided in the study design and conceptualization, review, and writing the final draft. All authors have read and agreed to the published version of the manuscript.
Funding
National Research Foundation (NRF) of South Africa funded this research, grant number TTK170510230380.
Institutional Review Board Statement
The study obtained an ethical clearance certificate from the University of the Free State Research Ethics Committee, and the reference number is UFS-HSD2020/0359/2704.
Informed Consent Statement
Informed consent was obtained from all subjects involved in the study.
Data Availability Statement
Data will be available on request from the corresponding author (Y.T.B.).
Acknowledgments
We acknowledge and thank the anonymous reviewers for their valuable comments and suggestions. We acknowledge Liesl van der Westhuizen (Science Writer) for language editing in this manuscript.
Conflicts of Interest
The authors declare no conflict of interest.
Appendix A
1. Socio-economic characteristics of the respondents
| 1.1 How old is the household head (age): | |
| 1.2 Gender: | Female = 0 and Male = 1 |
| 1.3 Marital Status: | Single = 1, Married = 2, Widowed = 3, Divorced = 4, Separated = 5 and Other = 6 |
| 1.4 Educational level (years spent at school) | |
| 1.5 How long have you been farming/farm experience? | |
| 1.6 Where do you get funding for your farm business? | Family savings = 1, Borrowings = 2, and Other = 3 |
| 1.7 How many household members are staying in the household? |
2. Assets at household home and farm.
Do you own any of the following assets? How many of the following assets do you own (specify the number)?
| Asset | Number of Assets | |
| 2.1 Herd/Flock Size (HFS) | ||
| 2.1.1 Cattle | No = 0 and Yes = 1 | |
| 2.1.2 Sheep | No = 0 and Yes = 1 | |
| 2.1.3 Goat | No = 0 and Yes = 1 | |
| 2.1.4 Chicken | No = 0 and Yes = 1 | |
| 2.1.5 Pig | No = 0 and Yes = 1 | |
| 2.1.6 Others | ||
| 2.2 Agricultural Assets (AA) | ||
| 2.2.1 Tractor | No = 0 and Yes = 1 | |
| 2.2.2 Feeding equipment (feed mixer) | No = 0 and Yes = 1 | |
| 2.2.3 Livestock trailer | No = 0 and Yes = 1 | |
| 2.2.4 Water tank | No = 0 and Yes = 1 | |
| 2.2.5 Corral system | No = 0 and Yes = 1 | |
| 2.2.6 Others | No = 0 and Yes = 1 | |
| 2.3 Non-Agricultural Assets (NAA) | ||
| 2.3.1 House | No = 0 and Yes = 1 | |
| 2.3.2 Television | No = 0 and Yes = 1 | |
| 2.3.3 Chairs | No = 0 and Yes = 1 | |
| 2.3.4 Radio | No = 0 and Yes = 1 | |
| 2.3.4 Bed | No = 0 and Yes = 1 | |
| 2.3.5 Others | No = 0 and Yes = 1 |
3. Social Safety Net
Do you or did you receive any of the following benefits?
| Support Type | Response | Support from where? | |
| 3.1 Cash | No = 0 and Yes = 1 | ||
| 3.2 Training | No = 0 and Yes = 1 | ||
| 3.3 Support for food | No = 0 and Yes = 1 | ||
| 3.4 Vegetable gardening equipment | No = 0 and Yes = 1 | ||
| 3.5 Sanitary latrine (toilet) | No = 0 and Yes = 1 | ||
| 3.6 Farm inputs (feed, medication, etc.) | No = 0 and Yes = 1 | ||
| 3.7 Water rights | No = 0 and Yes = 1 | ||
| 3.8 Others | |||
4. Adaptive Capacity
| Adaptive capacity | Questions | Response |
| 4.1 Credit | ||
| 4.1.1 Institution (financial institution) | 4.1.1.1 Do you have access to credit? If yes, how effective is the support from the institutions? | No = 0 and Yes = 1 |
| 4.2 Perception | ||
| 4.2.1 Perception of risk | 4.2.1.1 Do you believe that the climate is changing to the extent that it will affect your livestock production? | No = 0 and Yes = 1 |
| 4.3 Income source | ||
| 4.3.1 Employment | 4.3.1.1 How many members of your household are employed? 4.3.1.2 How do they contribute during the drought? | |
| 4.3.2 Business | 4.3.2.1 Is there any other business the household is doing besides farming? If yes, please specify 4.3.2.2 How does the business contribute to your farm during drought year? | No = 0 and Yes = 1 |
| 4.4 Migration | ||
| 4.4.1 Migration 4.2.2 Other options | 4.1.1.1 Is migration is an adaptive option during the drought? 4.4.1.2 If no, do you have any other options available? What are they? | N0 = 0 and Yes 1 |
5. Climate change
Do you usually experience agricultural drought in your community? (Yes/No), if yes.
| Climate change | Questions | Response |
| 5.1 Drought occurrence | When was the last time drought occurred? (less than 12 months = 1, less than 5 years = 2, and more than 5 years = 3) | |
| 5.2 Drought intensity | Do you think the intensity of this drought is: (worse than the previous droughts = 1; similar to the previous droughts = 2; better than previous droughts = 3) |
References
- Wilhite, D.A. Preparedness and coping strategies for agricultural drought risk management: Recent progress and trends. In Managing Weather and Climate Risk in Agriculture; Sivakumar, M.V.K., Motha, R., Eds.; Springer: Berlin/Heidelberg, Germany, 2007; pp. 21–38. [Google Scholar]
- Benton, T.; Gallani, B.; Jones, C.; Lewis, K.; Tiffin, R.; Donohoe, T. Severe Weather and UK Food Chain Resilience; Food Research Partnership: Resilience of the UK Food System Subgroup: Swindon, UK, 2012. [Google Scholar]
- Food and Agricultural Organization of the United Nations (FAO). UN Lays Foundations for More Drought Resilient Societies. Meeting Urges Disaster Risk Reduction Instead of Crisis Management. 2013. Available online: https://www.fao.org/news/story/en/item/172030/icode/ (accessed on 26 May 2021).
- Food and Agricultural Organization of the United Nations (FAO). Southern Africa—Situation Report October 2016; FAO: Roma, Italy, 2016. [Google Scholar]
- Sithole, V.B. El Nino Impacts in Southern Africa: Highlights from the 2015/16 Season; Paper Presented at the Southern Africa Regional Climate Services Workshop (29 November to 2 December 2016); Global Framework for Climate Services Office: Harare, Zimbabwe, 2016. [Google Scholar]
- Agricultural Organizations in South Africa (Agri SA). A Raindrop in the Drought; Report to the Multi-Stakeholder Task on the Drought; Agri SA’s Status Report on the Current Drought Crises; AGRI: Pretoria, South Africa, 2016. [Google Scholar]
- Louw, A. Sustainable policy support for smallholder agriculture in South Africa: Key issues and options for consideration. In Smallholder and Agro-Food Value Chains in South Africa; Greenburg, S., Ed.; PLAAS: Cape Town, South Africa, 2013; pp. 23–28. [Google Scholar]
- Larson, D.F.; Muraoka, R.; Otsuka, K. Why African rural development strategies must depend on small farms. Global Food Secur. 2016, 10, 39–51. [Google Scholar] [CrossRef]
- Christiaensen, L.; Demery, L.; Kuhl, J. The (evolving) role of agriculture in poverty reduction: An empirical perspective. J. Dev. Econ. 2010, 96, 239–254. [Google Scholar] [CrossRef] [Green Version]
- Cheteni, P.; Mokhele, X. Small-scale livestock farmers’ participation in markets: Evidence from the land reform beneficiaries in the central Karoo, western Cape, South Africa. S. Afr. J. Agric. Exten. 2019, 47, 118–136. [Google Scholar] [CrossRef] [Green Version]
- Boukary, A.G.; Diaw, A.; Wünscher, T. Factors affecting rural households’ resilience to food insecurity in Niger. Sustainability 2016, 8, 181. [Google Scholar] [CrossRef] [Green Version]
- Maponya, S.; Mpandelo, P. Constraints and challenges facing the small scale farmers in Limpopo province, South Africa. J. Agric. Sci. 2014, 6, 135–143. [Google Scholar]
- Matlou, R.; Bahta, Y.T.; Owusu-Sekyere, E.; Jordaan, H. Impact of Agricultural Drought Resilience on the Welfare of Smallholder Livestock Farming Households in the Northern Cape Province of South Africa. Land 2021, 10, 562. [Google Scholar] [CrossRef]
- Melketo, T.; Schmidt, M.; Bonatti, M.; Sieber, S.; Müller, K.; Lana, M. Determinants of pastoral household resilience to food insecurity in Afar region, northeast Ethiopia. J. Arid Environ. 2021, 188, 104454. [Google Scholar] [CrossRef]
- Ogunniyi, A.I.; Omotoso, S.O.; Salman, K.K.; Omotayo, A.O.; Olagunju, K.O.; Aremu, A.O. Socio-economic drivers of food security among rural households in Nigeria: Evidence from smallholder maize farmers. Soc. Indic. Res. 2021, 155, 583–599. [Google Scholar] [CrossRef]
- Chamdimba, O.; Ortmann, G.; Wale, E. Resilience to shocks and food insecurity: Determinants, and the impact of smallholder jatropha curcas cultivation in Southern Malawi. Afr. J. Sci. Technol. Innov. Dev. 2020, 1–15. [Google Scholar] [CrossRef]
- Galarza, M.X.L. Resilience to food insecurity: Theory and empirical evidence from international food assistance in Malawi. J. Agric. Econ. 2020, 71, 936–961. [Google Scholar] [CrossRef]
- Myeki, V.A. Factors Affecting Smallholder Livestock Farmers’ Agricultural Drought Resilience to Food Insecurity in the Northern Cape, South Africa. Master’s Thesis, The University of the Free State, Bloemfontein, South Africa, 2021. [Google Scholar]
- Luthar, S.S.; Cicchetti, D. The construct of resilience: Implications for interventions and social policies. Dev. Psychopathol. 2000, 12, 857–885. [Google Scholar] [CrossRef]
- Keil, A.; Zeller, M.; Wida, A.; Sanim, B.; Birner, R. What determines farmers’ resilience towards ENSO-related drought? An empirical assessment in central Sulawesi, Indonesia. Clim. Chang. 2007, 86, 291–307. [Google Scholar] [CrossRef]
- Gwaka, L.; Dubihlela, J. The resilience of smallholder livestock farmers in sub-saharan Africa and the risks imbedded in rural livestock systems. Agriculture 2020, 10, 270. [Google Scholar] [CrossRef]
- Alinovi, L.; Mane, E.; Romano, D. Towards the measurement of household resilience to food insecurity: Applying a model to Palestinian household data. In Deriving Food Security Information from National Household Budget Surveys; Sibrian, R., Ed.; Experiences, Achievement, Challenges; FAO: Rome, Italy, 2008; pp. 137–152. [Google Scholar]
- Grist, N.; Mosello, B.; Roberts, R.; Hilker, L. Resilience. In The Sahel: Building Better Lives With Children. ODI. Available online: https://cdn.odi.org/media/documents/9369.pdf (accessed on 10 March 2021).
- Bickel, G.; Mark, N.; Cristofer, P.; William, H.; John, C. Guide to Measuring Household Food Security, Revised; Measuring Food Security in the United States; United States Department of Agriculture (USDA). Available online: https://www.ers.usda.gov/briefing/foodsecurity (accessed on 25 March 2021).
- Kegan, R.; Lahey, L.L. Immunity to Change: How to Overcome It and Unlock the Potential in Yourself and Your Organization; Harvard Business Press: Boston, MA, USA, 2009; p. 341. [Google Scholar]
- Rockstrom, J. Resilience building and water demand management for drought mitigation. Phys. Chem. Earth 2003, 28, 869–877. [Google Scholar] [CrossRef]
- Abate, T. Indigenous ecological knowledge and pastoralist perception on rangeland management and degradation in Guji zone of South Ethiopia. J. Sustain. Dev. 2016, 15, 192–218. [Google Scholar]
- Birhanu, Z.; Ambelu, A.; Tesfaye, A.; Woldemichael, K. Understanding resilience dimensions and adaptive strategies to the impact of recurrent droughts in Borana zone, Oromia region, Ethiopia: A grounded theory approach. Int. J. Environ. Res. Public Health 2017, 14, 118. [Google Scholar] [CrossRef] [Green Version]
- Kwadwo, O.; Ayalew, D.; Zerfu, E. Determinants of food security in selected agro-pastoral communities of Somali and Oromia regions, Ethiopia. J. Food Sci. Eng. 2013, 3, 453–471. [Google Scholar]
- Magersa, B.; Markemann, A.; Angassa, A.; Anne, V.Z. The role of livestock diversification in ensuring household food security under a changing climate in Borana, Ethiopia. Food Sec. 2014, 6, 15–28. [Google Scholar] [CrossRef]
- Food and Agricultural Organization of the United Nations (FAO). El Nino Response Plan 2016; Food and Agricultural Organization of the United Nations (FAO): Addis Ababa, Ethiopia, 2015. [Google Scholar]
- Fan, S.; Pandya-Lorch, R.; Yosef, S. Resilience for Food and Nutrition Security; IFPRI: Washington, DC, USA, 2014. [Google Scholar]
- Hoddinott, J. Looking at development through a resilience lens. In Resilience for Food and Nutrition Security; Part of an IFPRI 2020, Book; Fan, S., Pandya-Lorch, R., Yosef, S., Eds.; IFPRI: Washington, DC, USA, 2014; pp. 19–26. [Google Scholar]
- Mulugeta, H. Green Famine in Ethiopia: Understanding the Cause of Increasing Vulnerability to Food Insecurity and Policy Response in the Southern Ethiopia Highlands. Ph.D. Thesis, University of Sussex, Brighton, UK, 2014. [Google Scholar]
- Guyu, D.; Muluneh, W. Household resilience to seasonal food insecurity: Dimensions and magnitude in the “green famine” belt of Ethiopia. Appl. Sci. Rep. 2015, 11, 125–143. [Google Scholar]
- Alinovi, L.; D’Errico, M.; Mane, E.; Romano, D. Livelihoods strategies and household resilience to food insecurity: An empirical analysis to Kenya. In The European Report of Development in Dakar, Senegal, 28–30 June; FAO: Rome, Italy, 2010; pp. 1–52. [Google Scholar]
- Stats, S.A. Frances Baard District Municipality Annual Budget 2019/2020. Available online: http://francesbaard.gov.za/wp-content/uploads/2015/04/Annual-budget-2019.20.pdf (accessed on 1 April 2021).
- Frances Baard District Municipality (FBDM). Map of the Four Local Municipalities of the Frances Baard Municipal District in the Northern Cape. 2019. Available online: https://municipalities.co.za/map/134/frances-baard-district-municipality (accessed on 21 February 2021).
- Cochran, W.G. Sampling Techniques, 3rd ed.; John Wiley and Sons: New York, NY, USA, 1977. [Google Scholar]
- Bartlett, J.E.; Kotrlik, J.W.; Higgins, C.C. Organizational research: Determining the appropriate sample size in survey research. Inf. Techn. Learn. Perfor. J. 2001, 19, 43–50. [Google Scholar]
- Northern Cape Department of Agriculture, Forestry, and Fisheries (NDAFF). Beneficiaries of an Agricultural Drought Relief Program; NDAFF: Kimberly, South Africa, 2020. [Google Scholar]
- Bollen, K.A. Structural Equations with Latent Variables; Wiley and Sons: New York, NY, USA, 1989. [Google Scholar]
- Metelerkamp, L.; Drimie, S.; Biggs, R. We’re ready, the system’s not-youth perspectives on agricultural careers in South Africa. Agrekon 2019, 58, 154–179. [Google Scholar] [CrossRef]
- Brenda, B.L. Resilience in agriculture through crop diversification: Adaptive management for environmental change. Bioscience 2011, 61, 183–193. [Google Scholar]
- Matlou, R.; Bahta, Y.T. Factors influencing the resilience of smallholder livestock farmers to agricultural drought in South Africa: Implication for adaptive capabilities. J. Disast. Risk Stud. 2019, 11, a805. [Google Scholar]
- Ngeywo, J.; Basweti, E.; Shitandi, A. Influence of gender, age, marital status and farm size on coffee production: A case of Kisii county, Kenya. Asian J. Agric. Exten. Econ. Soc. 2015, 5, 117–125. [Google Scholar] [CrossRef]
- Bahta, Y.T.; Strydom, D.B.; Donkor, E. Microcredit and gender empowerment: Policy implications for sustainable agricultural development in Eritrea. Dev. Pract. 2017, 27, 90–102. [Google Scholar] [CrossRef]
- Szabo, S.; Hossain, M.S.; Adger, W.N.; Matthews, Z.; Ahmed, S.; Lazar, A.N.; Ahmad, S. Soil Salinity, Household Wealth and Food Insecurity in Tropical Deltas: Evidence from South-West Coast of Bangladesh; Springer: Tokyo, Japan, 2015. [Google Scholar]
- Folke, C.; Colding, J.; Berkes, F. Building resilience for adaptive capacity in social-ecological systems. In Navigating Social-Ecological Systems: Building Resilience for Complexity and Change; Berkes, F., Colding, J., Folke, C., Eds.; Cambridge University Press: Cambridge, UK, 2002. [Google Scholar]
- Mane, E.; Rocca, M.; Conforti, P. Social Protection and Food Security Indicators: An Inquiry through Data from 10 Household Budget Surveys; FAO Statistics Division—Working Paper Series. 9/2015; FAO: Rome, Italy, 2015. [Google Scholar]
- Shah, K.U.; Dulal, H.B. Household capacity to adapt to climate change and implications for food security in Trinidad and Tobago. Reg. Environ. Chang. 2015, 9, 83–100. [Google Scholar] [CrossRef]
Figure 1.
Conceptual framework of the study. Source: Authors’ work from observations of various studies.
Figure 1.
Conceptual framework of the study. Source: Authors’ work from observations of various studies.
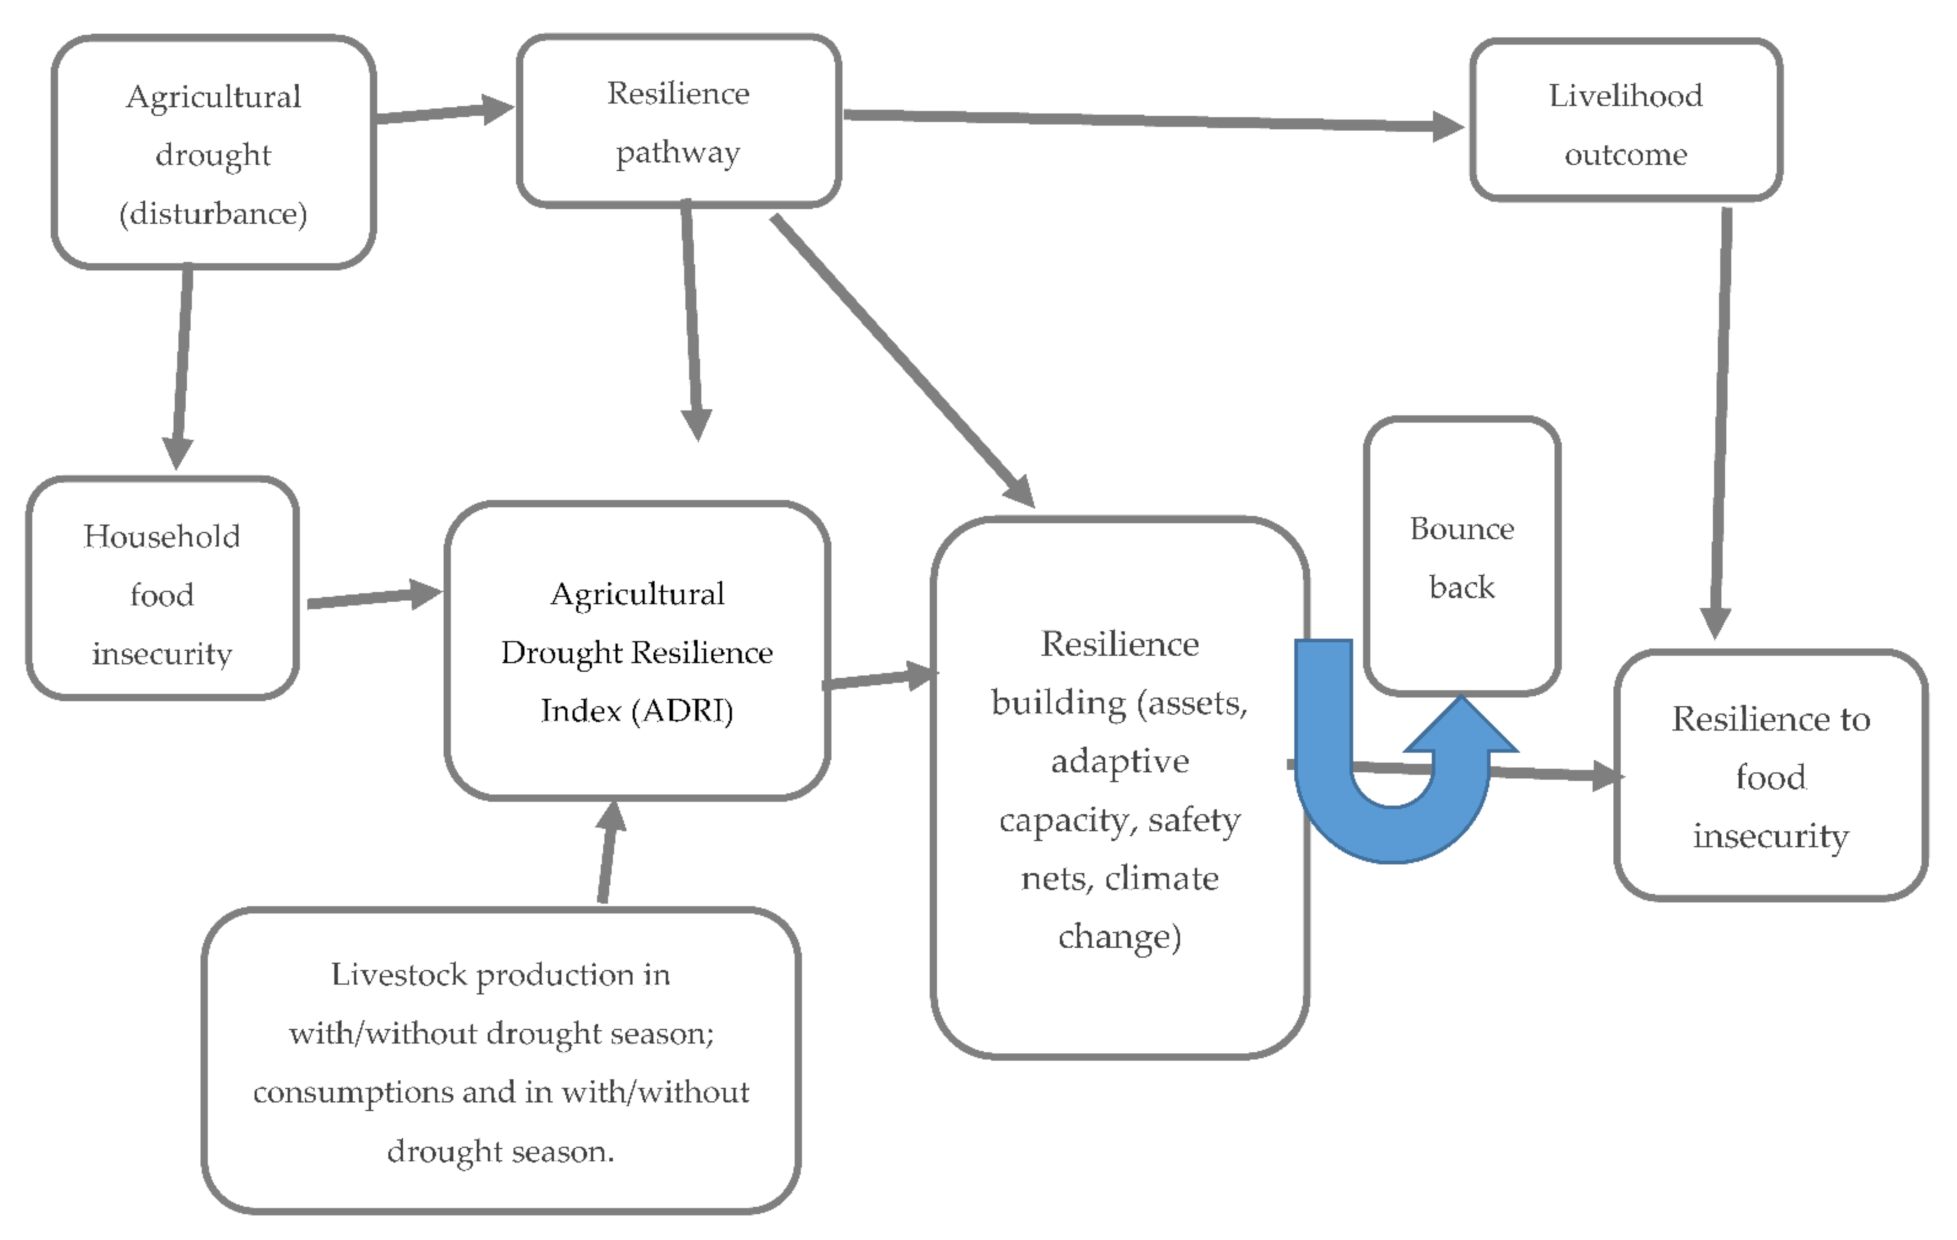
Figure 2.
Maps of South Africa highlighting Northern Cape Province, district municipalities of the Northern Cape, and the four local municipalities of Frances Baard District Municipality. Source: FBDM [38].
Figure 2.
Maps of South Africa highlighting Northern Cape Province, district municipalities of the Northern Cape, and the four local municipalities of Frances Baard District Municipality. Source: FBDM [38].


Table 1.
Number of farmers who received assistance from the government and sampling procedure.
| Local Municipality | Number of Smallholder Farmers | Share of Farmers (Number of Farmers/Total) % | Number of Samples (Percentage × Total Sample Size [217]) |
|---|---|---|---|
| Dikgatlong | 351 | 40 | 87 |
| Magareng | 120 | 14 | 30 |
| Sol Plaatje | 141 | 16 | 35 |
| Phokwane | 266 | 30 | 65 |
| Total | 876 | 100 | 217 |
Note: The “×” represents multiplication. Sources: Northern Cape Department of Agriculture, Forestry and Fisheries (NDAFF) [41], beneficiaries of drought relief program.
Table 2.
Description of variables used in structural equation modeling.
| Variables | Descriptions |
|---|---|
| Dependent variable | |
| Agricultural drought resilience index (ADRI) | |
| Explanatory variables | Sub-variables and description |
| Assets (ASS) | Herd/flock size (HFS) (cattle, sheep, and goats), agricultural assets (AAs) (tractors, feeding equipment, livestock trailers, water tanks, and corral systems), non-agricultural assets (NAAs) (house, television, chairs, radio, and bed) |
| Adaptive capacity (ADC) | Perception, source of income (Incsource), migration, credit |
| Social safety nets (SSF) | Cash, training, food support, water rights, garden equipment, sanitary latrines, farm input |
| Climate change (CH) | Drought occurrence and intensity |
Source: Authors’ observation (2020).
Table 3.
Socio-economic characteristics of the respondents (n = 217).
| Variables | Frequency | Percentage | Average | Min | Max | St.dev | |
|---|---|---|---|---|---|---|---|
| Age | 21–50 | 102 | 47 | 51.66 | 21.00 | 85.00 | 14.16 |
| 51–85 | 115 | 53 | |||||
| Education | Primary | 118 | 54.38 | 8.01 | 0.00 | 16.00 | 4.31 |
| Secondary | 91 | 41.94 | |||||
| Tertiary | 8 | 3.68 | |||||
| Farming experience | 0.5–20 | 196 | 90.32 | 10.96 | 0.50 | 60.00 | 8.85 |
| 21–60 | 21 | 9.68 | |||||
| Household members | 1–10 | 204 | 94 | 5.19 | 1.00 | 25.00 | 2.88 |
| 11–25 | 13 | 6 | |||||
| Gender | Female | 61 | 28.1 | 0.72 | 0.00 | 1.00 | 0.45 |
| Male | 156 | 71.9 | |||||
| Marital status | Single | 59 | 27.2 | 2.05 | 1.00 | 6.00 | 1.09 |
| Married | 123 | 56.7 | |||||
| Widowed | 19 | 8.8 | |||||
| Divorced | 4 | 1.8 | |||||
| Separated | 2 | 0.9 | |||||
| Other | 9 | 4.1 | |||||
| Source of farm funding | Family Savings | 111 | 51.2 | 1.92 | 1.00 | 3.00 | 0.96 |
| Borrowings | 18 | 8.3 | |||||
| Other Sources | 88 | 40.6 | |||||
| Other businesses | No | 187 | 86.2 | 0.14 | 0.00 | 1.00 | 0.35 |
| Yes | 30 | 13.8 | |||||
| Property owned | No | 207 | 95.4 | 0.05 | 0.00 | 1.00 | 0.21 |
| Yes | 10 | 4.6 | |||||
Source: Authors’ compilation based on survey (2020).
Table 4.
Correlation matrix used for agricultural drought resilience index (ADRI).
| Variables | Communalities | Component Factors | Corr. ADRI | |
|---|---|---|---|---|
| Initial | Extraction | |||
| PN | 1 | 0.935 | 0.967 | 0.894 |
| PD | 1 | 0.958 | 0.979 | 0.995 |
| Mn | 1 | 0.280 | 0.963 | 0.890 |
| MD | 1 | 0.955 | 0.977 | 0.984 |
| Eigenvalue variances (%) = 94.402 | ||||
| Cumulative (%) = 94.402 | ||||
| KMO test of sampling adequacy = 0.636 | ||||
| Bartlett’s test of sphericity is significant at p = 0.0000; chi-square = 2224.837 | ||||
Source: Authors’ compilation based on survey (2020).
Table 5.
Agricultural drought resilience index (ADRI) of Northern Cape Province of South Africa.
| Number | Percentage | |
|---|---|---|
| ADRI > 0 | 41 | 19 |
| ADRI < 0 | 176 | 81 |
| Total | 217 | 100 |
Source: Authors’ estimation (2020).
Table 6.
Structural equation modeling results (aggregated).
| Variables | Unstandardized Coefficients | Standardized Coefficients | Sig. | VIF | |
|---|---|---|---|---|---|
| B | Std. Error | B | |||
| Constant | 11.366 | 2.086 | |||
| Assets (ASS) | 0.007 | 0.003 | 0.150 | 0.036 ** | 1.86 |
| Social safety nets (SSF) | −0.005 | 0.319 | 0.001 | 0.987 | 1.46 |
| Adaptive capacity (ADC) | 0.910 | 0.360 | 0.171 | 0.012 ** | 1.72 |
| Climate change (CH) | 0.095 | 0.127 | −0.053 | 0.454 | 1.65 |
** Significant at 5%. Source: Authors’ estimation based on survey (2020).
Table 7.
Structural equation modeling results (disaggregated).
| Variables | Unstandardized Coefficients | Standardized Coefficients | Sig. | Variables |
|---|---|---|---|---|
| B | Std. Error | B | ||
| Constant | 11.366 | 2.086 | ||
| Assets (ASS) | ||||
| Herd/flock size (HFS) | 3.435 | 0.676 | 0.333 | 0.000 *** |
| Agricultural assets (AA) | 37.494 | 27.567 | 0.089 | 0.175 |
| Non-agricultural assets (NAA) | −2.795 | 9.997 | −0.019 | 0.780 |
| Social safety nets (SSF) | ||||
| Cash | 0.038 | 0.059 | 0.044 | 0.524 |
| Training | 0.096 | 0.057 | 0.124 | 0.092 * |
| Food support | 0.060 | 0.057 | 0.075 | 0.297 |
| Water rights | 0.114 | 0.079 | 0.111 | 0.147 |
| Garden equipment | 0.271 | 0.106 | 0.195 | 0.012 ** |
| Sanitary latrines | 0.040 | 0.077 | 0.037 | 0.607 |
| Farm input | 0.118 | 0.055 | 0.145 | 0.032 ** |
| Adaptive capacity (ADC) | ||||
| Perception | −0.154 | 0.057 | −0.181 | 0.007 *** |
| Source of income (Incsource) | −0.235 | 0.132 | −0.122 | 0.077 * |
| Credit | −0.541 | 0.155 | −0.250 | 0.001 *** |
| Migration | 0.059 | 0.113 | 0.037 | 0.603 |
| Climate change (CH) | ||||
| Drought occurrence | −0.052 | 0.030 | −0.118 | 0.090 * |
| Intensity | −0.007 | 0.032 | −0.021 | 0.825 |
*** Significant at 1%; ** significant at 5%; * significant at 10%. Source: Authors’ estimation (2020).
Publisher’s Note: MDPI stays neutral with regard to jurisdictional claims in published maps and institutional affiliations. |
© 2021 by the authors. Licensee MDPI, Basel, Switzerland. This article is an open access article distributed under the terms and conditions of the Creative Commons Attribution (CC BY) license (https://creativecommons.org/licenses/by/4.0/).
Share and Cite
MDPI and ACS Style
Myeki, V.A.; Bahta, Y.T. Determinants of Smallholder Livestock Farmers’ Household Resilience to Food Insecurity in South Africa. Climate 2021, 9, 117. https://0-doi-org.brum.beds.ac.uk/10.3390/cli9070117
AMA Style
Myeki VA, Bahta YT. Determinants of Smallholder Livestock Farmers’ Household Resilience to Food Insecurity in South Africa. Climate. 2021; 9(7):117. https://0-doi-org.brum.beds.ac.uk/10.3390/cli9070117
Chicago/Turabian StyleMyeki, Vuyiseka A., and Yonas T. Bahta. 2021. "Determinants of Smallholder Livestock Farmers’ Household Resilience to Food Insecurity in South Africa" Climate 9, no. 7: 117. https://0-doi-org.brum.beds.ac.uk/10.3390/cli9070117
Note that from the first issue of 2016, this journal uses article numbers instead of page numbers. See further details here.