
Evaluation of Computational Models for Electron Transpiration Cooling

1
Department of Aerospace Engineering Sciences, University of Colorado, Boulder, CO 80309, USA
2
Department of Aerospace and Mechanical Engineering, University of Arizona, Tucson, AZ 85721, USA
3
Department of Mechanical Engineering, University of Vermont, Burlington, VT 05405, USA
*
Author to whom correspondence should be addressed.
Aerospace 2021, 8(9), 243; https://0-doi-org.brum.beds.ac.uk/10.3390/aerospace8090243
Submission received: 15 June 2021
/
Revised: 4 August 2021
/
Accepted: 13 August 2021
/
Published: 2 September 2021
(This article belongs to the Special Issue Computational Fluid Dynamics on High-Speed and Non-Equilibrium Flows)
Abstract
:Recent developments in the world of hypersonic flight have brought increased attention to the thermal response of materials exposed to high-enthalpy gases. One promising concept is electron transpiration cooling (ETC) that provides the prospect of a passive heat removal mechanism, rivaling and possibly outperforming that of radiative cooling. In this work, non-equilibrium CFD simulations are performed to evaluate the possible roles of this cooling mode under high-enthalpy conditions obtainable in plasma torch ground-test facilities capable of long flow times. The work focuses on the test case of argon gas being heated to achieve enthalpies equivalent to post-shock conditions experienced by a vehicle flying through the atmosphere at hypersonic speed. Simulations are performed at a range of conditions and are used to calibrate direct comparisons between torch operating conditions and resulting flow properties. These comparisons highlight important modeling considerations for simulating long-duration, hot chamber tests. Simulation results correspond well with the experimental measurements of gas temperature, material surface temperature as well as measured current generated in the test article. Theoretical methods taking into consideration space charge limitations are presented and applied to provide design suggestions to boost the ETC effect in future experiments.
1. Introduction
In recent years, there has been a global surge in interest in the development of hypersonic vehicles. Realizing robust hypersonic vehicles requires modeling capabilities that accurately capture the complex interaction between high-enthalpy gases and real materials. Critical to the successful design of a hypersonic vehicle is the ability to predict both the thermal and structural response of the Thermal Protection System (TPS).
Classically, research in TPS material response modeling has been focused on the agglomeration or degradation of a material through heating and typically exothermic reactions with the gas (oxidation, nitridation) [1,2]. Especially in the case of material decomposition, it is important to be able to predict the shape change of a body to understand the limits of the vehicle’s aerodynamic performance [3,4]. Proper design and mission planning can allow a consumable material to remove excess heat, cooling the surface without reaching the point of structural failure.
For purposes of both maneuverability as well as reusability, a surface material that significantly decomposes is not ideal. However, if some material is allowed to decompose endothermically, such as in the case of phase change, the material breaking down will absorb more energy as it passes through and over the hot surface. This two-stage mechanism can carry away heat very effectively [5] and can be represented by Equation (1). For simplicity, the product gas is assumed to be at the wall enthalpy, . This mass is then diffusing from the surface at a net rate of . The subscript refers to the cooling allotted from a thermal mass, absorbing as much heat as it can and then being removed from the system. Equation (1) can be used to relate the heat removed from an ablative material, that has been used on all hypersonic entry capsules to-date. It can also apply to scenarios in which a coolant is passively or actively pumped out of, or over the surface [6]. In the passive case, which represents the total power, , being absorbed in finite rate processes of surface material collectively represented by the effective latent heat, . In reality, the net rate of mass removal is a complex function of external flow conditions. In any case, mission designers need to contend with the consumable mass added when comparing such TPS options.
With the advent of the Space Shuttle, the concept of radiatively cooled, reusable TPS materials became a mature branch of the TPS research community [7]. While surface reaction modeling was still important to characterize the performance of various materials throughout re-entry, material ablation was not intended and, thus, the aerodynamic performance could be characterized for a vehicle of constant shape. Instead of removing thermal energy through chemical reactions and mass removal, this mechanism releases energy in the form of photons, according to the optical properties of the surface (Equation (2)). This form of thermal management places significant constraints on the entry flight path, as the the cooling capacity is limited by the surface area and emissivity of the TPS.
Recent developments in hypersonic vehicle research have considered an alternative mode of cooling that can be attributed to the thermoelectric properties of a material. The release of electrons from a hot surface represents the direct conversion of heat into electricity and has been studied for over 150 years [8]. However, much of this time has been devoted to creating filaments or cathodes (electron emitters) to be used in vacuum or controlled, quiescent atmospheres. This approach has been studied for products, such as light sources, power amplifiers, and even power generators—but only recently has it been considered for thermal management applications [9]. The cooling associated to this effect can be written as Equation (3) [10,11]. Like Equations (1) and (2), this mechanism aims to provide passive cooling without the concern of shape change or degraded structural integrity, while unlike phase-change coolants, it does not require consumable mass, thus making it an attractive concept for high-speed vehicle TPS.
Cooling from thermionic emission is similar to the act of transpirationally cooling a surface with a phase-change material and is commonly referred to as Electron Transpiration Cooling (ETC). Like a coolant absorbing extra energy through vaporization, the ETC process requires and subsequently removes extra energy at a rate governed by the electron current flux, , wall temperature, , and the material work function, . is defined as the difference between the electrochemical potential of electrons just inside the material surface and the electrostatic potential energy of an electron in a vacuum just outside the surface. As a material heats up, thermal excitation of the electrons just inside the surface can overcome this potential barrier and escape with an average kinetic energy of as first shown by Richardson [12]. The emission current of electrons from a surface was found to be a function of and [10]. This is mathematically shown in the Arrhenius-like form of Equation (4).
where A is a material-dependent constant. While measured values of A range over many orders of magnitude, these experiments typically occur under ideal conditions at low temperatures [13].
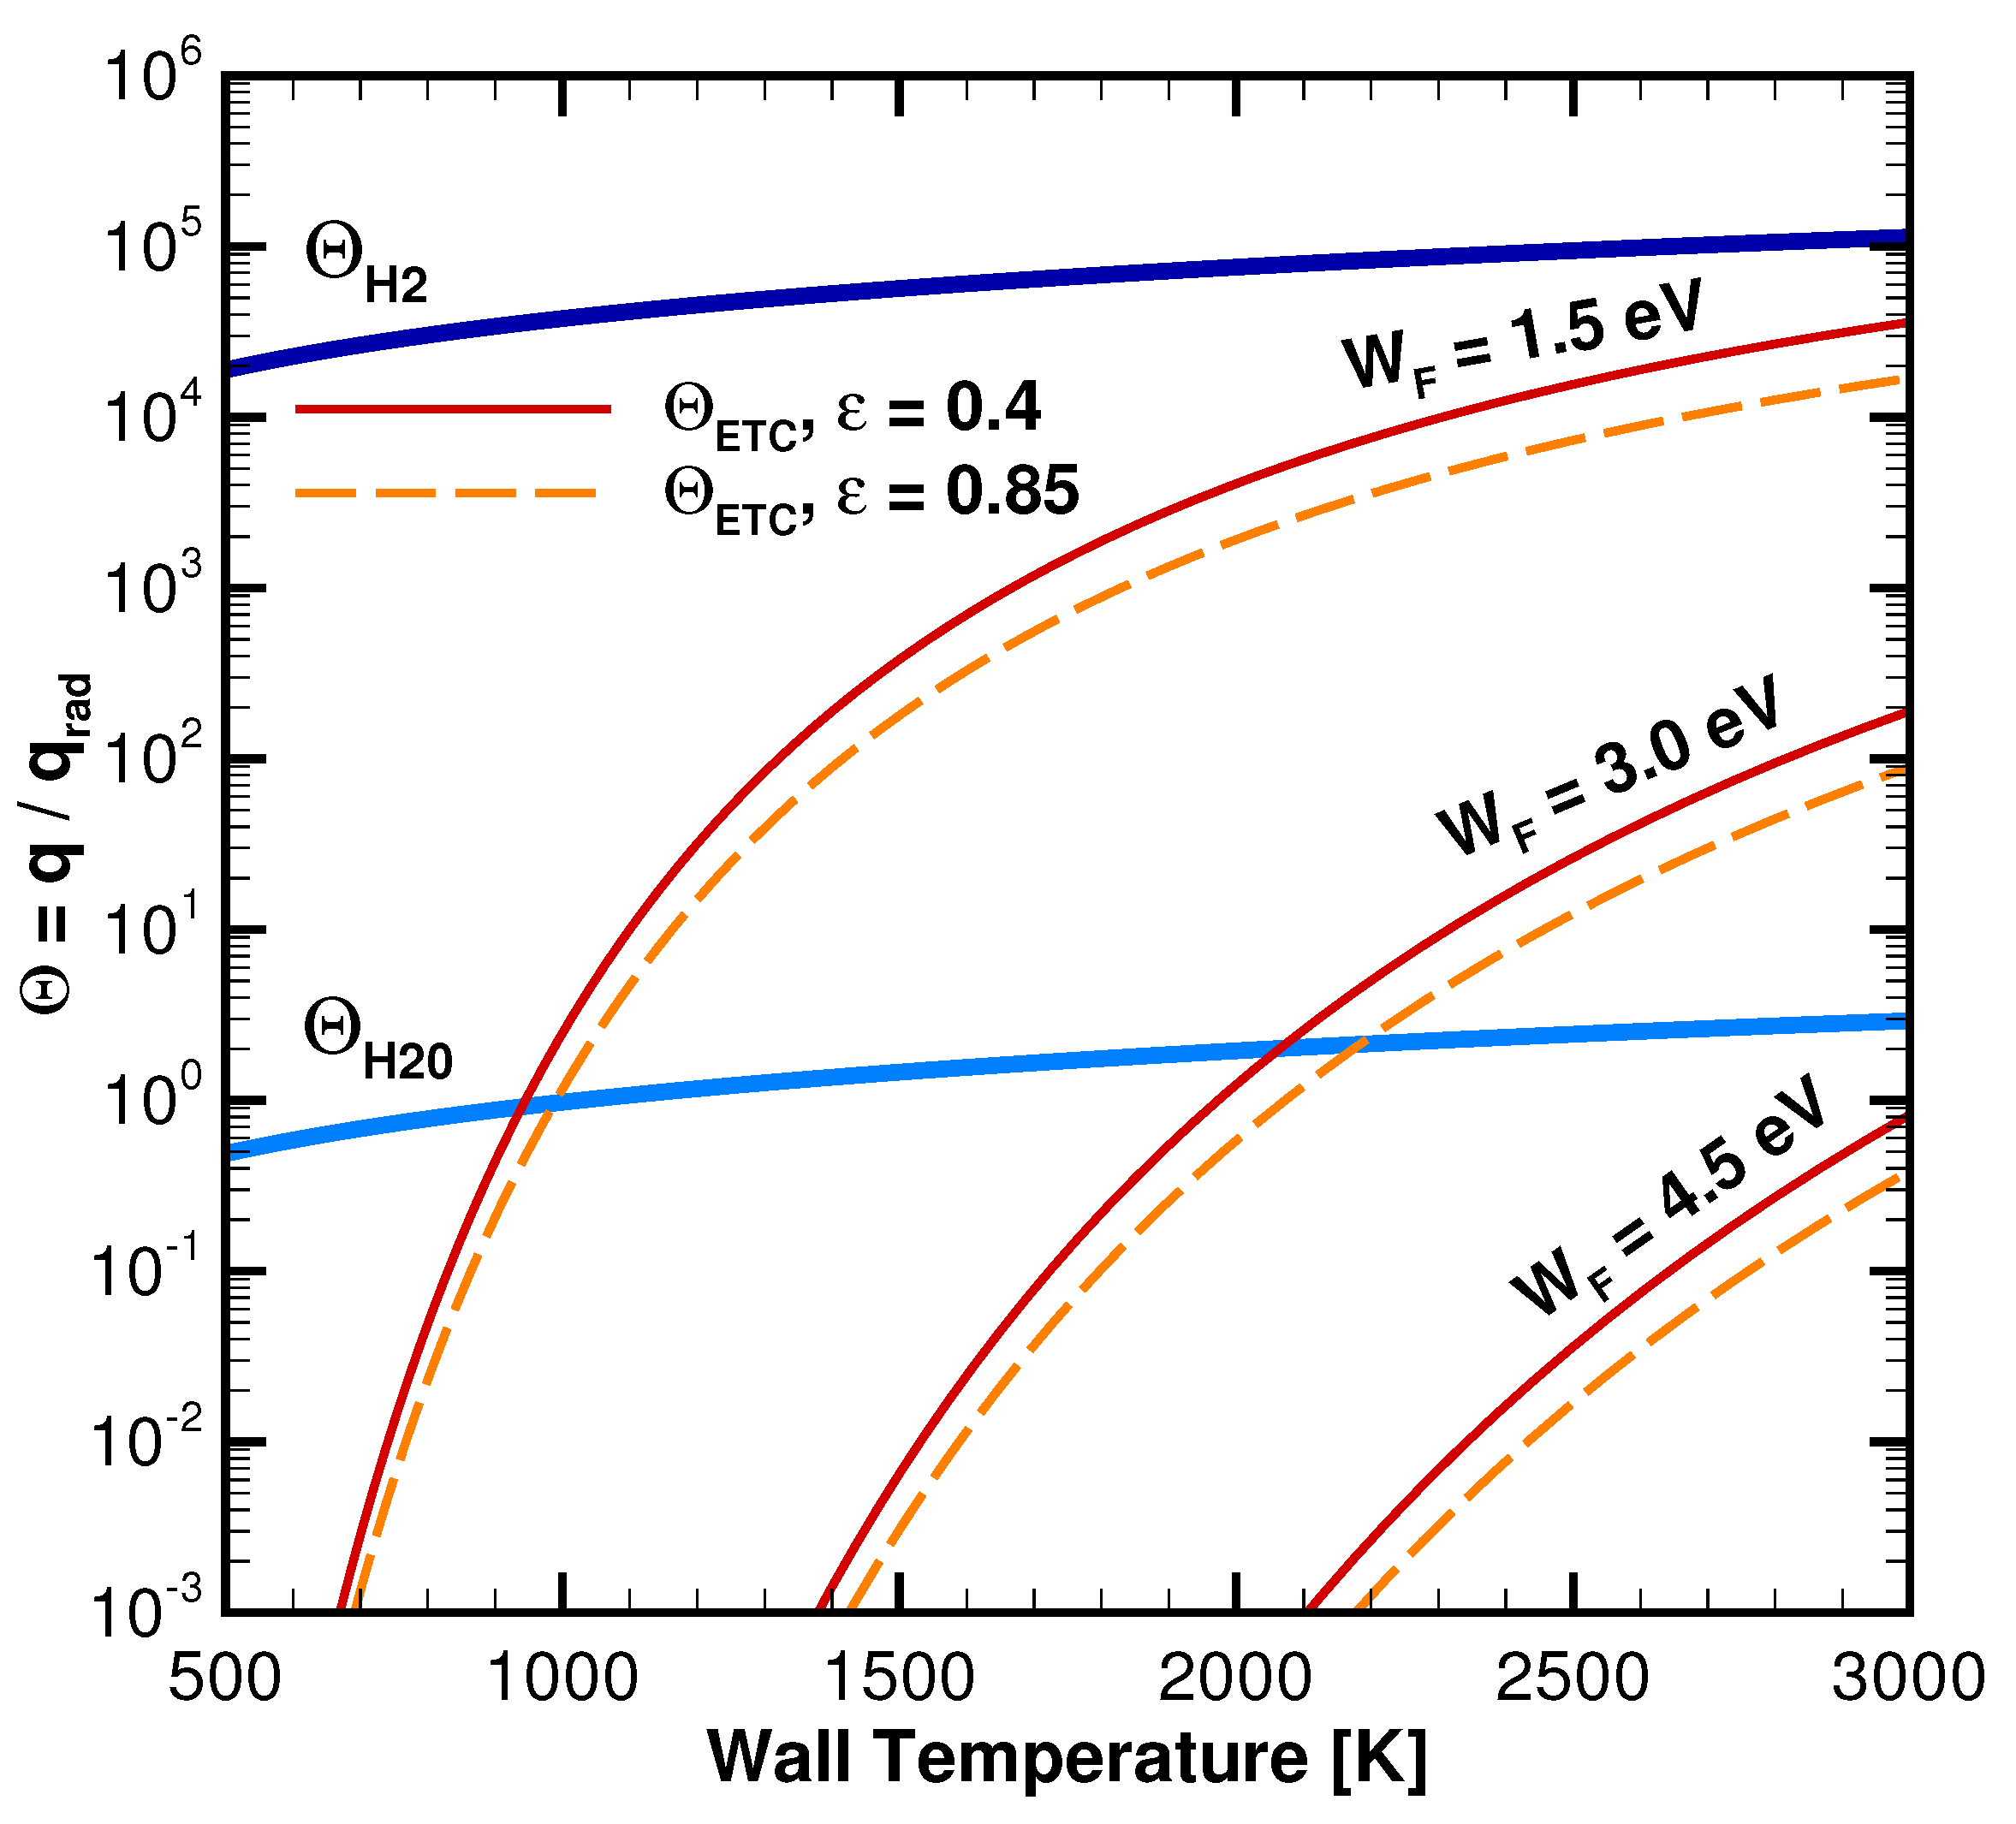
Figure 1 provides an approximate comparison of these different cooling mechanisms where Equations (1) and (3) are normalized by the equivalent level of radiative cooling (Equation (2)) over a range of relevant wall temperatures. This ratio of cooling rates is denoted as , where the cooling mechanism, m, signifies ETC or a specific thermal mass material. Note that these relations represent an upper limit on the amount of cooling from each of the modes, using the material properties as labeled in Figure 1. For the thermal mass examples, liquid and vapor water and hydrogen properties are used while assuming × 1 m. The latter simplification means that all energy coming in as convective heating, balanced by radiative cooling, would be going into latent heat to vaporize the thermal mass. This is not realistic as the incident heat would be balanced by all possible modes of cooling, but it provides a useful reference to help understand the relative roles and appropriate regimes for each of the passive cooling mechanisms considered. Similarly, Equation (4) represents an upper limit on the natural transpiration of electrons from a heated surface. The theoretical value for metals, A cm K, is used in Equation (4).
In the 1960s, there was interest in using thermoelectric materials on entry vehicles as a source of power generation [14,15]. Tests were conducted in a plasma arc tunnel at the Sandia Corporation for various geometries, material properties and flow conditions [16]. More recently, Hanquist and Boyd simulated the experiments using various modeling options [17,18]. Overall, the simulations were able to encompass the experimental results but uncertainties in the measurements made it difficult to draw any direct conclusions on which modeling options were most accurate. Motivated by the need for better test data to verify and validate these and other such models, researchers at the University of Vermont (UVM) have been conducting high enthalpy experiments with their 30 kW Inductively Coupled Plasma (ICP) Facility (Figure 2) [19].
The UVM 30 kW ICP Facility is designed to generate high-enthalpy flows which simulate post-shock conditions for a scaled, stagnation point geometry [20]. Stagnation point heat flux of the test condition can be extrapolated to flight condition by matching total enthalpy, stagnation pressure, and the velocity gradient at the boundary layer edge. This method is known as local heat transfer simulation and is based on the assumption of local thermochemical equilibrium [21]. Additional details can be found in [22,23,24]. This facility, coupled with the established traditional and spectroscopic diagnostics tools, presents an inexpensive, capable, and accessible test environment for ETC studies including numerical validation support.
In the current study, numerical simulations of a high-enthalpy, low-speed argon plasma are developed and discussed. Past studies have compared simulation results to measurements along the plasma jet centerline and stagnation point, for investigating surface catalycity [25] and high-temperature emission of a blowing surface [26]. For the first time, radial distributions of plasma temperature measurements are compared to simulated flowfields for ETC tests. A number of torch outlet (test chamber inlet) conditions are simulated in order to understand how the ionization of the plasma jet can vary with the torch current. Direct comparisons of simulated results and experimental measurements are made. With the torch conditions characterized, ETC physics are incorporated and compared to theoretical limits, providing insight for designing future experiments in order to maximize the observable effect of thermionic emission. In the following sections, techniques used for both the experimental effort and numerical study are presented. Then, CFD simulation results are presented for select cases to highlight test parameters which are difficult to measure with low uncertainty. Radial profiles of temperature are compared to measurements from the UVM ICP facility and discussed relative to various modeling options. ETC physics are considered and compared to experimental data. Finally, plasma sheath theory is applied to provide design suggestions for future tests.
2. Methods and Materials
The current study focuses on a hemispherically-capped cylindrical material sample, under a variety of high-enthalpy flow and wall boundary conditions, as depicted in Figure 2. Details regarding these experiments will be presented next followed by details on the numerical modeling effort.
2.1. Plasma Torch Experiments
The ICP facility is made up of a 30 kW power supply unit, ICP torch, and plasma test chamber. It is outfitted with various capabilities including laser diagnostics, heat flux measurement and thermal imaging. Gas is fed through a quartz containment tube surrounded by a helical coil which ionizes and heats the gas by magnetic induction before injecting it into the test chamber. The temperature of the gas entering the test chamber is controlled through the electrical current to the coil where only a fraction of the supplied power is converted to thermal energy in the gas. Traditionally, using laser-induced fluorescence (LIF), critical flow parameters including translational temperature and species number densities can be measured at various points in the chamber [27,28]. These profiles can be used to calibrate the simulation conditions relative to the torch electrical current setting. In order to increase plasma conductivity and eliminate material surface evolution due to nitridation and oxidation and, thereby, improve ETC performance, argon gas is used as the working fluid. As such, the temperature of the plasma is taken from line-of-sight intensity calibrated emission measurements that are subsequently Abel-inverted to access spatially resolved profiles [29]. Torch and chamber conditions considered in this study are shown in Table 1.
The test sample consists of two sections of graphite that are thermally and electrically insulated from each other by an alumina or quartz spacer and connected to a water-cooled quartz fixture. The hemispherical section is considered the emitter while the downstream surface is considered the collector. This is similar to the configurations considered in Touryan’s power generation tests at Sandia [16].
While these ICP tests are not at high speeds, the benefit provided from understanding material response to high-enthalpy flow makes them critical in the push for robust high-speed vehicles. Due to the complexity of a plasma impinging upon a thermoelectric material sample, it is paramount that diagnostic equipment and numerical tools be applied to fully understand the materials’ thermal response. The current study reports on efforts to apply aerothermodynamics simulation capabilities to model the unique ground-test conditions of the UVM facility.
2.2. Numerical
The current study uses the non-equilibrium CFD code LeMANS [30] to simulate the high-enthalpy, multi-species flows that occur in UVM’s ICP Torch facility. LeMANS solves the Navier–Stokes equations on a multi-dimensional grid and has been extensively verified and validated against other leading codes and experimental data [31,32,33,34]. Flow is modeled assuming continuum conditions and by setting the translational and rotational temperatures of the gas to be in equilibrium, represented as a single temperature, . This is made possible by the relatively slow to excite and equilibrate vibrational and electronic energy modes, which are modeled as a second temperature, . More information on the LeMANS solver, finite rate chemistry models, and detailed thermochemical properties included can be found in the literature [30,34].
While the ICP torch facility generates a mixture of high-enthalpy constituents, it does so at relatively low, subsonic velocities. Generating plasma through magnetic field coupling (electrodeless operation) circumvents the shortcomings of electrode erosion experienced in arc jet facilities. This allows long duration tests (minutes to hours), constrained only by the amount of supplied gas. Unlike hypersonic CFD simulations where freestream conditions can be applied to the inlet and disturbances do not travel upstream, the current simulations require additional modeling considerations to handle the subsonic flow which communicates disturbances throughout the domain. This is done by setting subsonic boundary conditions and an initially quiescent chamber. Torch conditions are fully specified at the inlet (i.e., density, velocity, and temperature) to the test chamber and allowed to develop until a steady, laminar jet flow is achieved. The subsonic outlet condition is solved assuming constant pressure where a value for the static pressure is specified. Density and velocity variables are solved using zeroth-order extrapolation and the outlet pressure is used to determine the temperature through the equation of state. More information on the development of these models can be found in [1,25].
Two methods were used in setting the inlet conditions based on known torch and test chamber parameters (Table 1). This is due to the uncertainty in the actual velocity of the gas exiting the torch for a given torch current. In most cases considered, the method from [26] is used where the known mass flow rate of gas into the torch is used along with a prescribed torch outlet temperature to iterate on the inlet velocity and species individual densities until the inlet pressure has converged. In order to determine the species densities, chemical equilibrium is assumed. The open source chemistry solver Cantera [35] is used to solve for these equilibrium quantities at the inlet temperature and pressure, as the pressure is iterated. The second approach follows the same procedure but does not use the mass flow rate and instead prescribes a velocity at the torch outlet. Using this fixed velocity, pressure and density are iterated until the pressure converges. This was used in [25] with the prescribed velocity of 136 m/s. This second approach results in a higher mass flow rate, which is not fully consistent with the experimental conditions. However, past work has shown that for both approaches, centerline and stagnation temperatures match well with experimental values. In the current work, radial distributions are compared which show increased dependence on these inlet parameters.
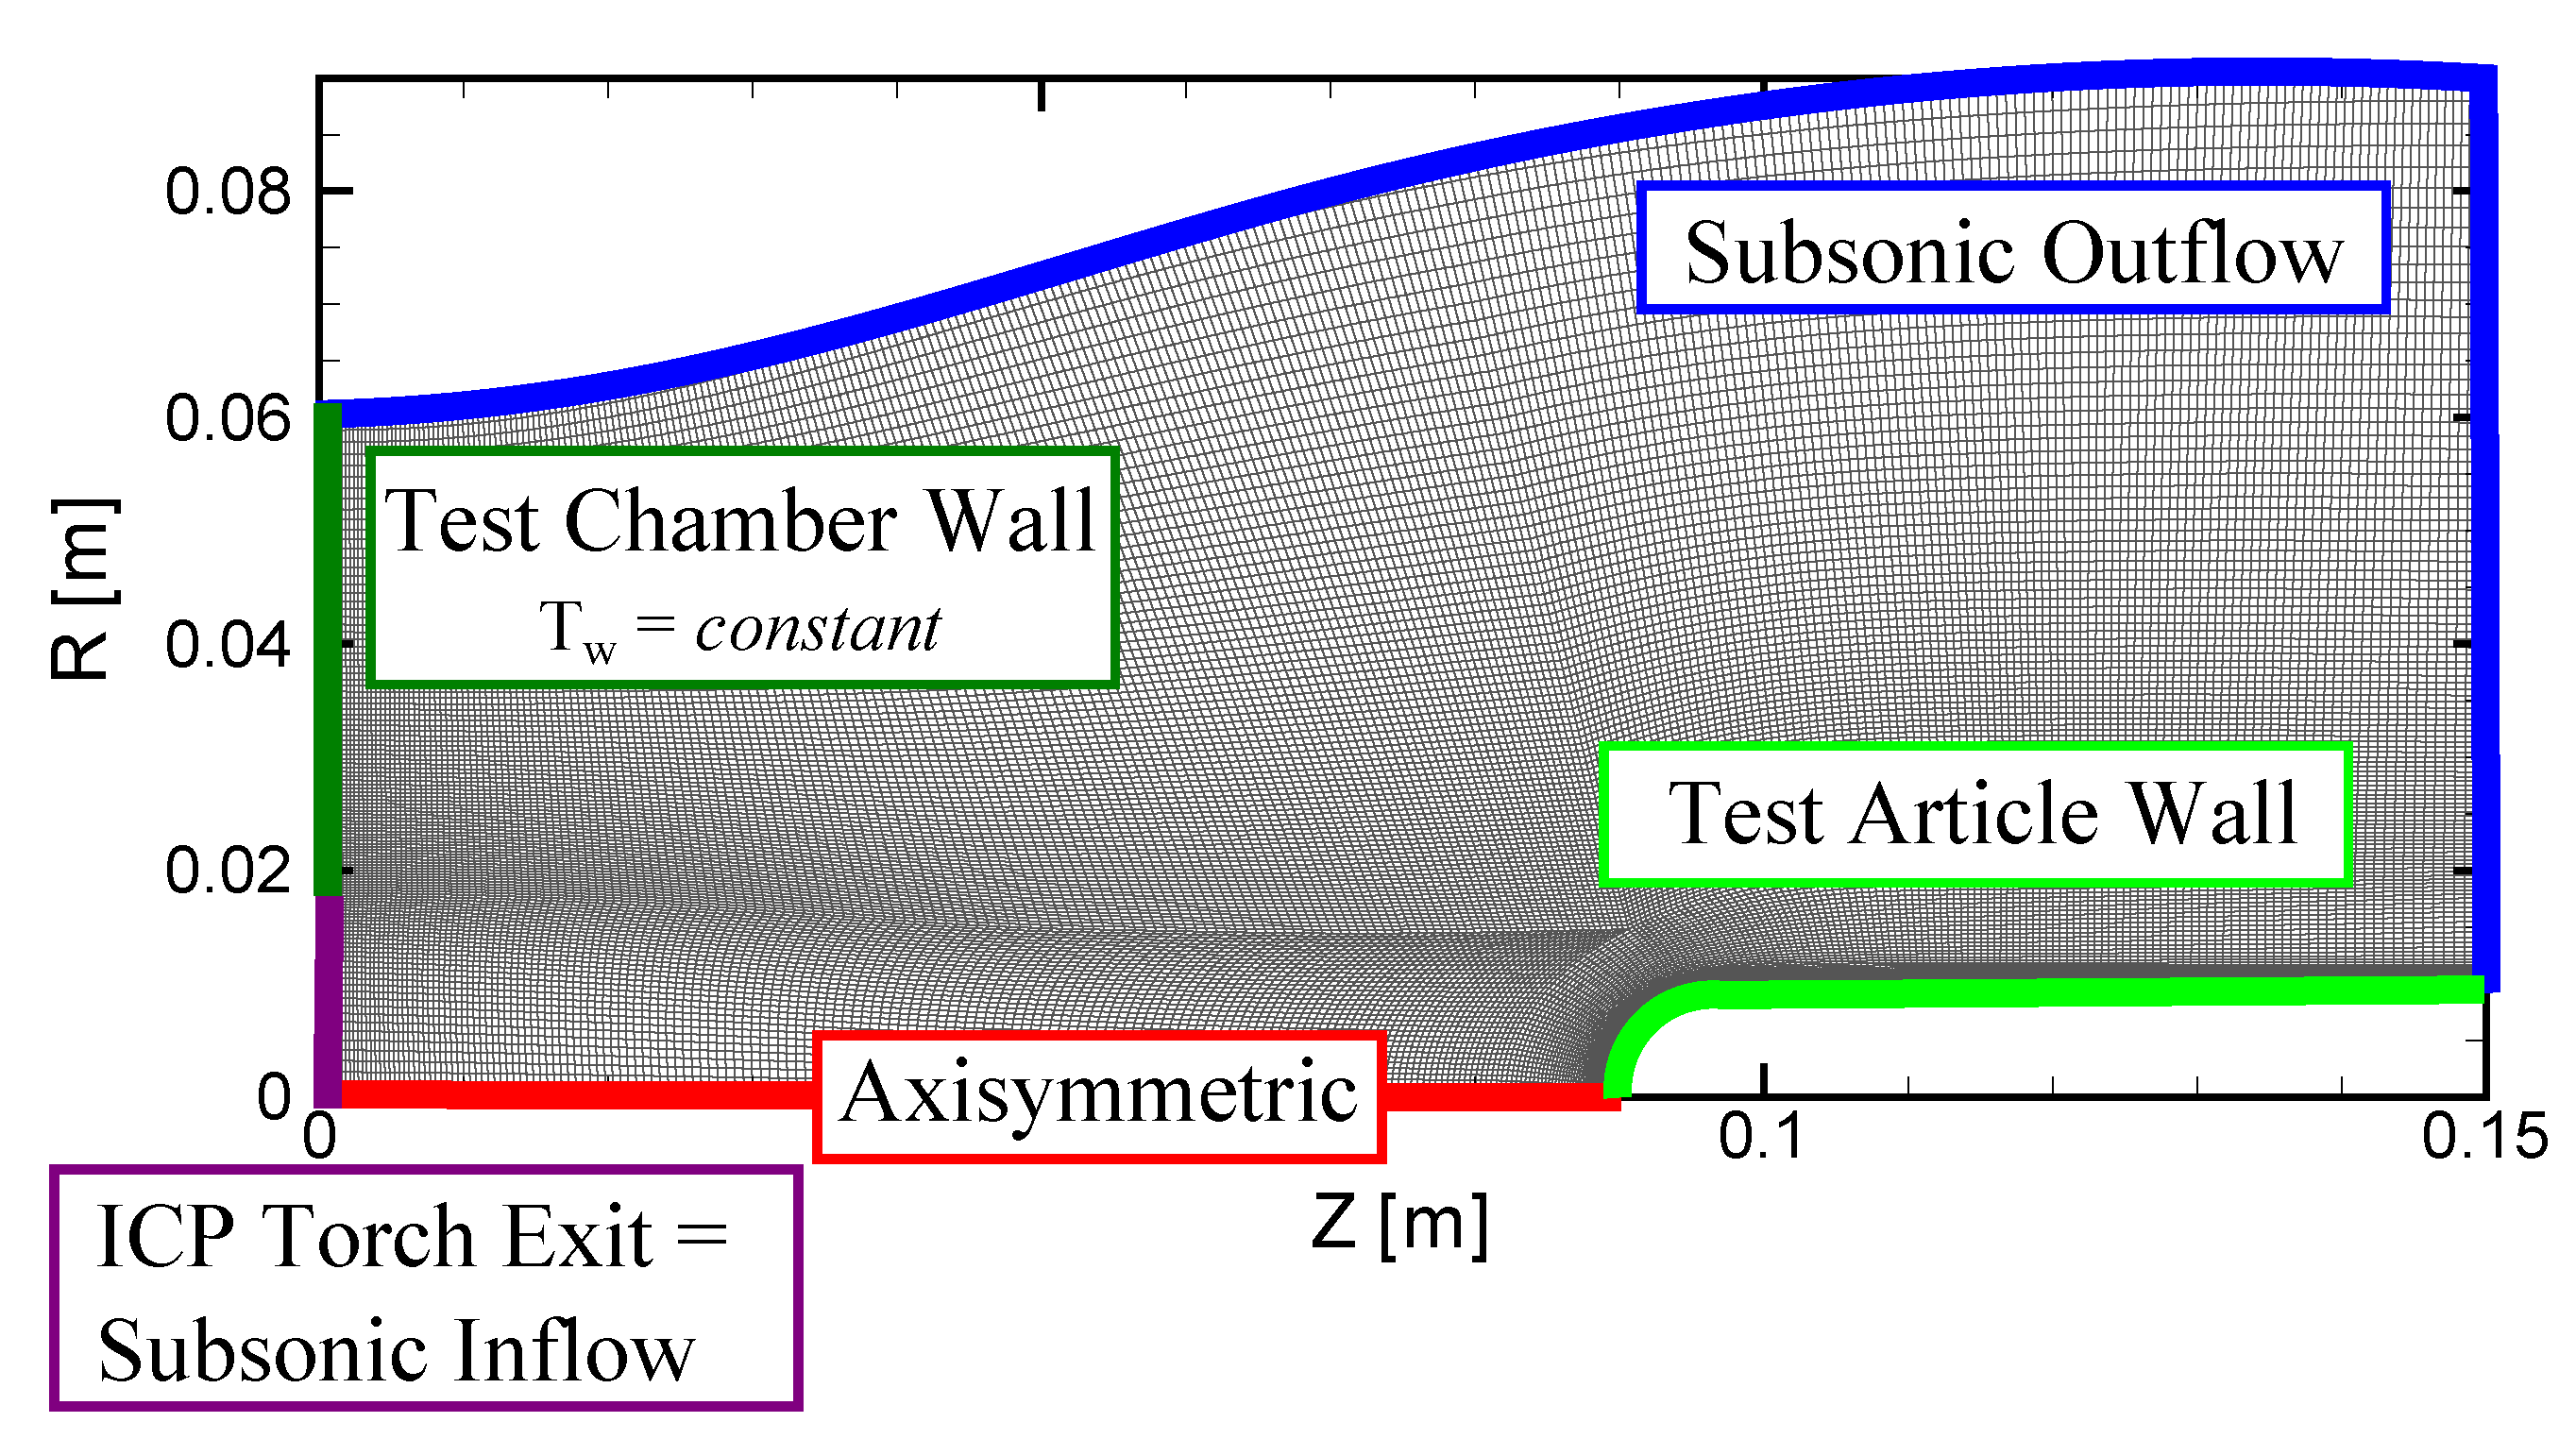
A mixture of three species are simulated which make up an argon plasma: neutral argon, Ar, Argon ion, Ar, and electrons, e. The general setup of these simulation is provided in Figure 3. The mesh shown consists of 36,795 cells and has been specifically tailored to the jet flow conditions in the ICP torch facility.
In the simulation domain, the flow is assumed to be quasi-neutral while ETC physics are coupled through a sub-grid scale sheath model which has various options for determining the electron current flux into the flowfield, , as well as dealing with potentially detrimental space-charge effects. These models are discussed next.
2.3. Thermionic Emission
Equation (4) represents the emission under ideal conditions and can be considered the “temperature-limited” or saturated current. This relationship holds when the emitted electrons see no retarding electric field, they are not reflected back to the surface through collisions with the flowfield, nor do they see a virtual cathode created by space-charge limits. This current is then used to include an additional production term for the mass balance at the wall, as shown in Equation (5).
where the portion of emitted electron and flowfield ions that recombine at the surface is assumed to be modeled as being fully catalytic to ions and is determined by Equation (6).
The electron mass flow rate out of the wall is then defined by Equation (7).
2.4. Space Charge Limitations
When charge is emitted from a surface, a plasma sheath will form that represents a small region of charge separation which sits between the quasi-neutral flowfield and the thermionic wall. Behind an ionizing shockwave, a plasma sheath will form due to the mass difference between electrons and ions () leading to electrons having higher mobility, leaving a net-positive charge in this near wall region. Past studies have shown that such space-charge effects can significantly limit the ETC process by effectively creating a virtual cathode which pushes electrons back to the surface [17,36]. Models from the plasma diagnostics community have been in use for over 90 years to analyze emissive probes [37]. Historically, the current was measured from the probe to infer properties of the plasma. This presumes full knowledge of the emissive characteristic of the surface under the applied plasma conditions. Hanquist and Boyd have adapted these theories for use in LeMANS where the plasma properties are determined from the CFD simulations and the level of emission under these conditions is unknown.
2.4.1. Floating Surface
For an emissive wall, the net current through the sheath can be forced to zero by assuming an electrically floating (i.e., electrically insulated) surface. This is to say that the net current, , can be considered as the difference in flowfield ions and electrons passing through the sheath ( and , respectively). Thus, the amount of electrons that is able to escape the sheath and effectively remove heat from the wall is a function of the flowfield plasma properties. With a quasi-neutral flowfield, this electrically-floating surface emission is typically small and the plasma potential at the sheath edge is set to a zero gradient. The electric potential of the wall is approximated through the relations provided by Hobbs and Wesson [38]. This model assumes zero electric field at the surface, referred to as cold emission, and is written as Equation (10).
where the ratio of emitted electrons to that of the , is . This approximates the flowfield ions as arriving at the wall cold and the electrons are emitted with insignificant energy, which both follow the cold emission assumption. The flowfield electron current density can be determined from Equation (11).
Here, is the number density of flowfield electrons at the sheaths edge without surface emission. This assumes the small current coming from the wall has a negligible effect on the near-wall electron densities. These relations are only valid up to the critical values of and , defined in Equations (12) and (13) [38].
For larger amounts of emission, above these critical values, a potential well forms which acts to maintain current conservation through the sheath region by reflecting a portion of the electrons back to the surface. As the only ion considered in the present work is , this leads to . This means that the surface electron emission will be at most 97% of the flowfield electron current. Furthermore, using the current balance through the sheath to define the ratio of space-charge limited current to that of the flowfield ions, , in terms of , Hanquist and Boyd have shown that [18],
2.4.2. Biased Surface
In the case where the surface is not floating electrically but instead carries a negative bias, a net current through the sheath edge becomes possible. This negative potential could be powered from electrons collected downstream of their emission location, through internal circuitry. This is the same concept as studied at the Sandia Corporation for power generation as well as by UVM in the test cases considered in the present work. This scenario of electrons being emitted from a hot surface (cathode) and being collected downstream (anode) is the same as a double emissive probe. Like the case of a floating surface, a biased wall may also be affected by space-charge limitations.
An expression for the space-charge limited current through the sheath has been derived from Poisson’s equation by Hara and Hanquist [39]. This is similar to the solution of Takamura et al. [40] while also accounting for kinetic effects and providing a form more suitable for implementation into CFD codes. While the solution has been validated compared to direct-kinetic solutions of the Boltzmann equation, it does assume the sheath is collisionless.
with
where is the ratio of primary to emitted electron temperatures, predicted by the method of Hanquist et al. [41] and the constants are
and with M set to unity for this work. This typical assumption comes from the Bohm criterion which states that ions are accelerated up to or greater than Mach 1 through the sheath [42]. The ion current density is given by
which is a function of the ion number density, , and the ion acoustic speed for cold ions, , defined as Equation (23).
This solution can be simplified by setting for cases of interest for ETC. This results from the findings that which requires a sheath potential larger than V to realize the benefit from ETC [41]. This voltage drop is normalized as
where is the electron temperature estimated using the approach described in Hanquist et al. [41]. The voltage drop across the sheath can be described as the sum between a floating potential, and any applied bias, , as
Following the previous section, the model of Hobbs and Wesson [38] provides the normalized potential for a space-charge limited, floating surface which is −1.02. Thus, the total normalized potential can be rewritten as
This theory has shown good agreement when compared to a 1-D Direct Kinetic simulation [39].
Like the model for the floating surface, it is helpful to use the biased surface model to estimate the extent of space-charge limits on the electron emission. For this, consider Equation (15) for a normalized surface potential that approaches negative infinity, written as
which sets the upper limit on space-charge limited emission in the presence of a biased surface. For Ar, 271.
2.4.3. Ideal Work Function
When emission is space-charge limited, the benefit of minimizing is reduced and can lead to decreased ETC. Considering that ideal emission is governed by Equation (4), it becomes useful to equate this ideal current to each of the space-charge limited cases in order to determine an “Ideal Work Function”. This represents the material property that enables maximum emission, for a given flow scenario of plasma number density at the surface for any specific wall temperature. By rearranging Equation (4), this can be written as
Then, each of the critical space-charge limited cases can be expressed in terms of the level of ionization and current wall temperature. This is approximated assuming the electron current is in thermal equilibrium with the wall () and the equality of charge species densities, (where the latter equality represents the quasi-neutrality assumption). can be generally considered the plasma density. This results in the approximation,
where the constant is specific to the space-charge limited model. For the floating surface, Equations (12) and (13) are used in Equation (11) to obtain
while for the biased surface, Equation (27) leads to,
These space charge limited currents can be used to compare ideal work functions. This is a convenient relation as it simplifies the complexities of plasma sheaths to a function of expected wall temperature and charge density in the flowfield. While these represent somewhat unattainable conditions, such relations are helpful in bounding the possibilities and pointing designers towards materials and systems that achieve ideal performance.
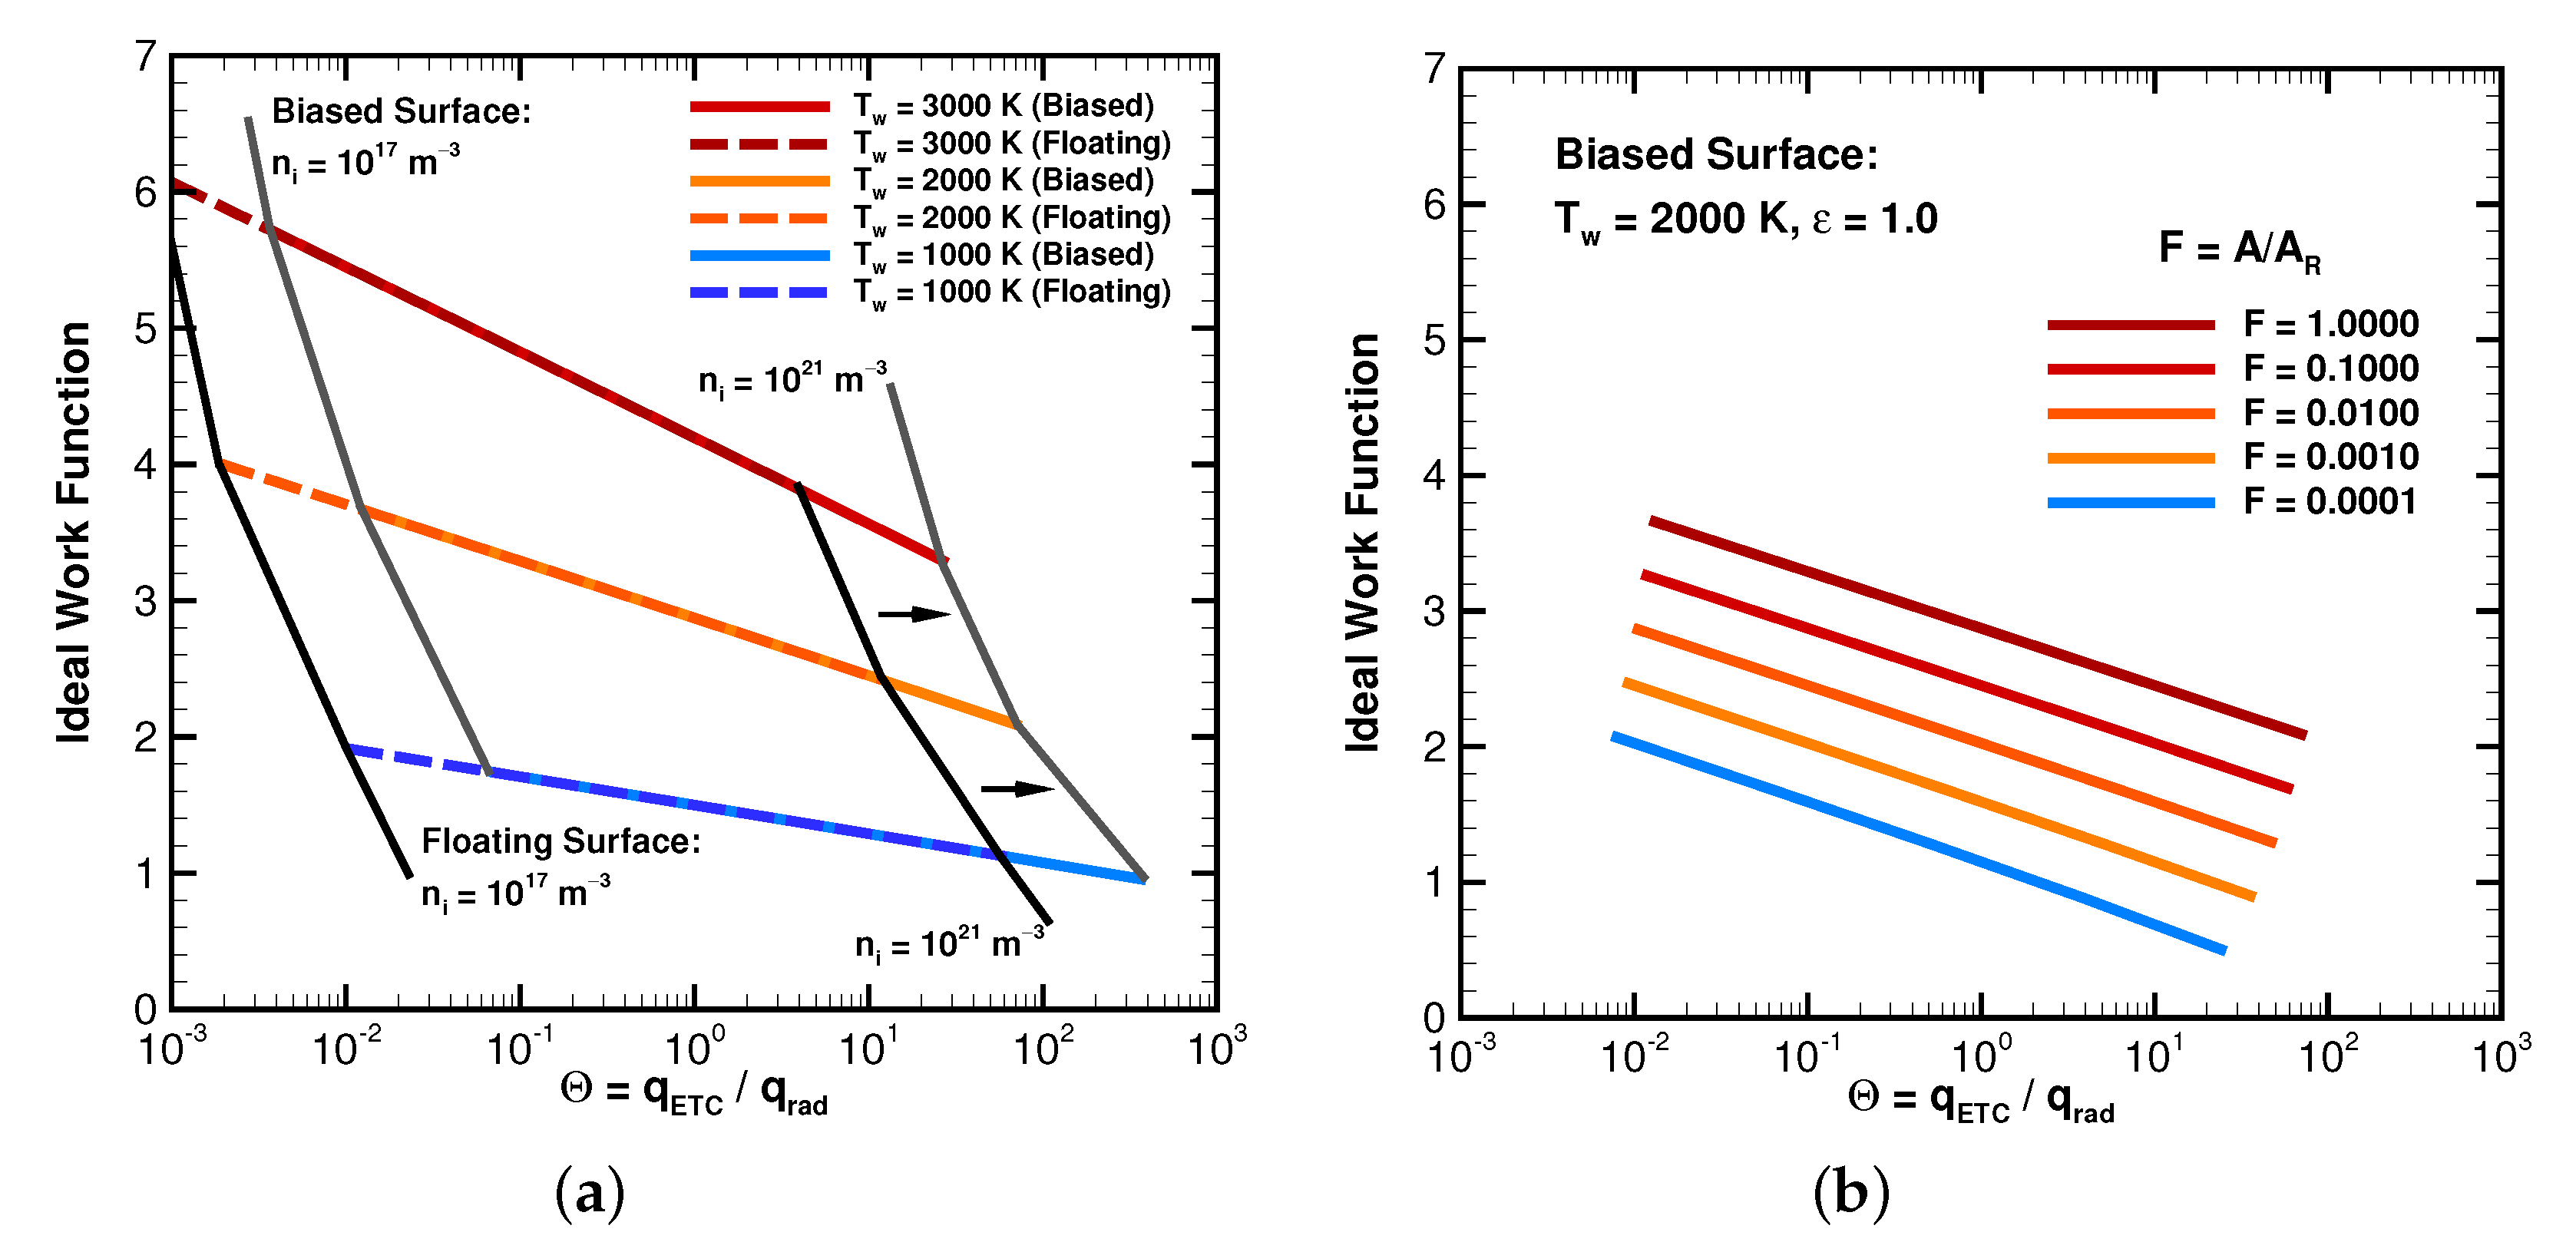
In Figure 4, the horizontal axis shows the same ratio of ETC to radiative cooling as used in Figure 1. For each value of or A, the curves represent an equal range of ion densities, as noted in Figure 4a. For these fixed flowfield conditions, a hotter wall will shift the curves up and to the left, meaning less cooling at a higher ideal work function. While for fixed wall temperature, a lower Richardson’s Constant, A, for a material will require a lower work function to obtain ideal emission, which will occur at a decreased level of cooling. For a material under similar conditions, that deviates from the ideal work function, space charge limitations are to be expected which may even lead to cases of excess heating to the surface. Finally, note how a biased surface allows for the throttling of the cooling capacity for a given scenario, shifting the curves to the right as indicated by the arrows in Figure 4a. This suggests a potential mechanism in controlling the surface bias in order to optimize cooling capacity given the charge environment. The improvement achieved from the biased surface can be approximated as the ratio of constants, 7.3.
In the following section, results from LeMANS simulations are presented over a range of torch conditions and compared to in situ and optical measurements. Cooling capacity of a thermionic material sample is modeled and compared to the non-ETC cases. Finally, space charge effects are considered and the distribution of ideal calculated.
3. Results
Following lessons learned from past studies of the ICP torch facility [25,43], flow conditions are uniformly set across the face of the inlet and determined based on facility test conditions (Table 1). Based on the chamber pressure and temperature, the initial density in the chamber is calculated to be 6.83 × 10 kg m. Note that these initial chamber conditions for the simulation are intended to represent the background conditions during a long duration test where the chamber has been heated by the torch. Temperature of the gas and, thus, level of ionization in the plasma, is controlled through the high-voltage coil which inductively heats the gas prior to entering the test chamber (see Figure 2). In order to calibrate CFD simulations to these current settings, a range of inlet conditions are considered. Selected cases are summarized in Table 2.
A selection of results from these simulations are presented next alongside experimental measurements of the high-enthalpy flows. Finally, surface temperatures and cooling rates are compared for various wall modeling options.
3.1. Torch Conditions
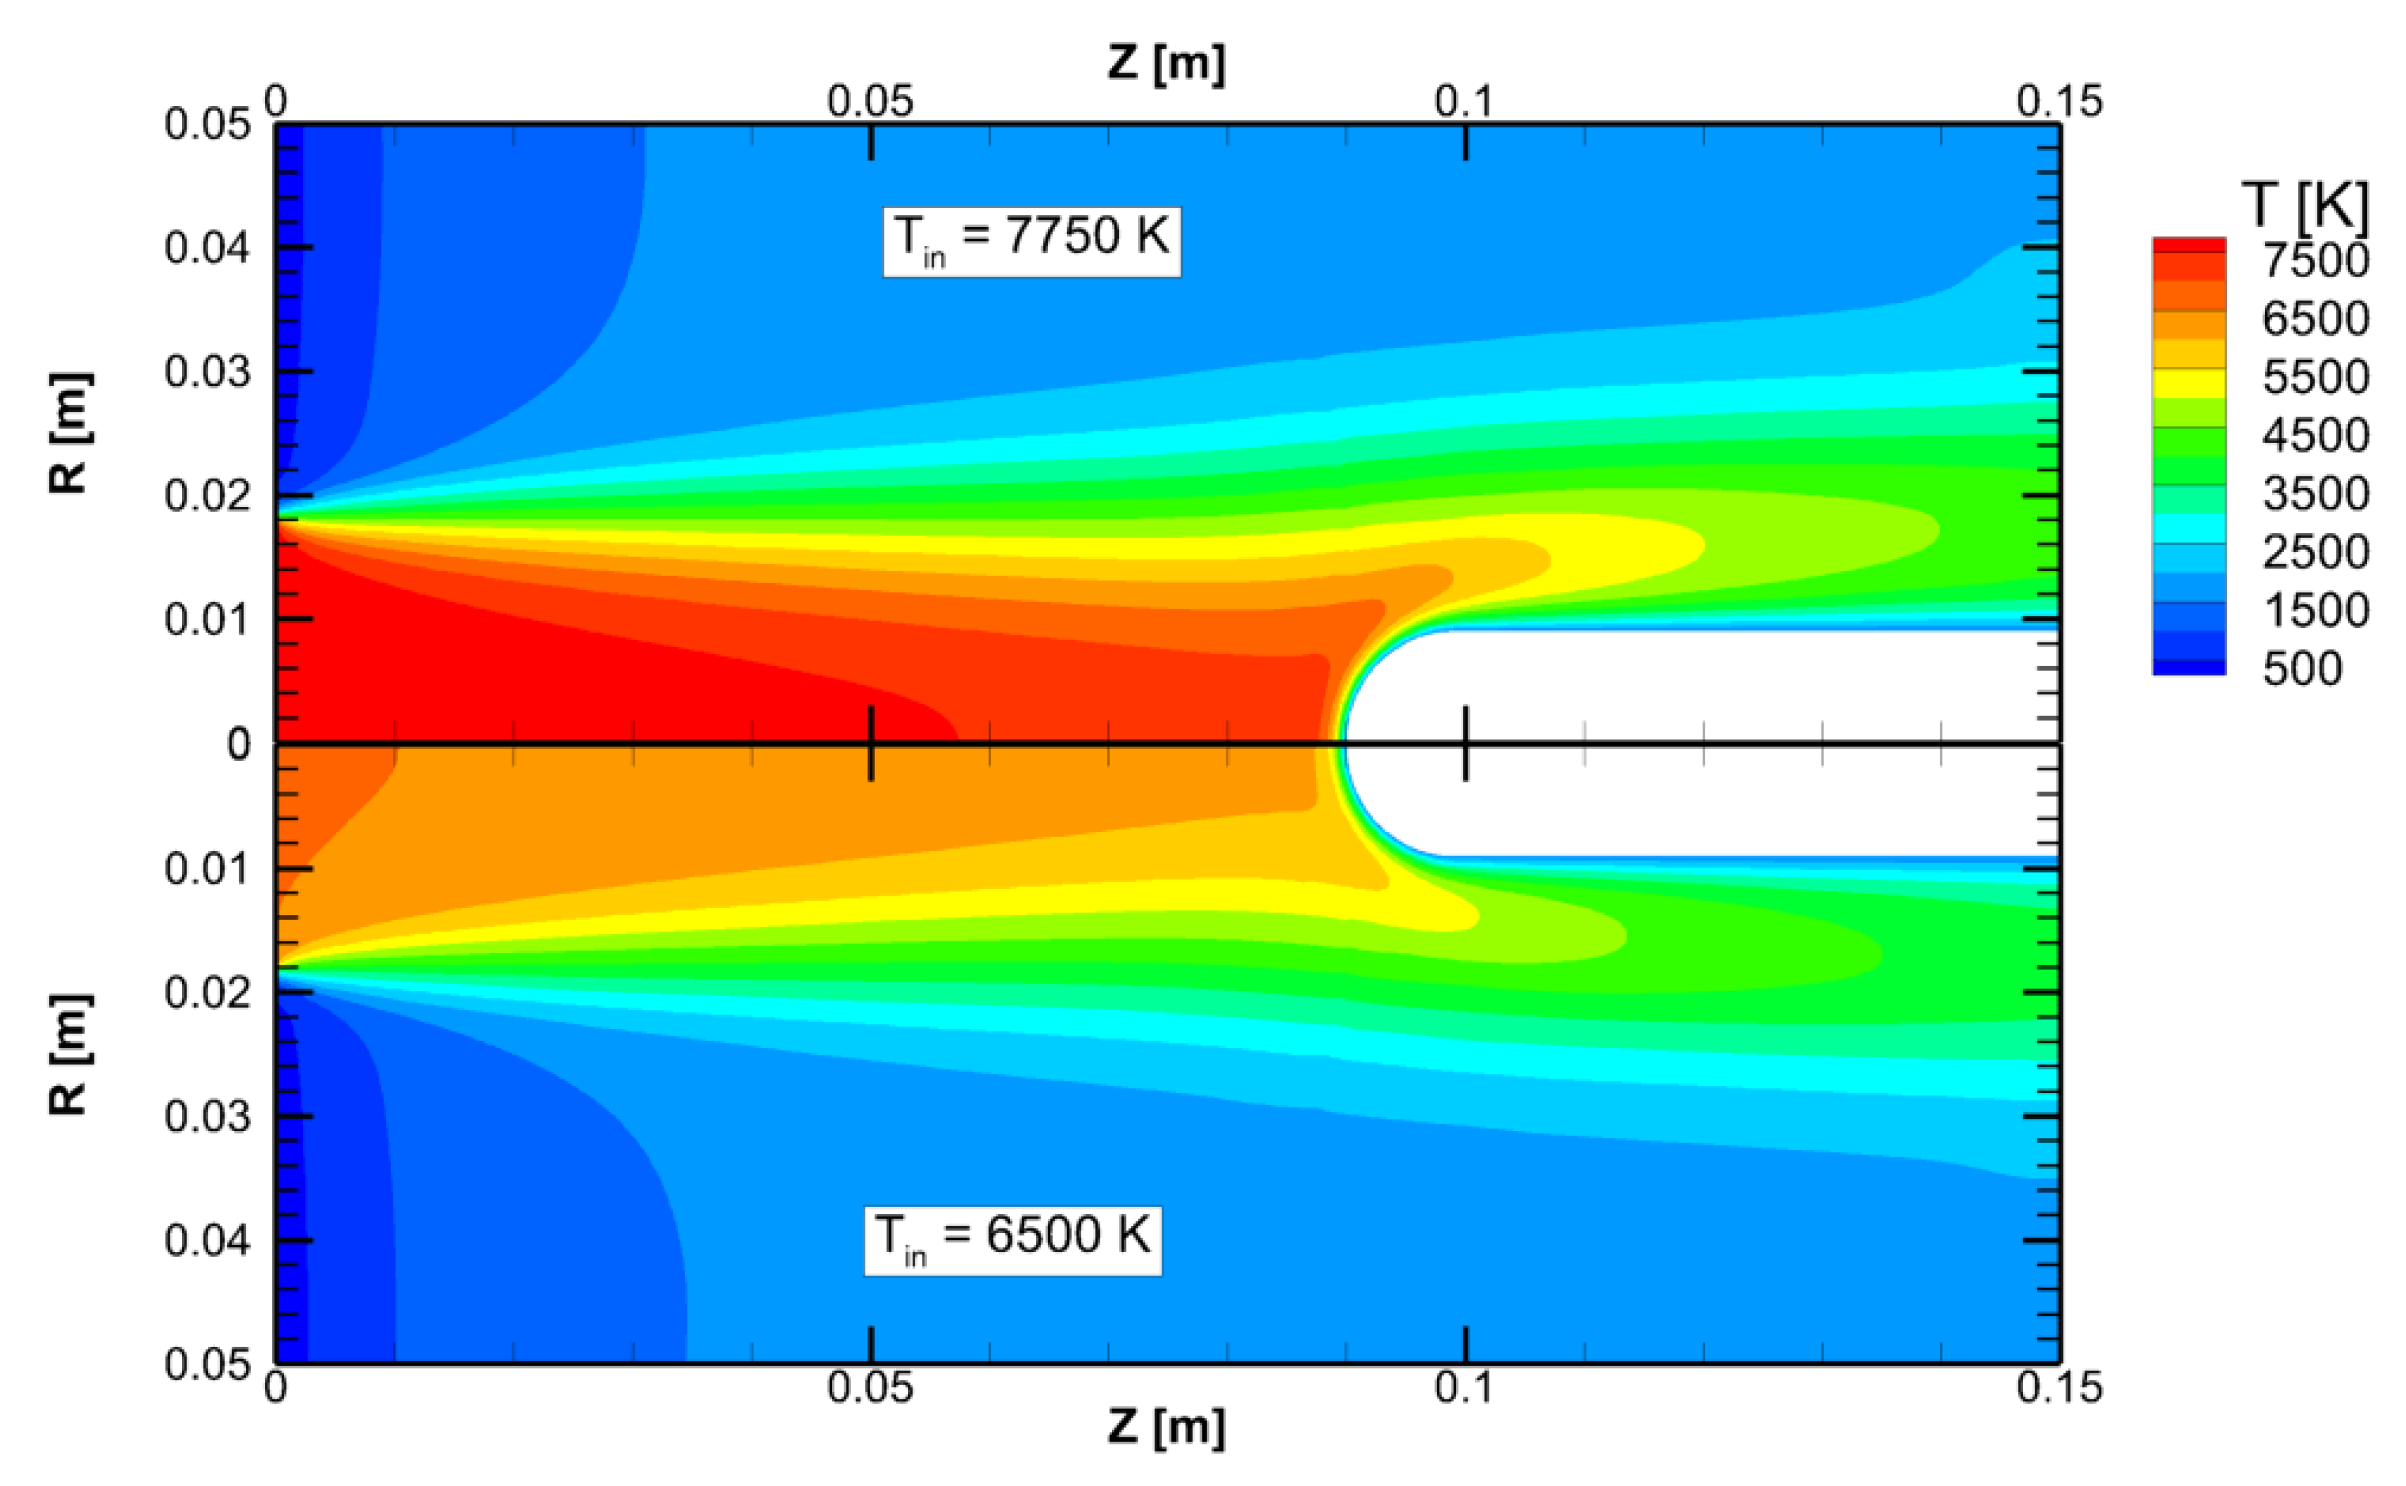
Figure 5 compares the bounding cases (1 and 6) temperature fields. As the torch current is increased, the front face of the sample is exposed to higher gas temperatures while the down stream and far field regions quickly dissipate to ambient conditions. Due to the low-speed nature of this experiment, ambient conditions can have noticeable effects on the CFD results and care should be taken when relating simulation results of cold chamber tests to the long-duration tests performed in a facility such as UVM’s ICP torch.
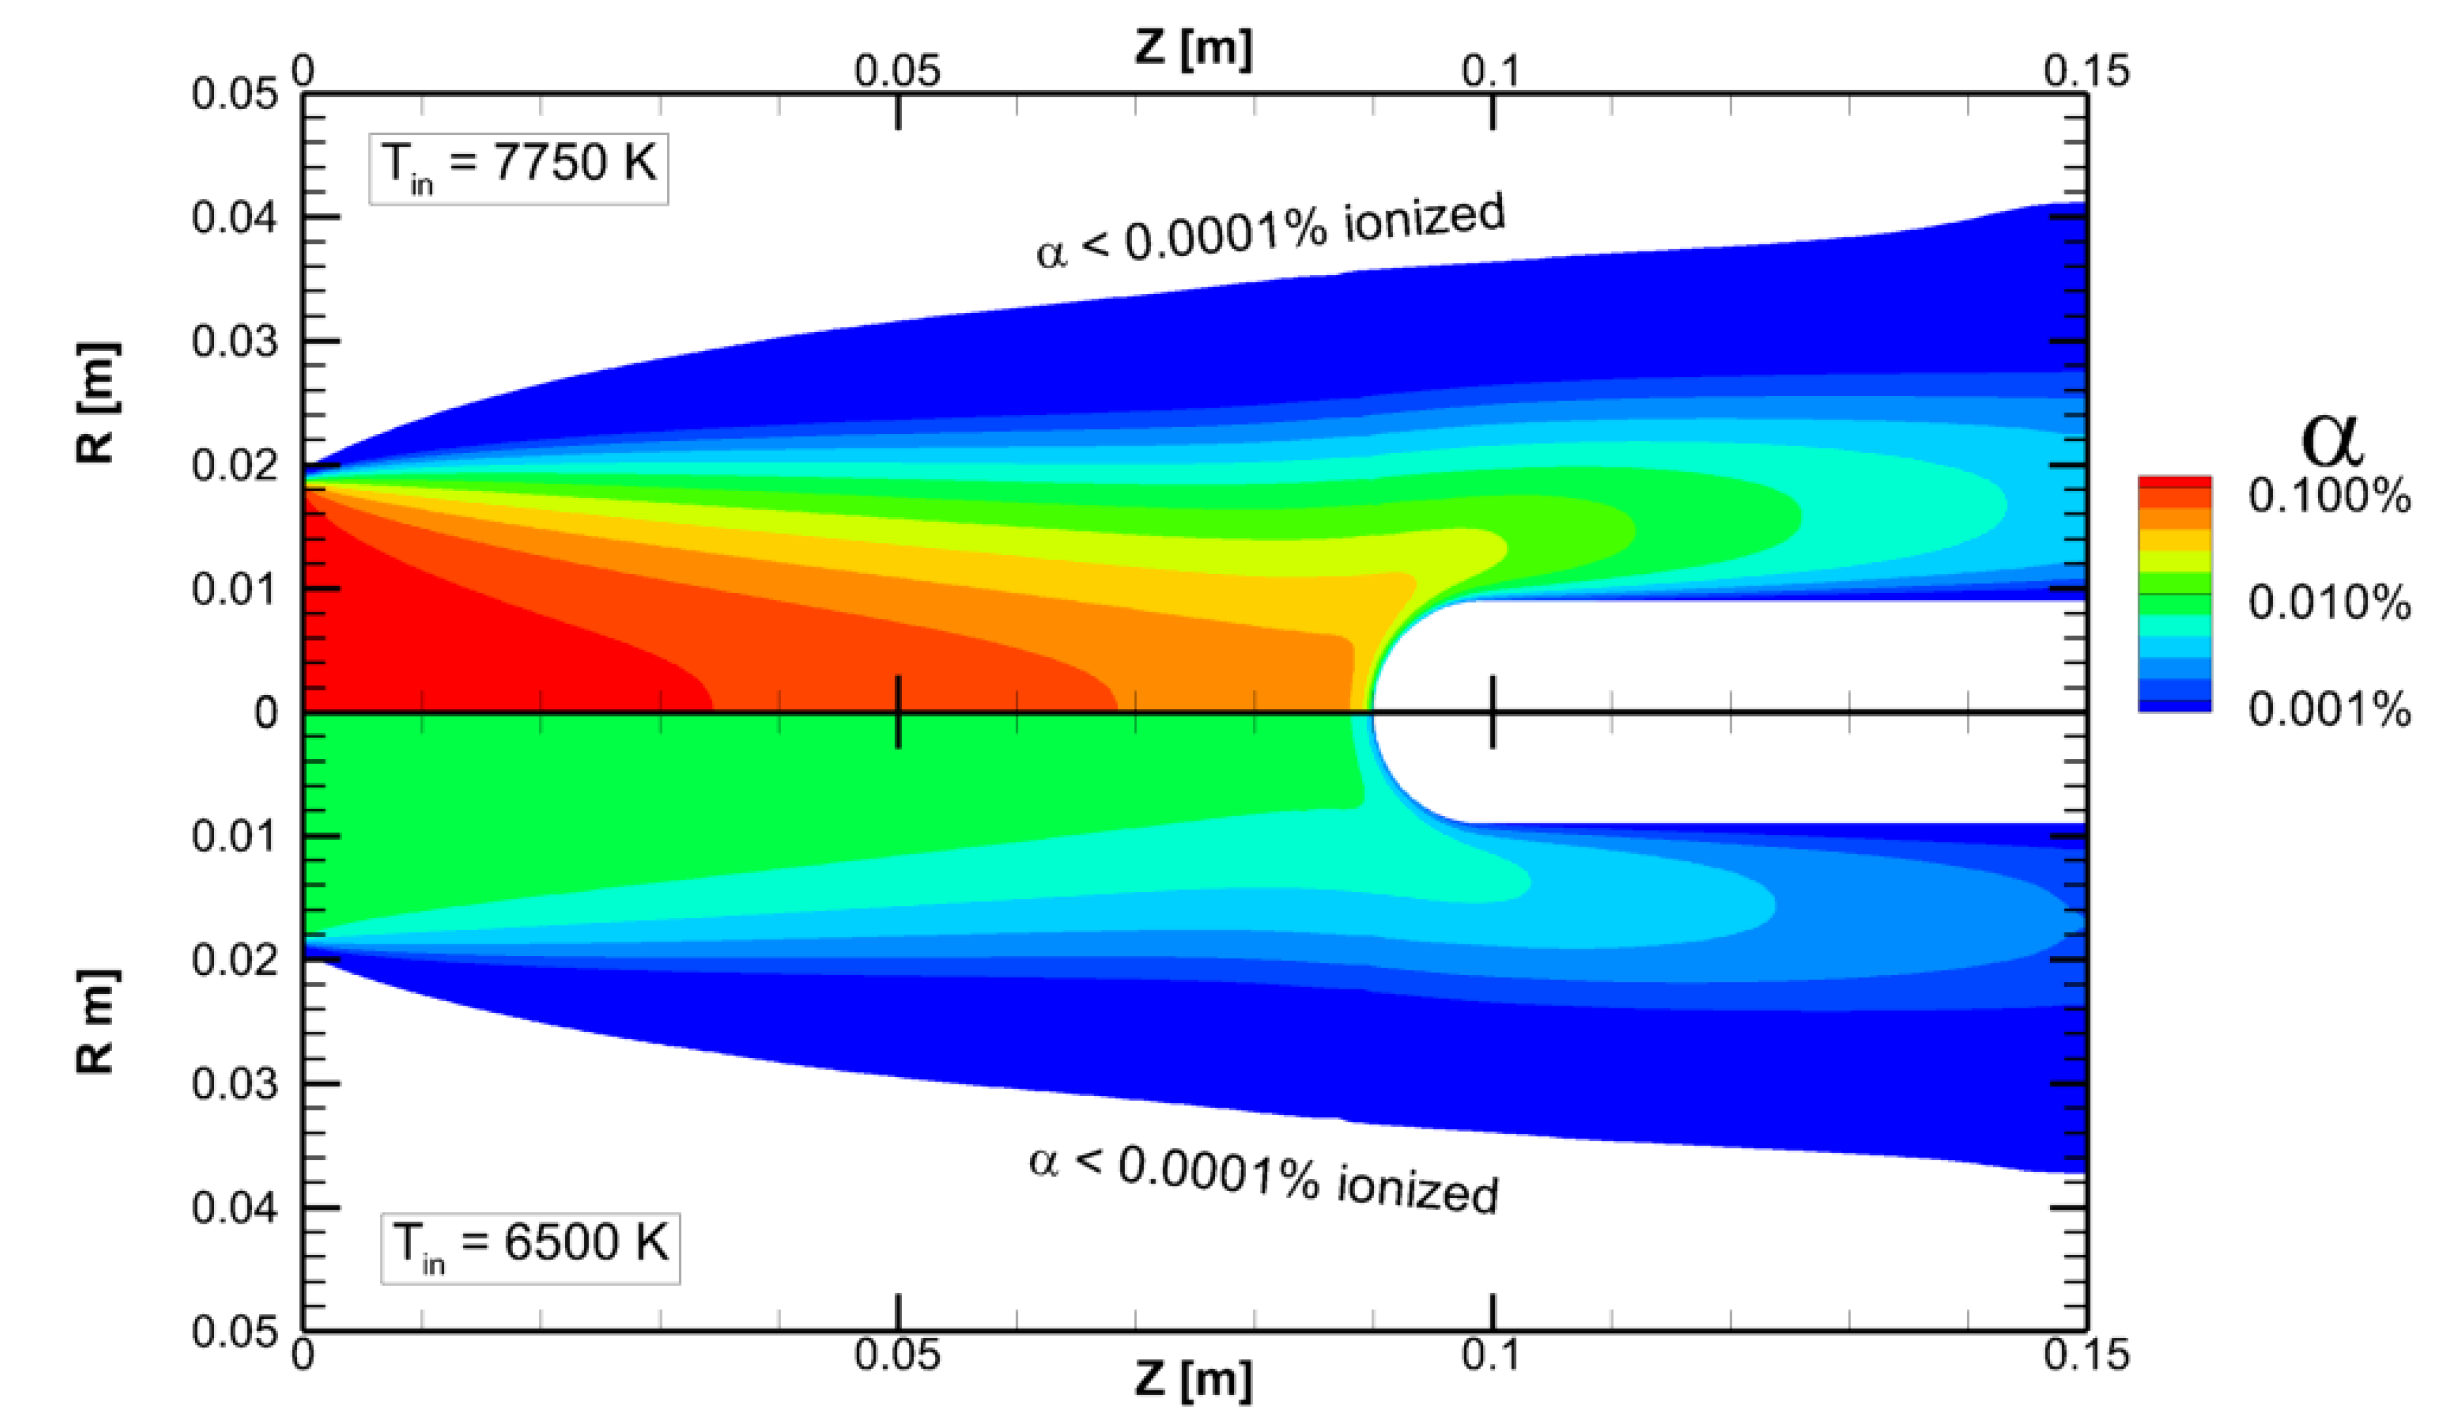
Figure 6 shows this same comparison but for the level of ionization in the flow, . Over the range of inlet conditions considered, the level of ionization entering the chamber increases by over an order of magnitude. This maximum quickly falls off radially, while the hot core of the flow carries the charged gas to the sample.
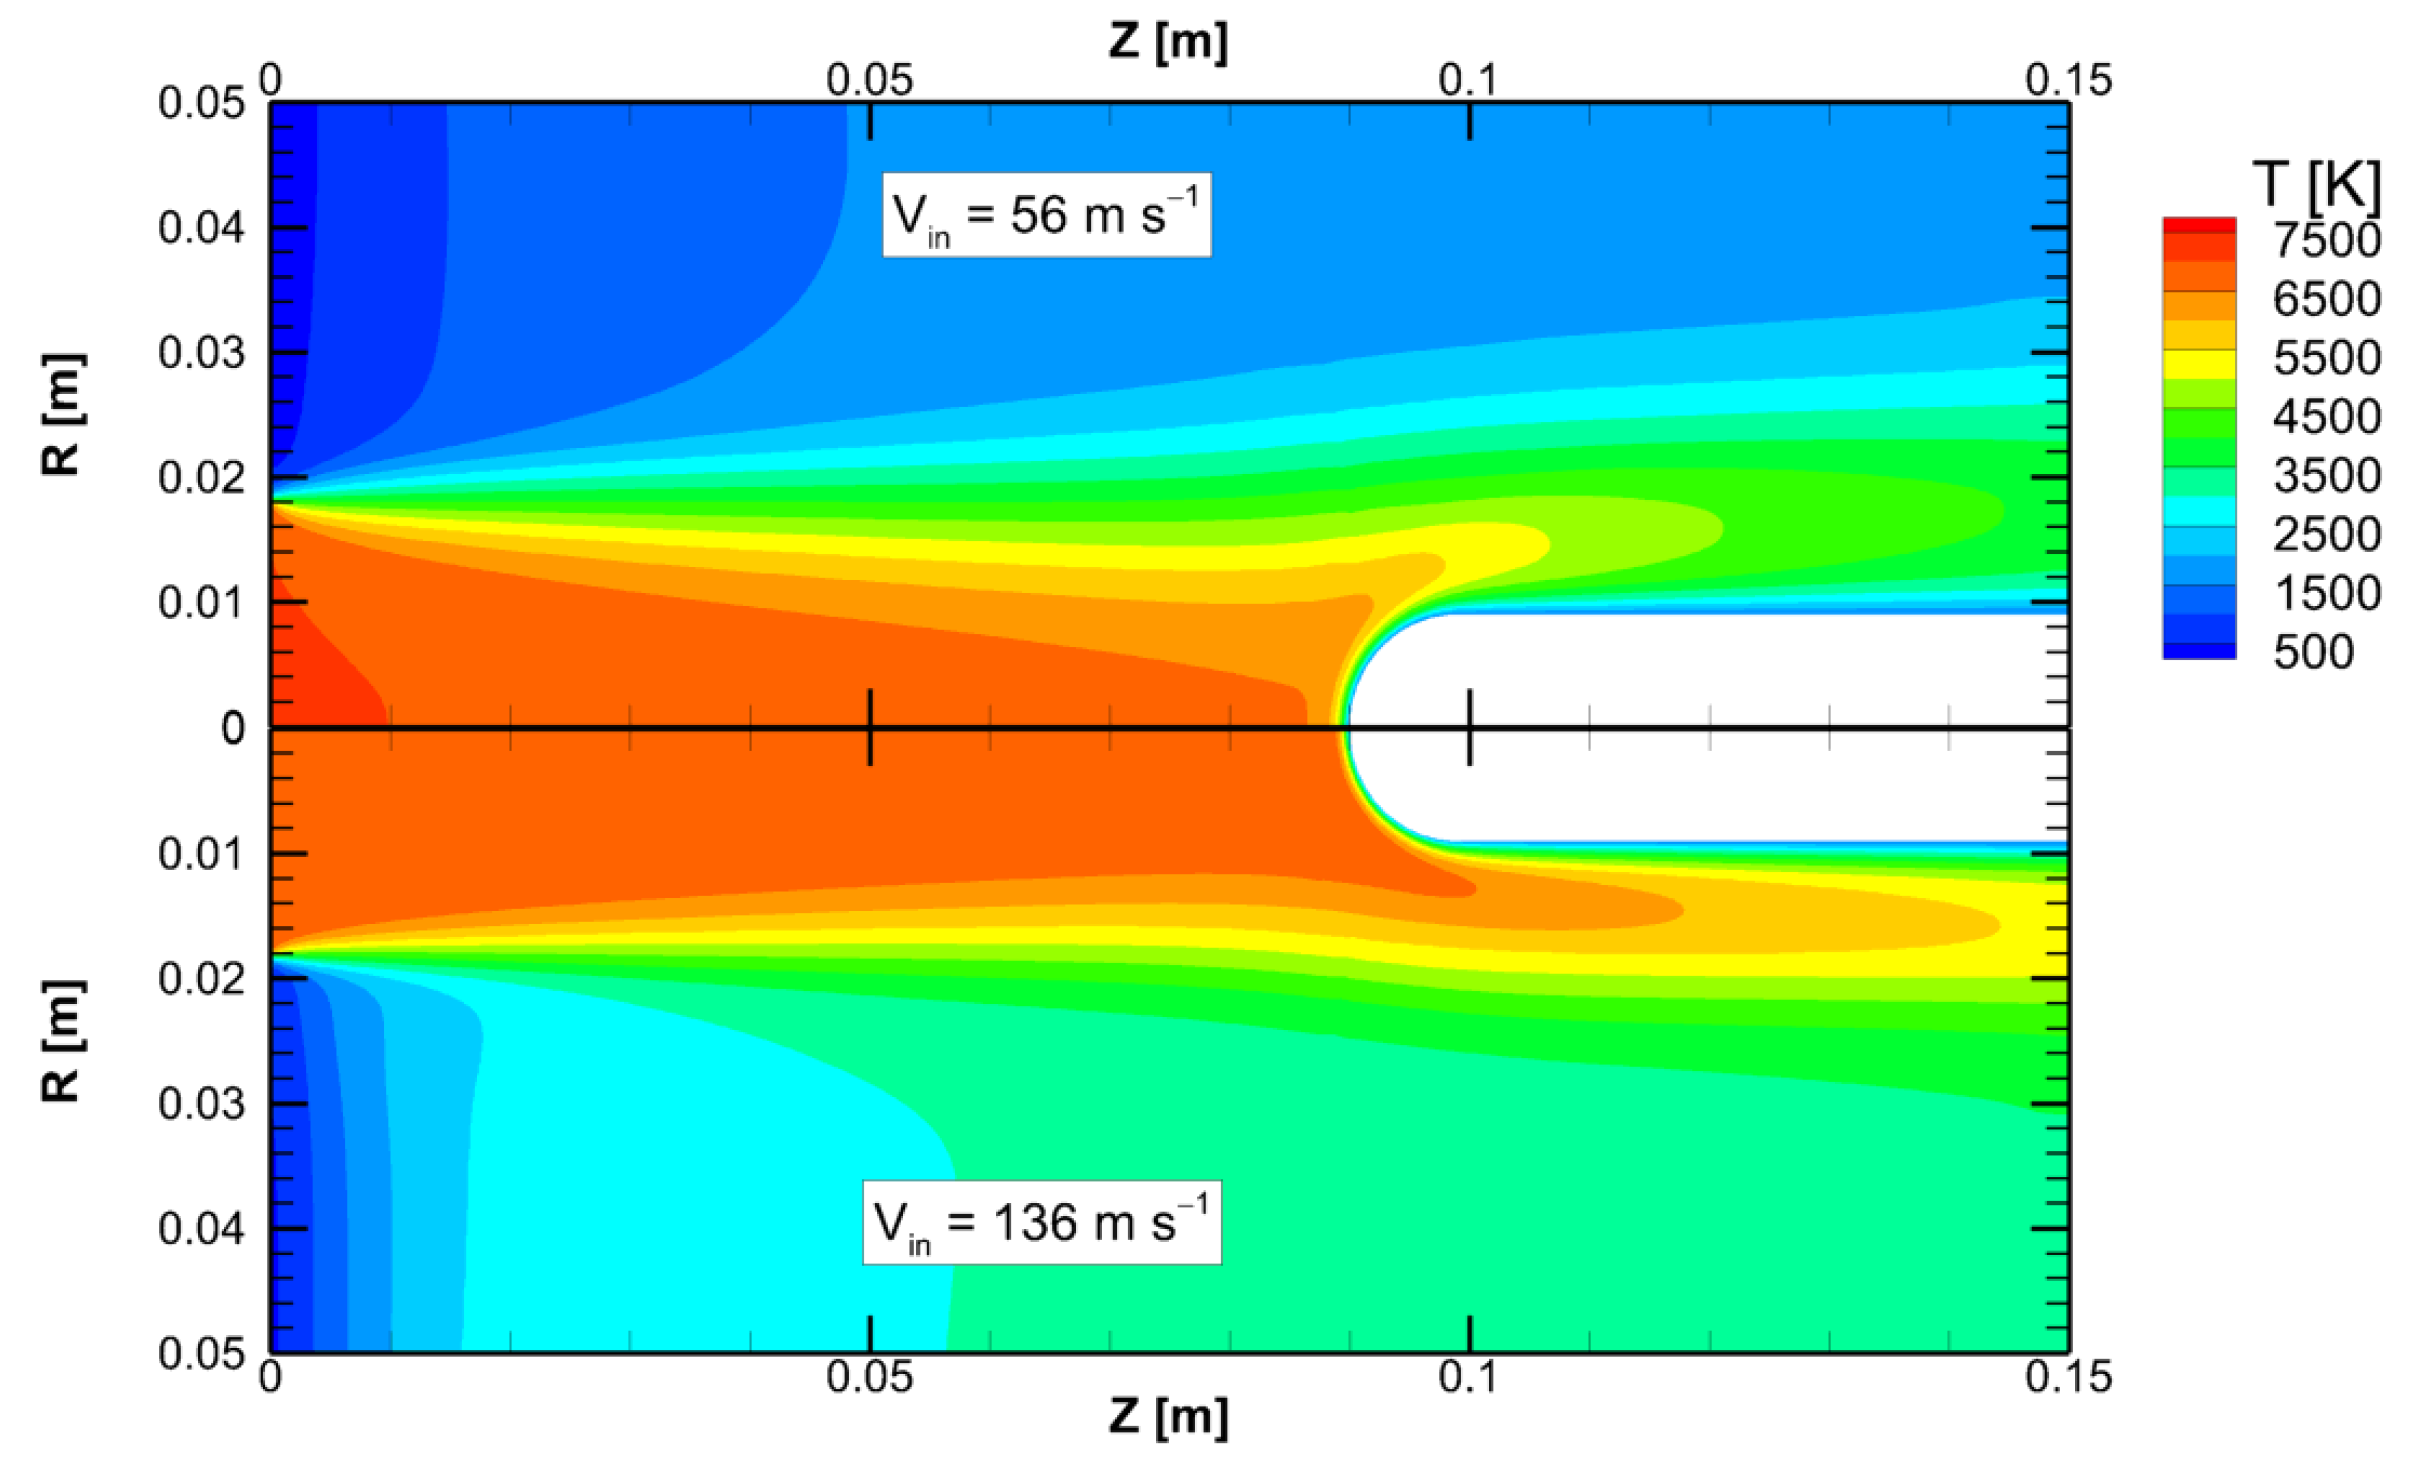
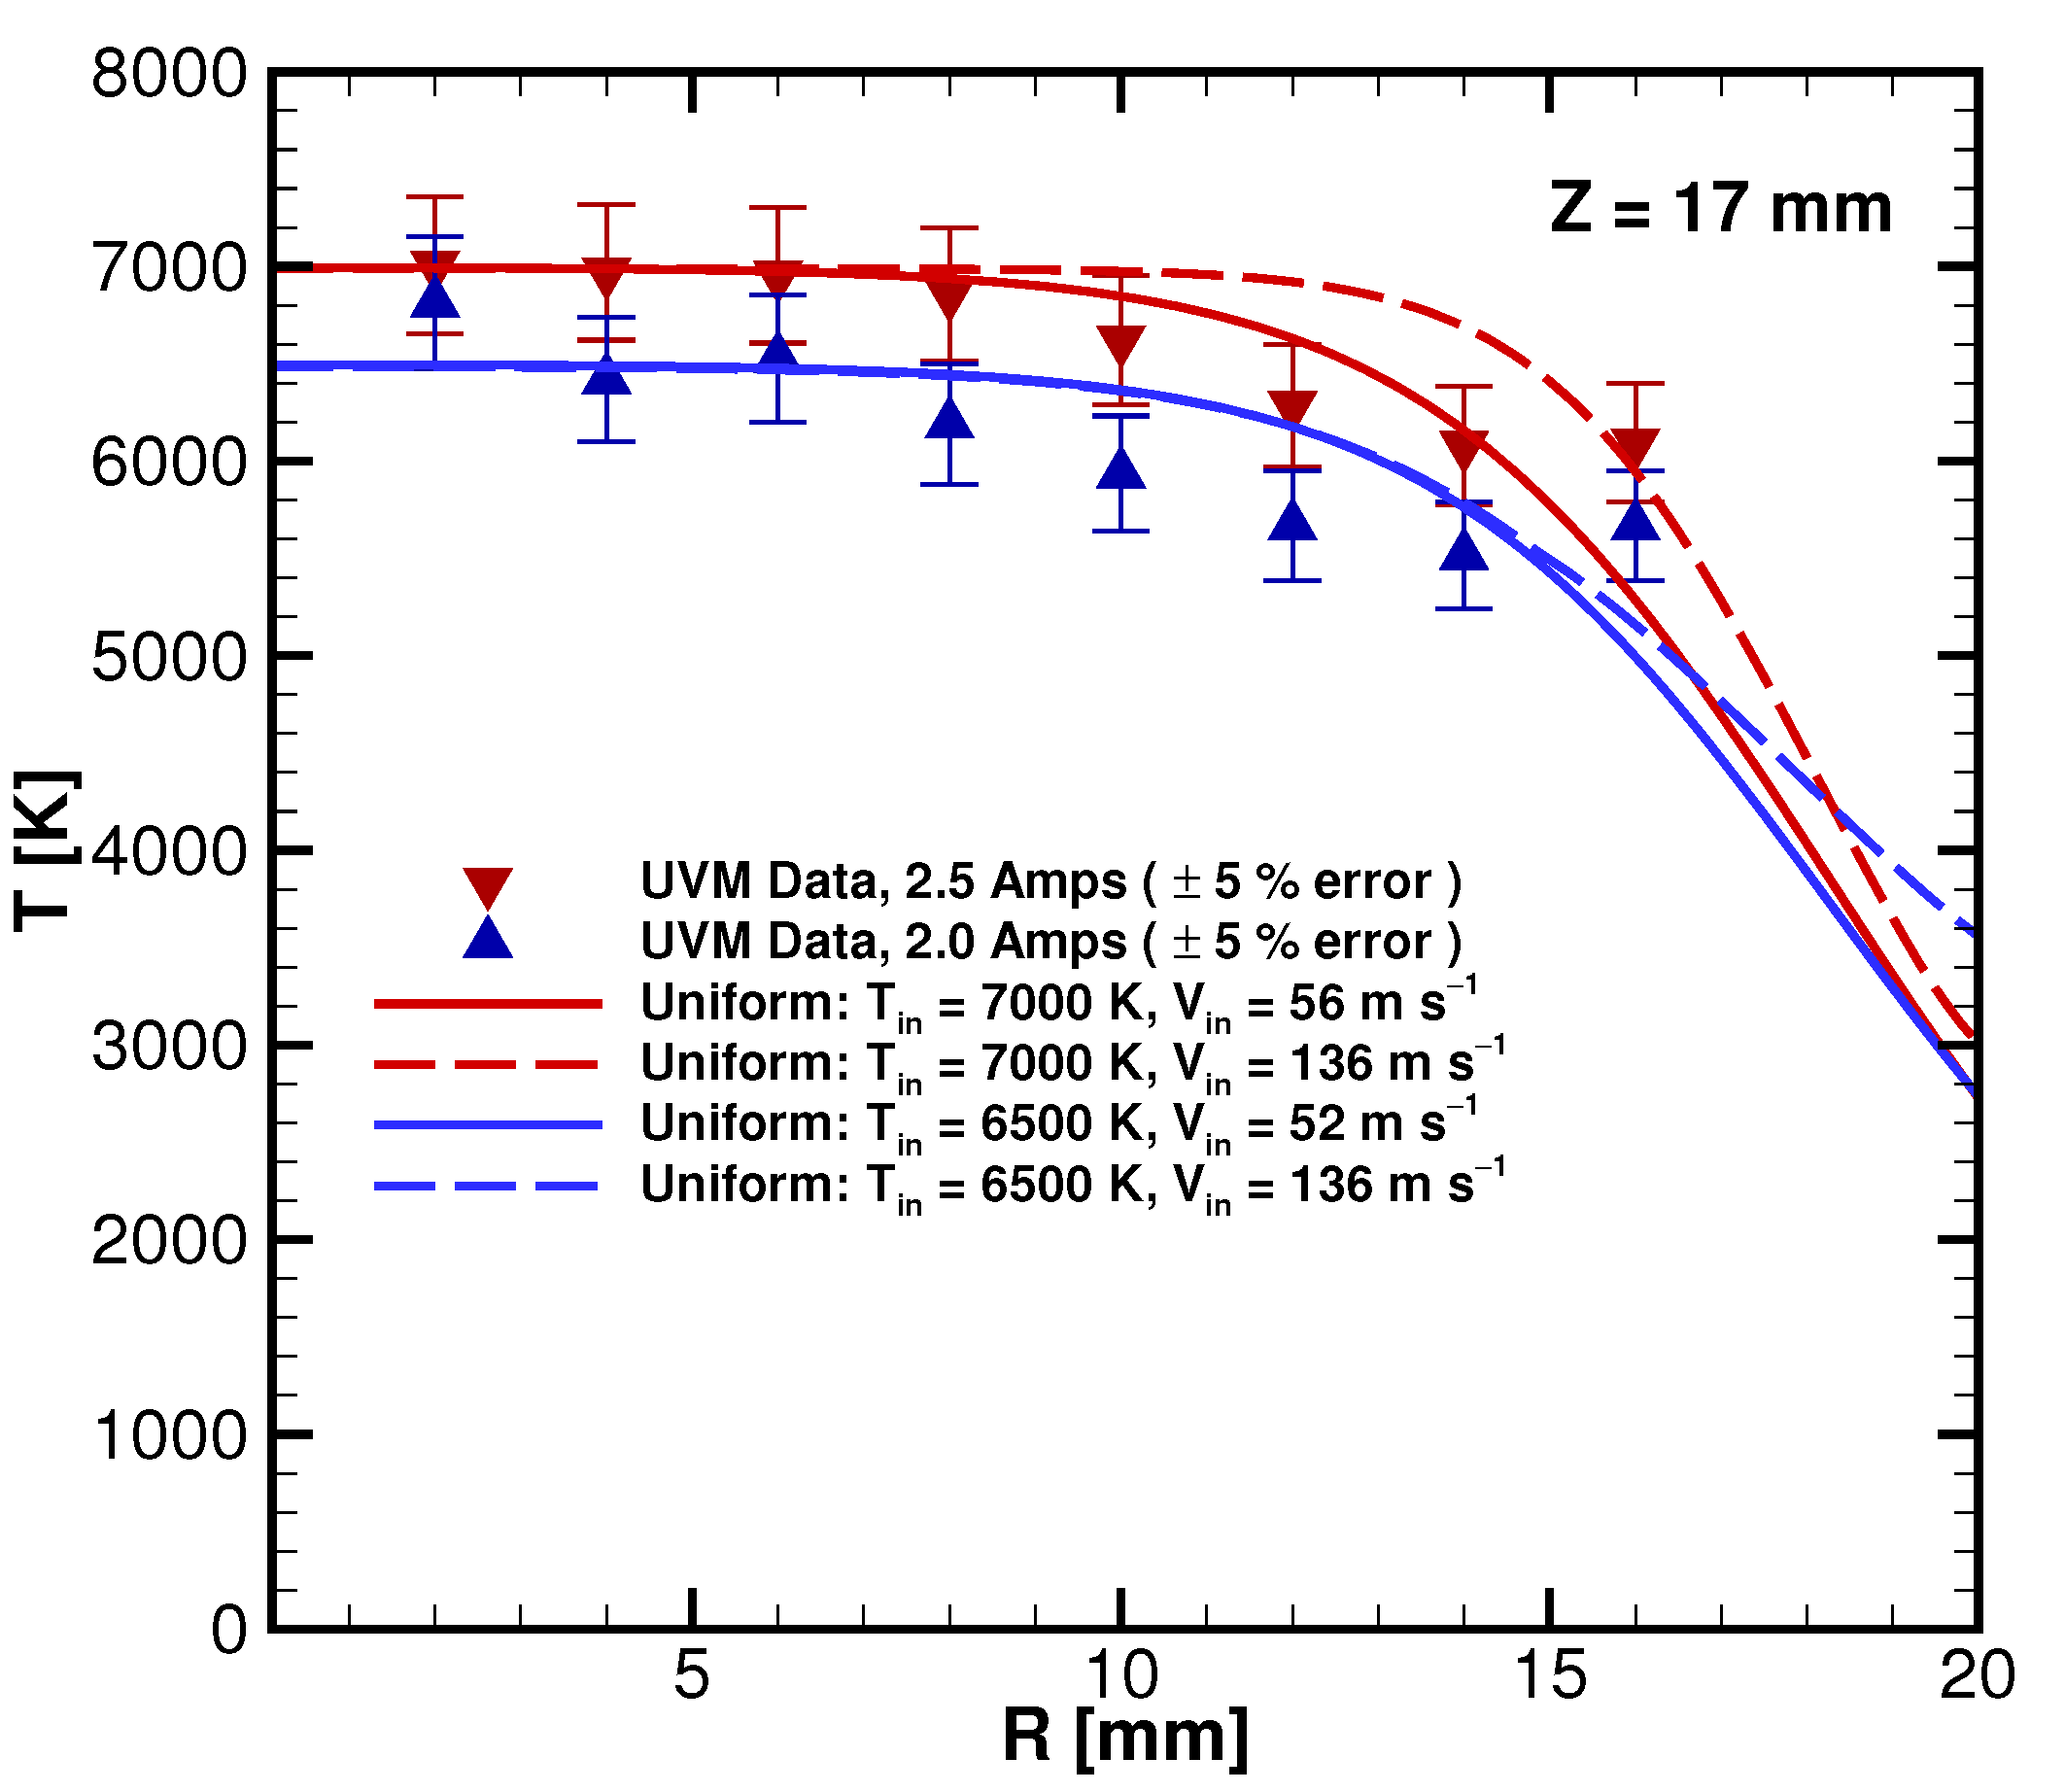
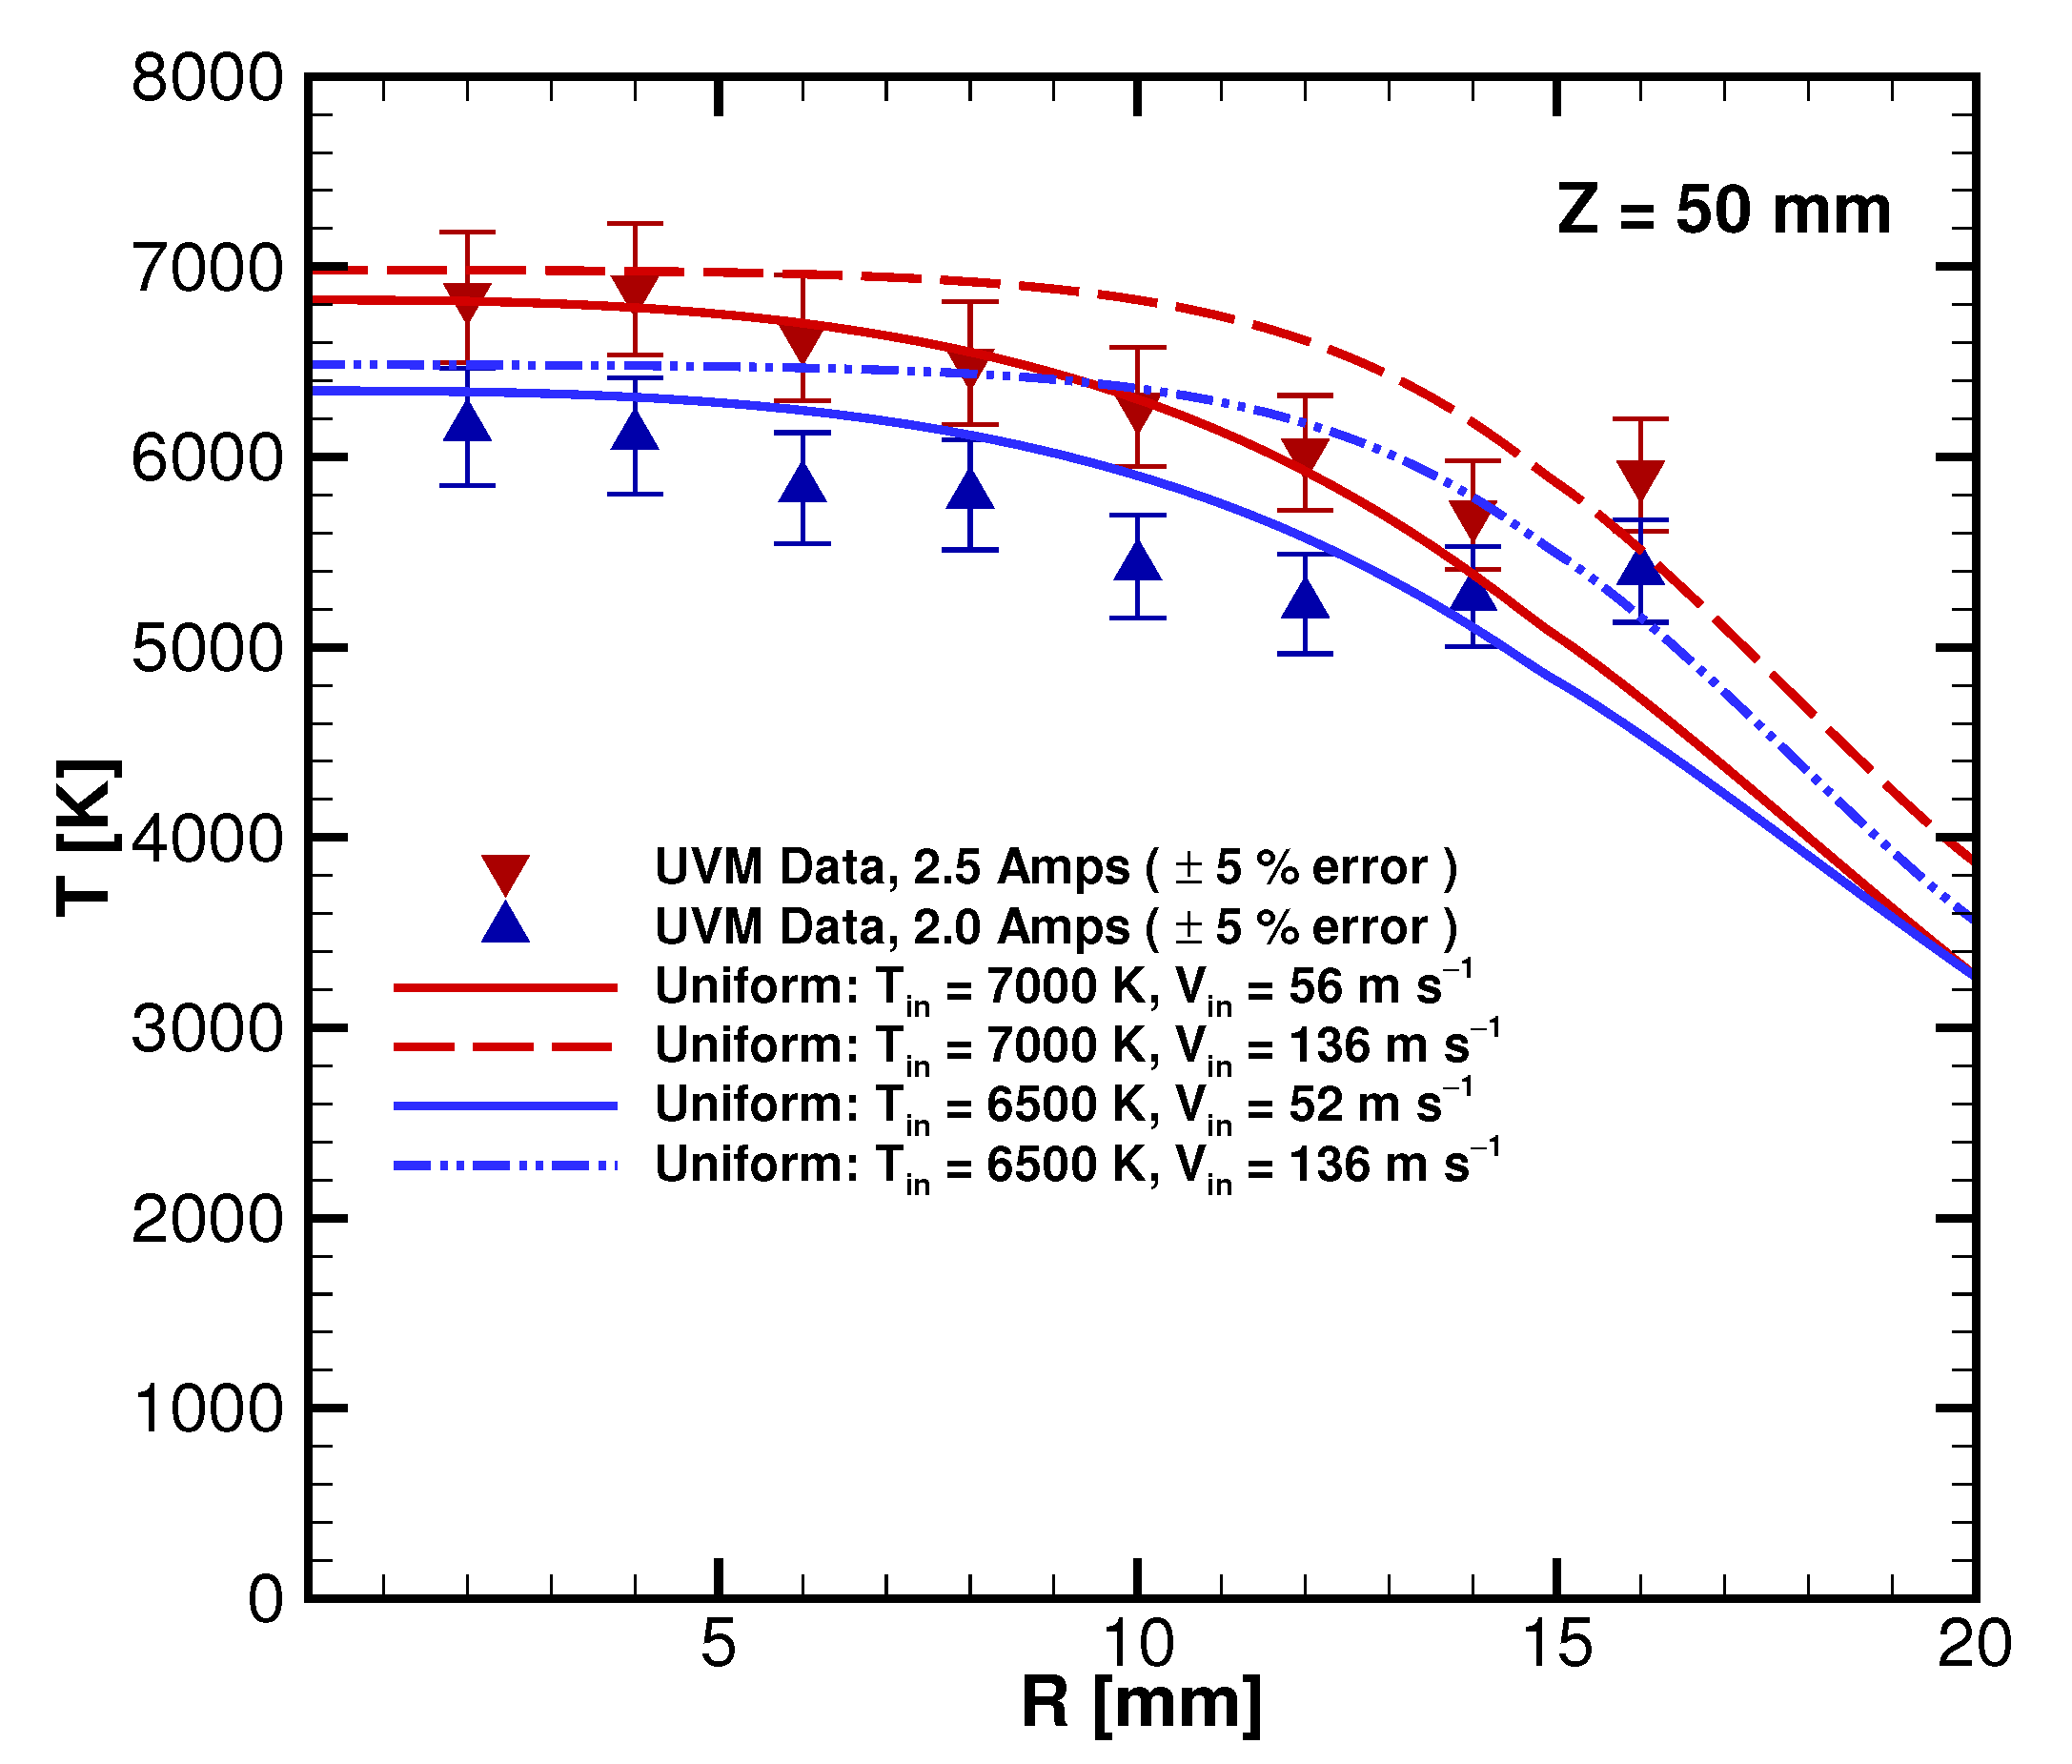
In addition to the inlet gas temperature, velocity was also varied independently to compare the two approaches previously used in modeling the UVM ICP torch facility [25,26]. Figure 7 compares the temperature fields for cases 3 and 4, where = 7000 K but density and velocity settings differ. Plasma temperatures were experimentally determined by measuring argon line emission along radial profiles at various axial locations [19]. These measurements are compared to the computed profiles in Figure 8 and Figure 9. Overall, the cases of = 6500 K to 7000 K bound the experimental values, within the 9 mm radius of the sample. Note that the data for the middle level of torch current, 2.2 A, are not included but fall between the points shown.
Away from the centerline, the effect of the different modeling decisions can be seen (Figure 8). While both inlet conditions match up with measured temperatures near the centerline, as R increases, the measured data are bounded by the two velocity inlet models. Note that 5% error bars were added to the experimental data to help quantify the discrepancy with simulations. However, this value of error has not yet been characterized for the specific experimental technique.
The faster jet pushes the core values to higher radial positions. This feature can also be seen in Figure 7. These same cases are shown in Figure 9, for a radial measurement farther downstream of the inlet at 50 mm. Here, the jet has more time to interact with the ambient and increased differences can be seen from changes to the operating conditions.
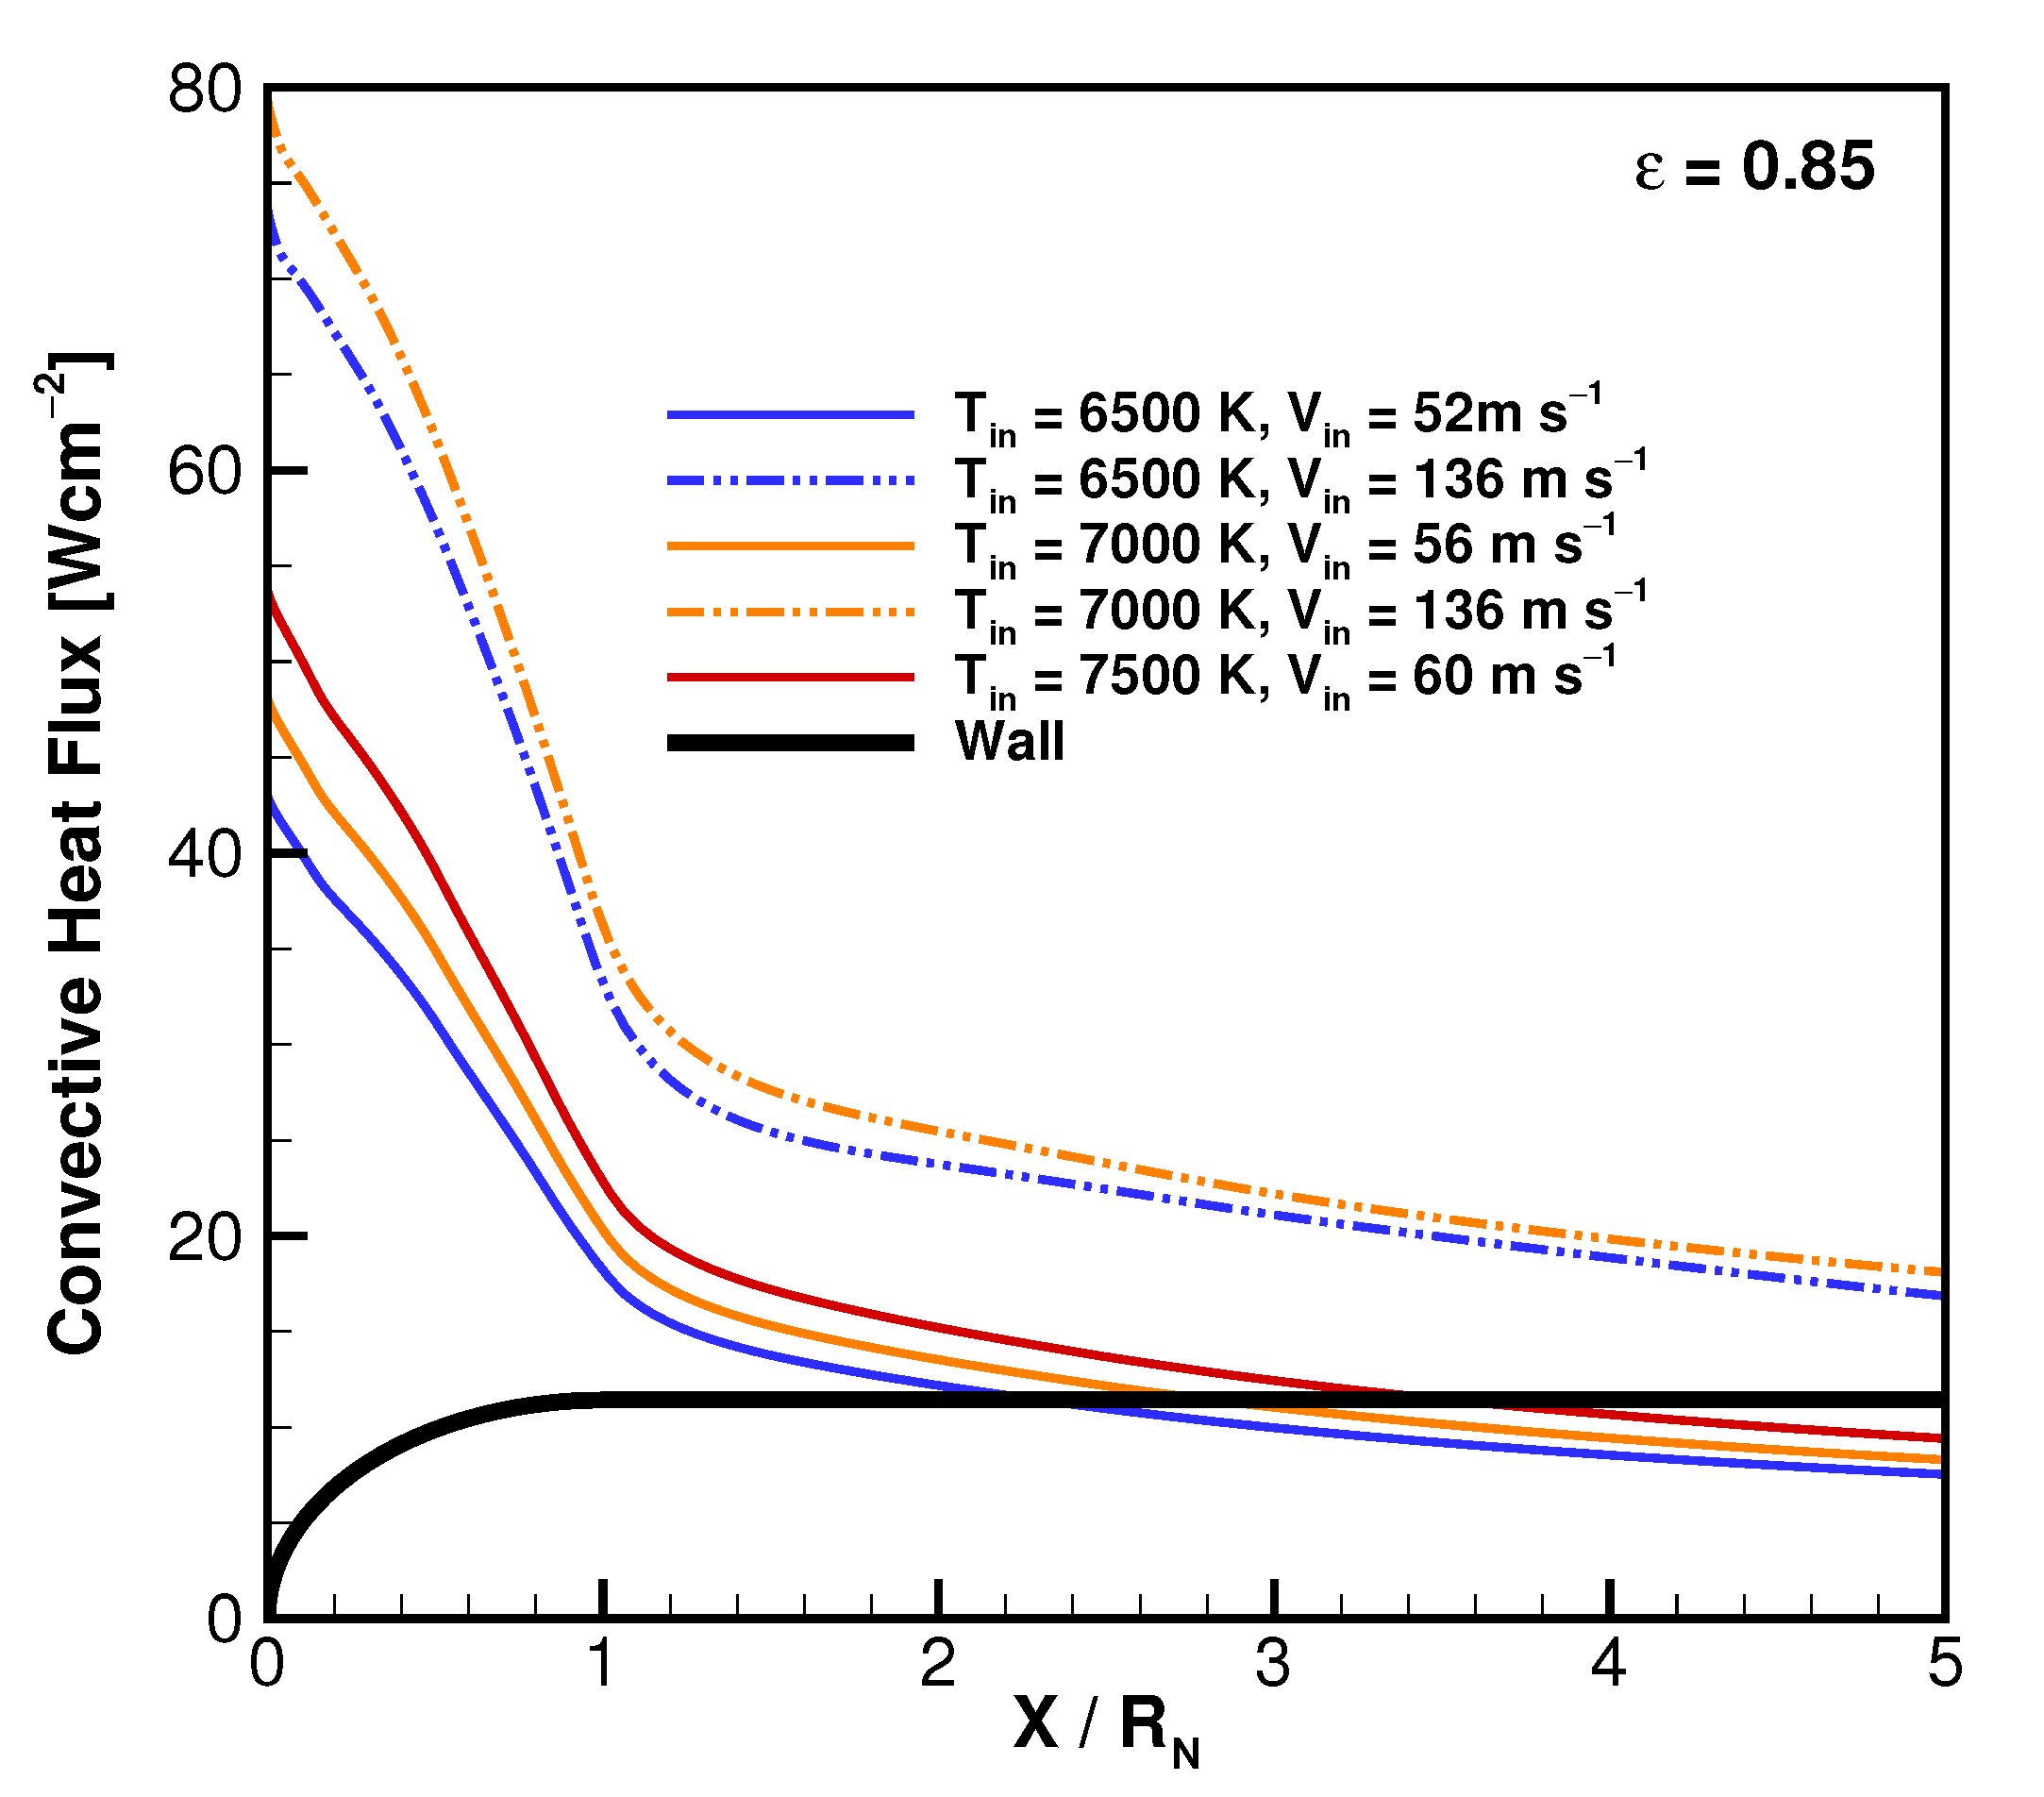
Prior to considering the thermionic response of the sample, the baseline wall heating conditions are characterized. Figure 10 provides the distribution of convective heat flux over the sample’s surface for different inlet conditions with a wall having an emissivity of 0.85. This property was chosen based on the specific POCO graphite being used (https://www.entegris.com/content/dam/web/resources/brochures/brochure-properties-and-characteristics-of-graphite-7329.pdf (accessed on: 15 June 2021), POCO Graphite Material Data from entegris.com (accessed on: 15 June 2021). This was also the emissivity used in capturing the IR surface temperature data.
Heat flux measurements were taken in the ICP torch facility using a 12.5 mm radius slug calorimeter with values ranging from 24 W cm at 2.0 A to 42 W cm at 2.5 A. Since the sample has a radius of 9 mm, one could expect an 18% increase in the maximum heat flux to the sample. This adjusts the range from 28 W cm at 2.0 A to 50 W cm at 2.5 A. This suggests the slower inlet (case 3) provides a better estimate of the torch conditions. However, it is important to recall that the slug calorimeter has a fundamentally different distribution of heat flux across its body, having a peak heat flux that occurs on the probe’s shoulder, as opposed to the stagnation point along the centerline. Thus, direct scaling based on nose radius is not feasible. Regardless, the simulated results reproduce the proper trends as seen in the experiments when varying the torch temperature under fixed chamber conditions.
3.2. ETC Results
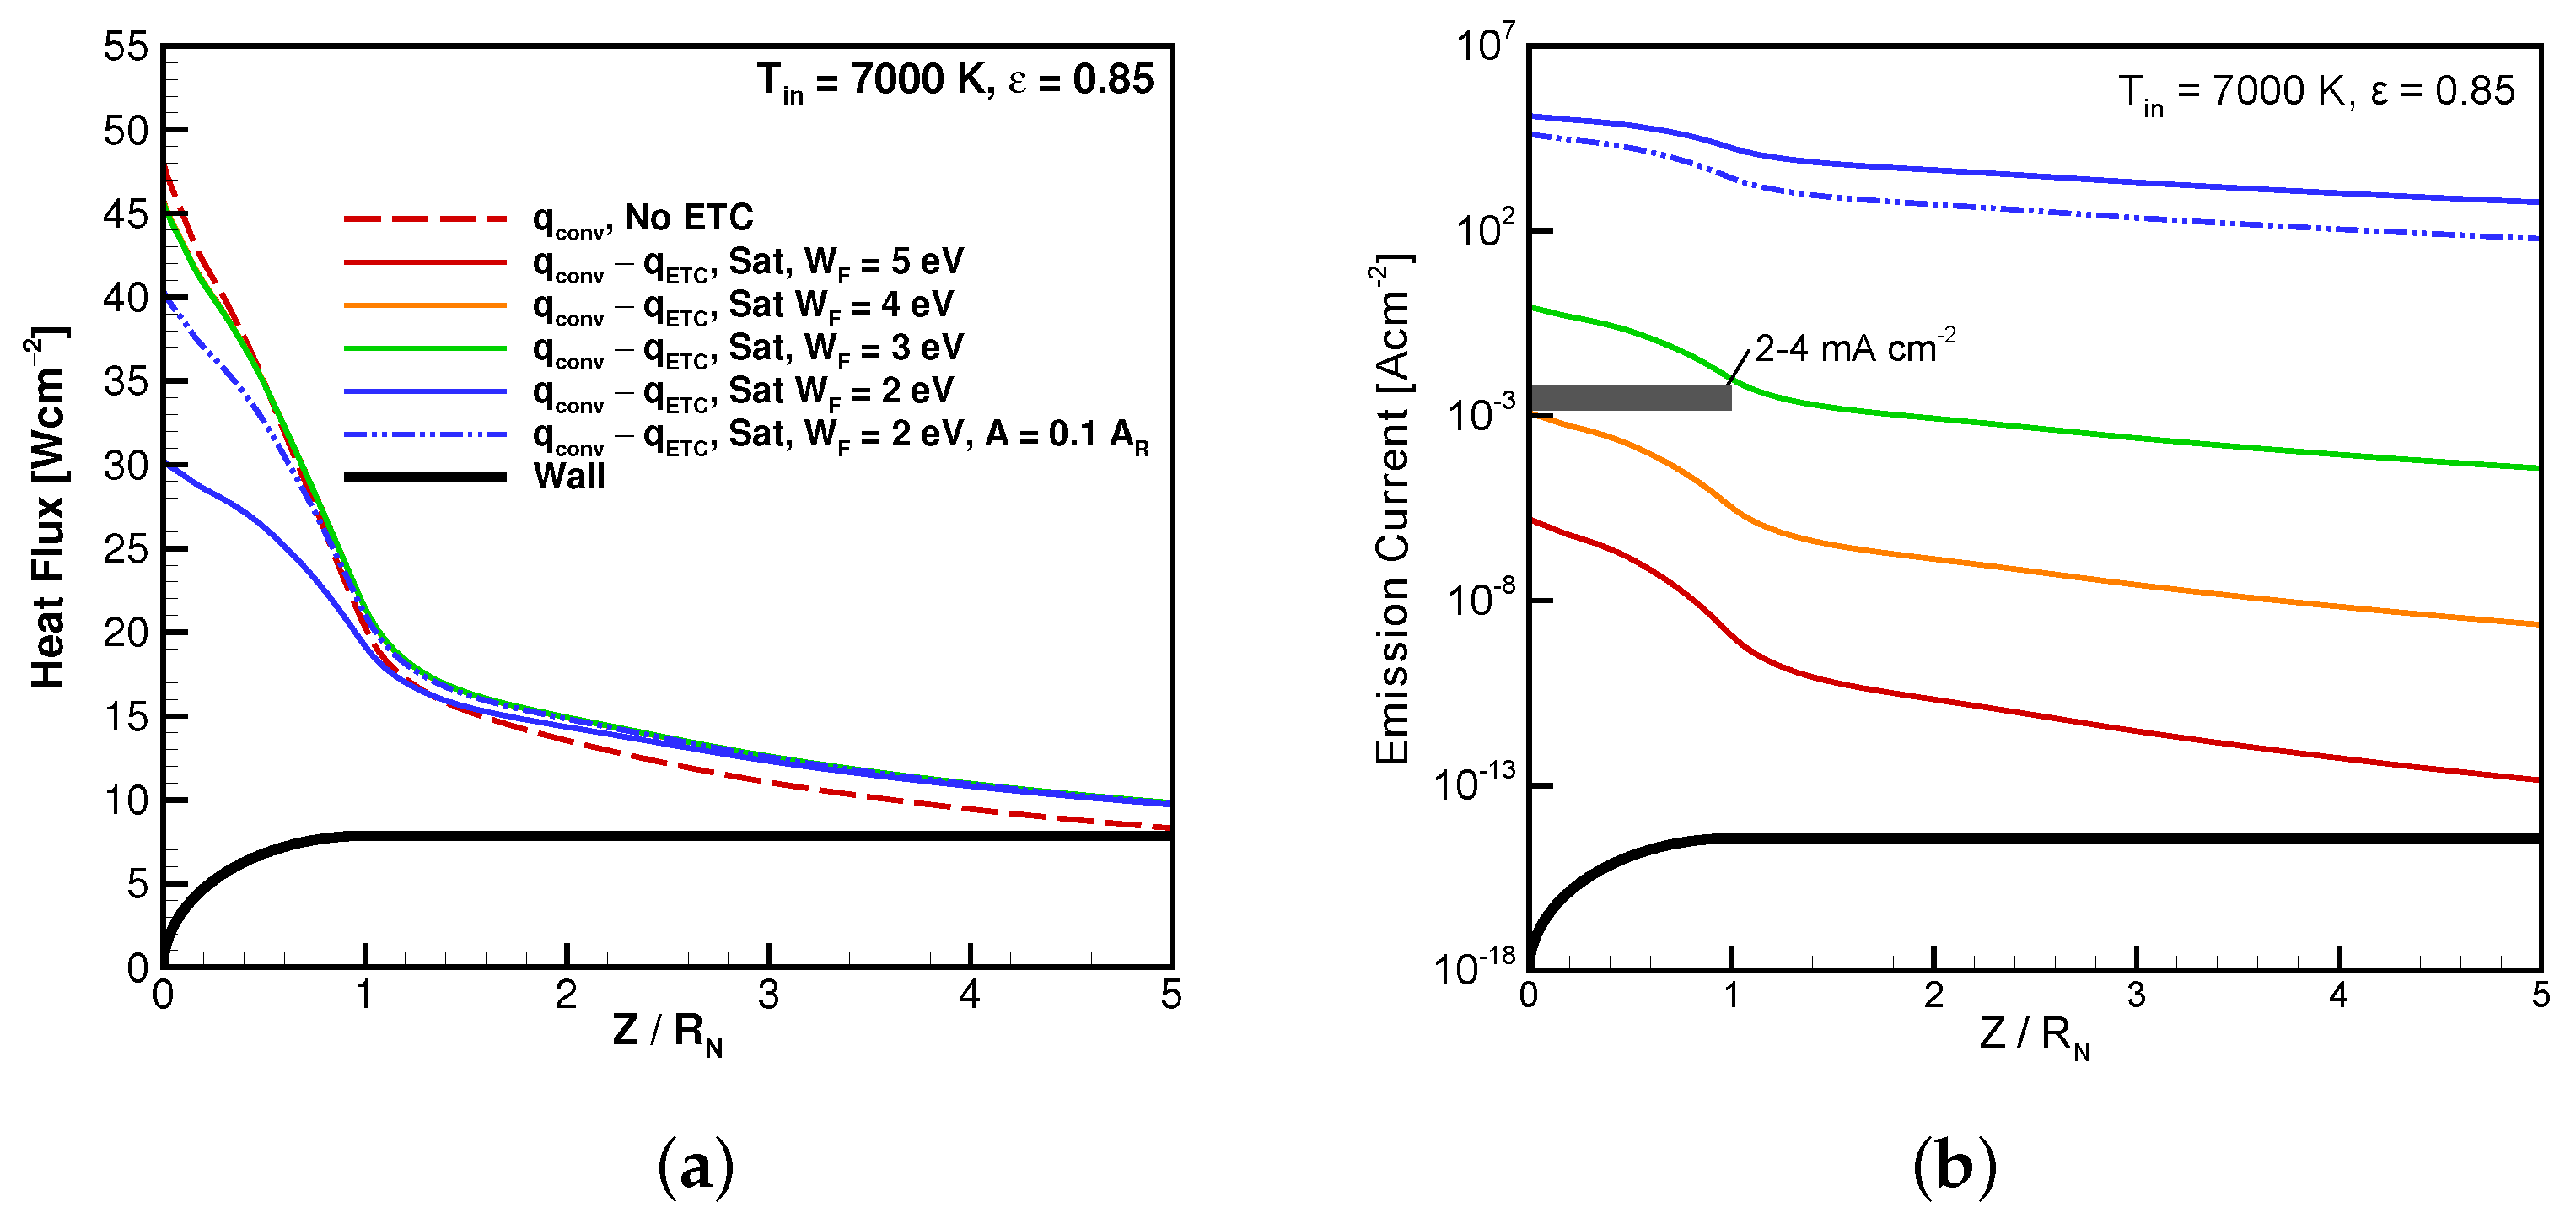
Finally, the LeMANS-ETC functionality is used to simulate the coupled physics of the thermionic surface and high-enthalpy gas jet. Graphite is considered to have a work function ranging from 4.65–5.0 eV [44,45,46]. To fully understand the potential of other materials under the same test conditions, surfaces with = [2.0, 3.0, 4.0, 5.0] eV are analyzed. The net heat flux between convection and ETC are plotted in Figure 11a. In addition, one case is run with a Richardson’s constant that is one tenth of the ideal value for metals (i.e., ). This is based on the measured constant for Carbon, which is A cm K [13].
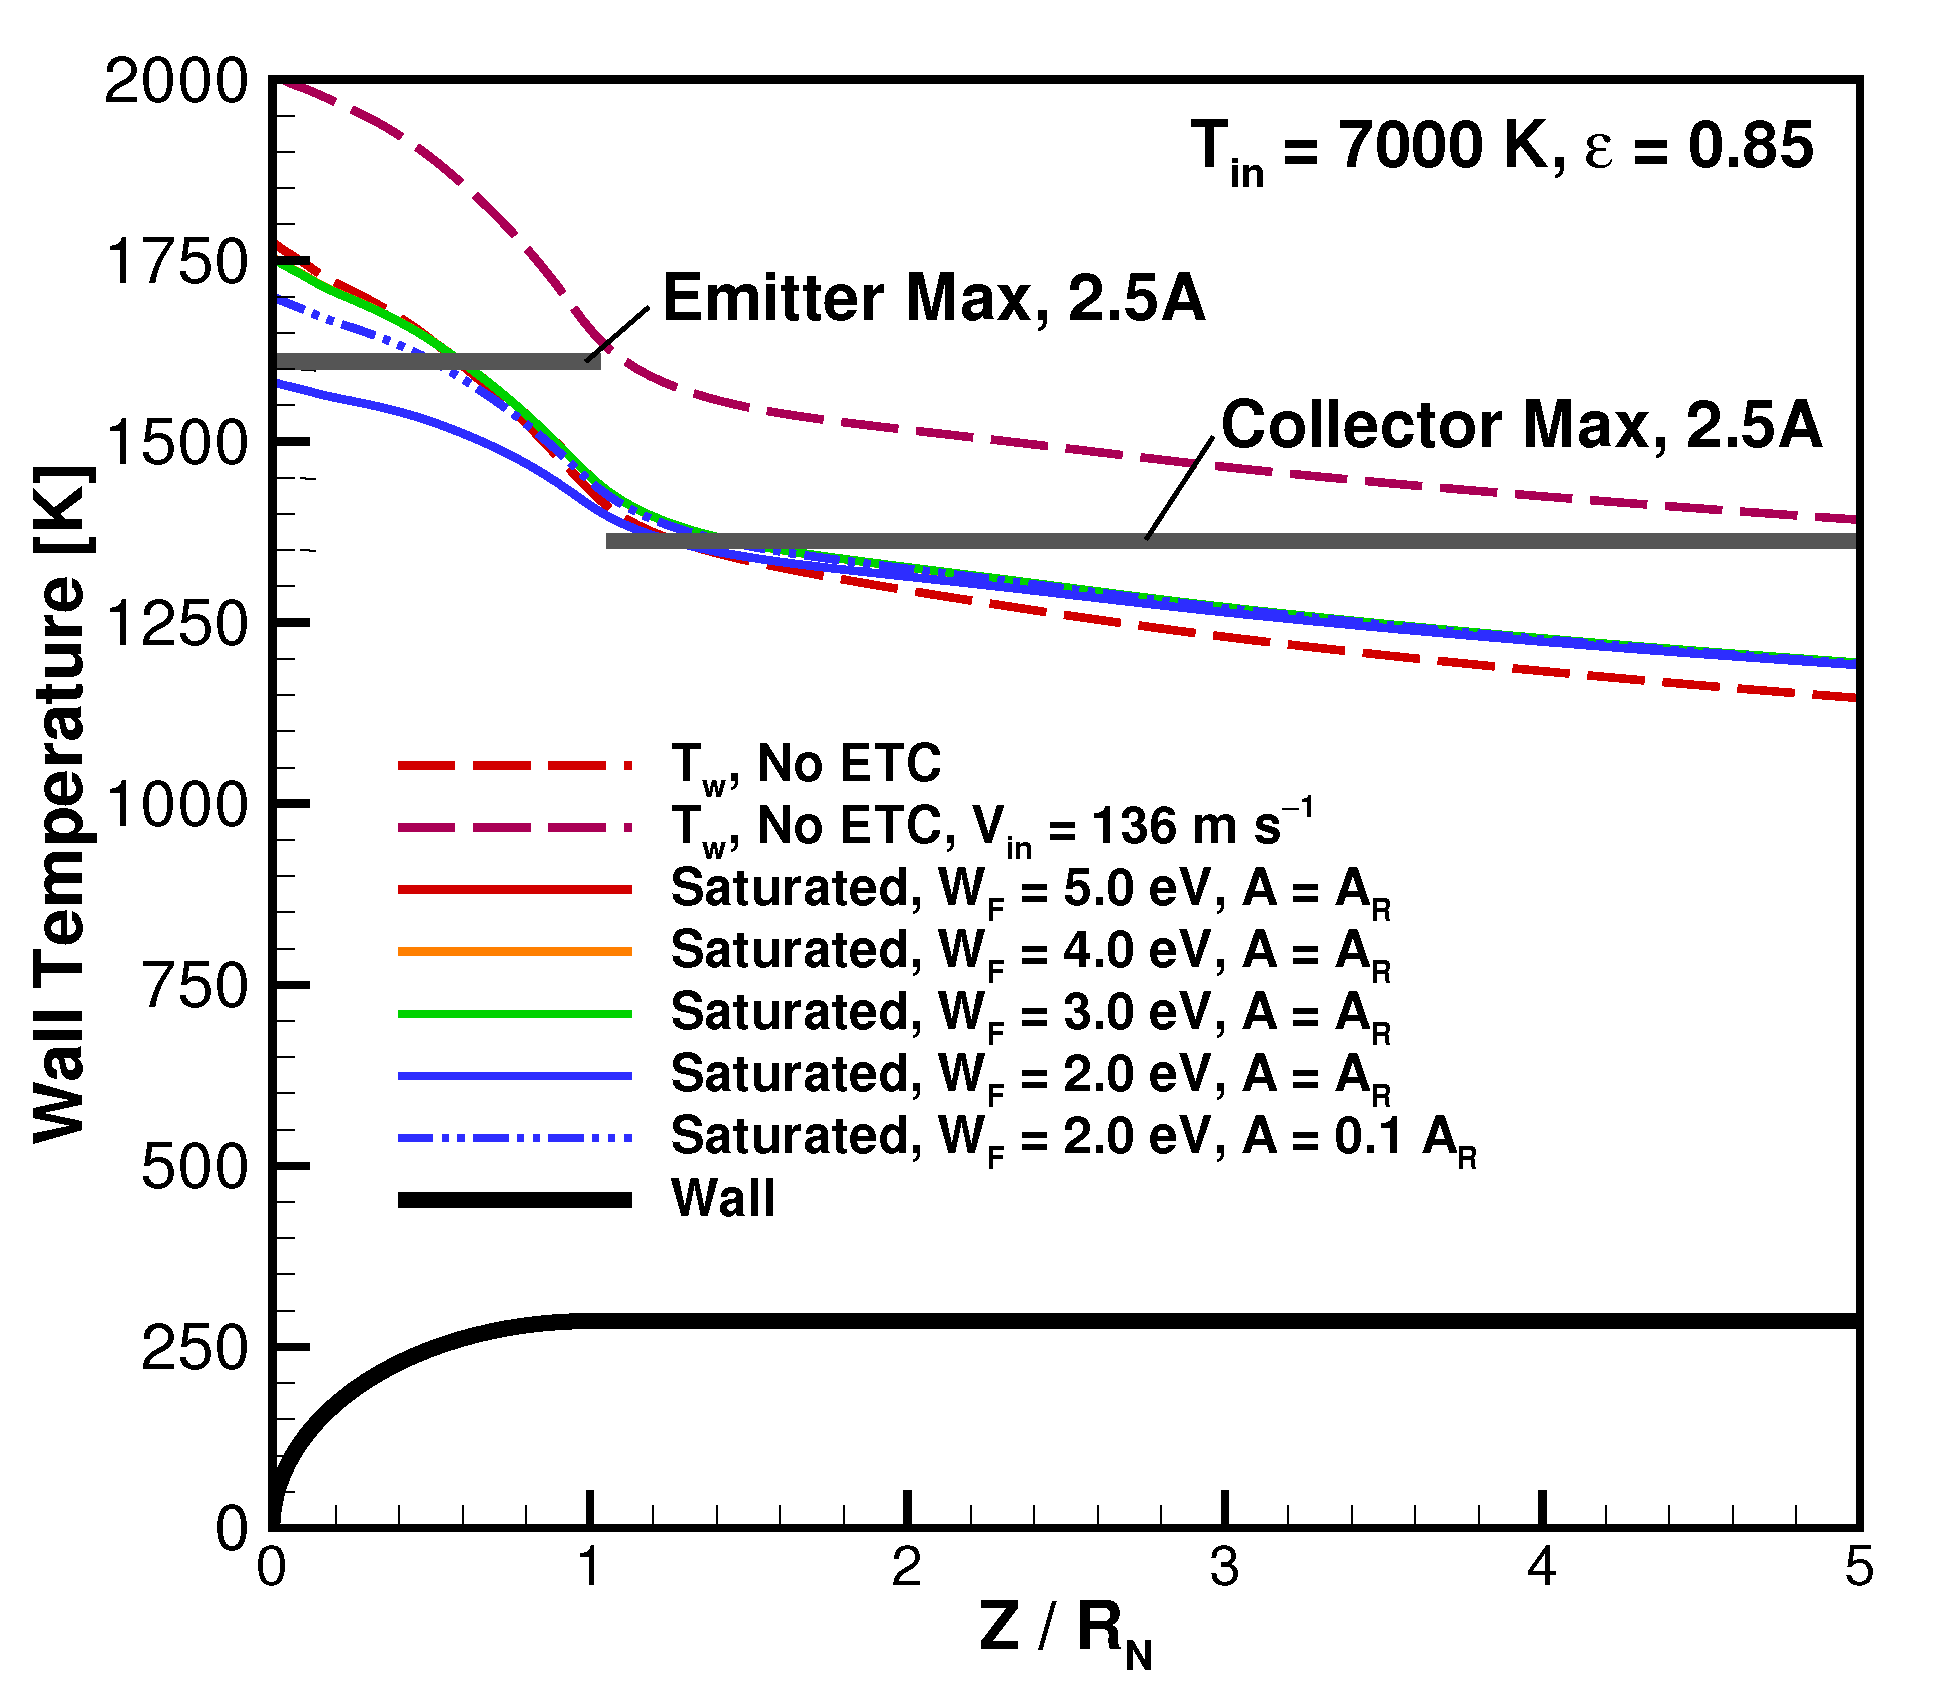
Shown in Figure 11b are the calculated values of electron current, emitted from the surface and reaching the flowfield. The large differences in this value highlight the importance of having an accurately measured value for the . Furthermore, this current can be used to understand the power generation capability of the test article as configured. A small current ranging from approximately 10–20 mA was measured during tests. Normalizing this current over the face of the emitter results in an emission current ranging from 2–4 mA/cm. With the for graphite falling between 4 eV and 5 eV, the calculated emission current suggests the higher velocity inlet may be more appropriate, as this would vertically shift the curves for 4–5 eV. This is based on the increase in wall temperature seen between cases 3 and 4. The resulting surface temperatures from these various cases are compared in Figure 12.
As the is increased, the net heating rate for the emitter, also decreases. However, downstream on the collector, surface temperatures are higher from the increased charge species recombining on the wall and adding to the local heating. Overall, the results show that little cooling effect should be expected for a material with a eV. This threshold is seen best by the level of emission current in Figure 11. For the case of a eV, cooling is only seen on the front face of the sample ( = 1) when . Then, significant cooling is only seen for .
Surface temperatures of the emitter and collector were measured as a single, maximum value for each surface using an IR camera and optical pyrometer [19]. These measurements along with corresponding values from the simulations are shown as horizontal bars over the emitter and collector sections of the wall.
Unlike the calculated emissions, these surface temperatures suggest the lower speed inlet adheres closer to experiments. However, the measured emitter temperature suggests the graphite is performing like a material with a between 2 eV and 3 eV. Taking the history of measured values of graphite to be accurate, this result must be flawed. In reality there is a portion of the heat entering the emitter which is conducted into the bulk material, lowering the surface temperatures relative to those calculated here. Future work will need to investigate the role of this internal conduction in order to address this remaining question. Otherwise, Figure 12 suggests the higher inlet velocity over-predicts the measured surface temperatures.
3.3. Considerations for Future Experiments
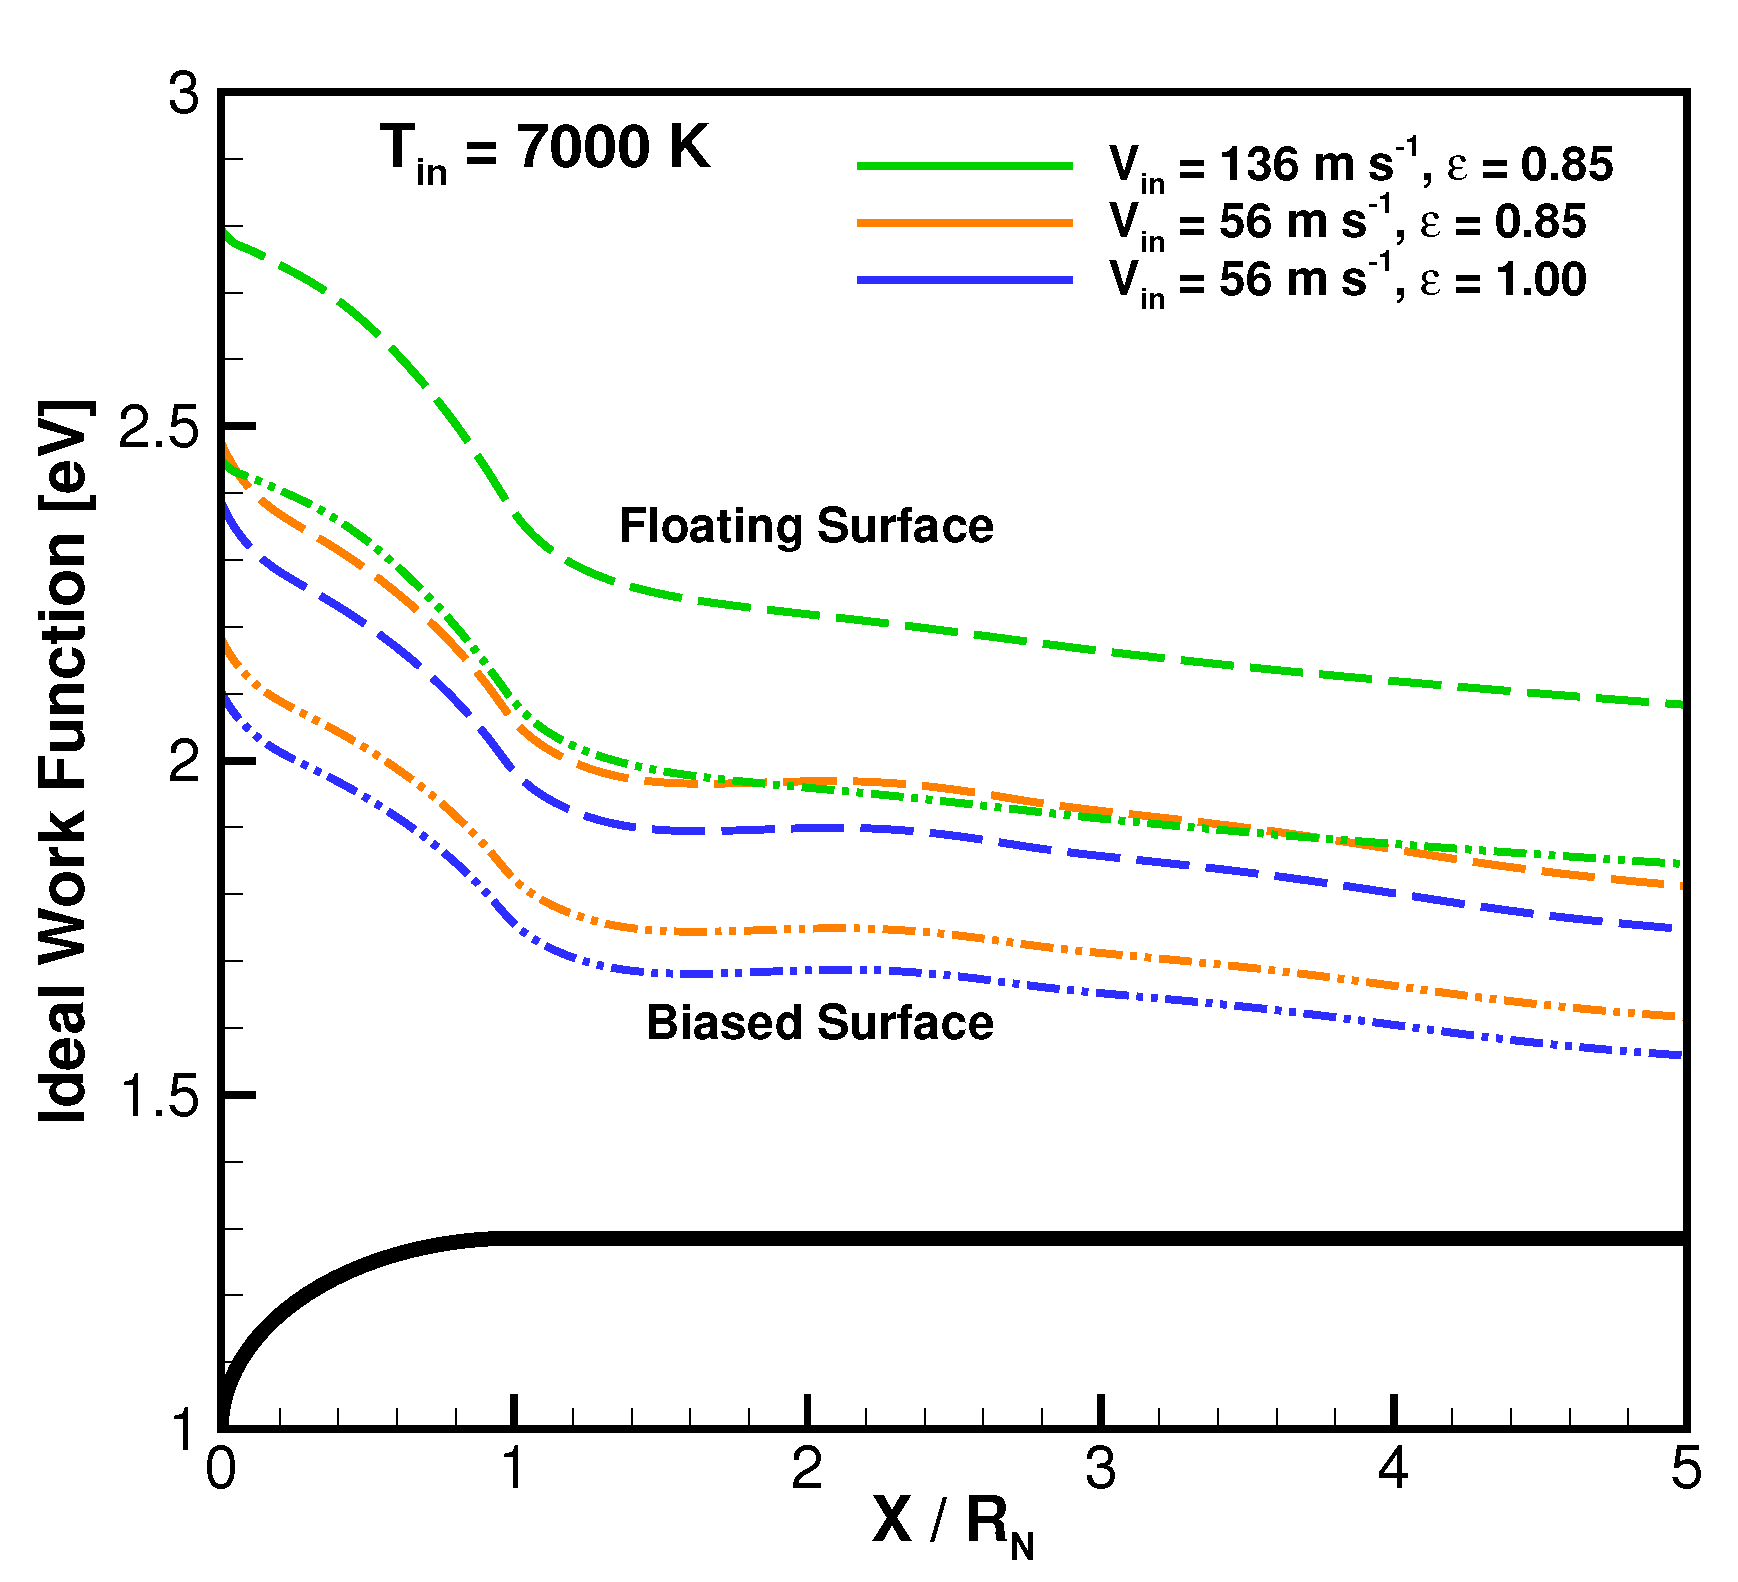
For future tests using the same torch settings as the results presented in this work, design points for ideal ETC performance can be estimated using Equations (28) and (29). Figure 13 shows the wall temperature distribution for the case 3 and 4 inlet conditions, under a range of surface emissivity values. Figure 13 also shows the distribution of plasma density along the wall (). These two parameters can be used along with the limiting cases in Section 2.4.3 to estimate the ideal under the test conditions. These estimates are shown for both the floating and biased surfaces in Figure 13b. As seen in Figure 4a, for equivalent and conditions, the biased surface requires a lower to obtain optimal emission. For the experiments considered in this study, the sample was electrically insulated and would thus be expected to operate as a surface with a floating potential. With these calculations, using materials with 2.0–2.75 should provide the highest emission currents and thus the highest levels of observable ETC.
Additionally, future tests should attempt to quantify the amount of increased performance that may be provided from a biased surface. Recalling Figure 4, tests should be designed using ideal work functions for the flow conditions and a negatively biased surface. Pushing the surface potential as far as possible before generating an arc discharge would allow experimenters to measure how close their device can get to the theoretical limit of a factor of 7.3 increase (see Section 2.4.3).
4. Summary and Conclusions
Using the results developed in the current work, experimental conditions can be correlated to specific inlet parameter values. It was shown that test conditions such as inlet velocity and chamber conditions can have a marked effect on the radial temperature gradients across the jet. Results show how these effects increase away from the stagnation streamline and thus had not been considered in past studies of the the ICP facility which focused on the centerline of the jet. Accurately representing this distribution of temperature drives the distribution of charged species which reach the material sample.
Using the concept of the ideal work function, it was shown how increases to the space-charge environment act to increase the amount of cooling possible from the thermionic release of electrons from a material surface. Thus, properly capturing the plasma density around the test article is critical to effectively modeling the ETC physics. More work is needed on understanding the role of conduction on the resulting surface energy balance. While the current surface temperature measurements suggest the lower inlet velocity model is more appropriate, important questions were raised when comparing the heat flux and emission current results which may imply a higher velocity jet.
For the test conditions considered in the current work, it was determined that a material with a work function in the range of 2.0–2.75 eV should be used to realize the maximum emission and therefore maximum observable cooling possible. Future work is needed to expand these results to additional surface bias conditions, in order to evaluate the degree to which the cooling capability may be modulated.
Author Contributions
Investigation, N.S.C.; Project administration, I.B.; Resources, A.M. and J.M.; Supervision, K.H. and I.B.; Writing—original draft, N.S.C.; Writing—review and editing, K.H., J.M. and I.B. All authors have read and agreed to the published version of the manuscript.
Funding
This work was funded by Lockheed Martin Corporation.
Institutional Review Board Statement
Not applicable.
Informed Consent Statement
Not applicable.
Data Availability Statement
Not applicable.
Acknowledgments
We gratefully acknowledge support from the Lockheed Martin Corporation for this work.
Conflicts of Interest
The authors declare no conflict of interest.
References
- Anna, A. Numerical Modeling of Surface Chemistry Processes for Hypersonic Entry Environments. Ph.D. Thesis, University of Michigan, Ann Arbor, MI, USA, 2013. [Google Scholar]
- Martin, A.; Boyd, I.D. Strongly Coupled Computation of Material Response and Nonequilibrium Flow for Hypersonic Ablation. J. Spacecr. Rocket. 2015, 52, 89–104. [Google Scholar] [CrossRef]
- Wiebenga, J.E. High-Fidelity Material Response Modeling as Part of an Aerothermoelastic Framework for Hypersonic Flows. Ph.D. Thesis, University of Michigan, Ann Arbor, MI, USA, 2014. [Google Scholar]
- Jin, X.; He, R.; Zhang, X.; Hu, P. Ablation behavior of ZrB2-SiC sharp leading edges. J. Alloys Compd. 2013, 566, 125–130. [Google Scholar] [CrossRef]
- Uyanna, O.; Najafi, H. Thermal Protection Systems for Space Vehicles: A Review on Technology Development, Current Challenges and Future Prospects. Acta Astonautica 2020, 176, 341–356. [Google Scholar] [CrossRef]
- Glass, D.E. Ceramix Matrix Composite (CC) Thermal Protection Systems (TPS) and Hot Structures for Hypersonic Vehicles; AIAA Paper 2008-2682; American Institute of Aeronautics and Astronautic: Reston, VA, USA, 2008. [Google Scholar] [CrossRef] [Green Version]
- Anderson, J.D., Jr. Hypersonic and High-Temperature Gas Dynamics; American Institute of Aeronautics and Astronautics: Reston, VA, USA, 2006. [Google Scholar]
- Hanquist, K.M. Modeling of Electron Transpiration Cooling for Leading Edges of Hypersonic Vehicles. Ph.D. Thesis, University of Michigan, Ann Arbor, MI, USA, 2017. [Google Scholar]
- Uribarri, L.A.; Allen, E.H. Electron Transpiration Cooling for Hot Aerospace Surfaces; AIAA Paper 2015-3674; American Institute of Aeronautics and Astronautics: Reston, VA, USA, 2015. [Google Scholar] [CrossRef]
- Richardson, O.W. The Emission of Electricity from Hot Bodies; Longmans, Green and Co.: New York, NY, USA, 1921. [Google Scholar]
- Herring, C.; Nichols, M.H. Thermionic Emission. Rev. Mod. Phys. 1949, 21, 185. [Google Scholar] [CrossRef]
- Richardson, O.W. The Electrical Conductivity Imparted to a Vacuum by Hot Conductors. Philos. Trans. R. Soc. Lond. 1903, 201, 497–549. [Google Scholar]
- Smithells, C.J. 18—Electron Emission. In Smithells Metals Reference Book; Gale, W.F., Totemeier, T.C., Eds.; Elsevier Ltd.: Amsterdam, The Netherlands, 2004. [Google Scholar]
- Touryan, K.J. The Hypersonic Plasma Converter: II; Technical Report SC RR 4960; Sandia Laboratories: Albuquerque, NM, USA, 1964. [Google Scholar]
- LeBlanc, A.R.; Grannemann, W.W. Thermionic Generator for Re-Entry Vehicles. Proc. IEEE 1964, 52, 1302–1310. [Google Scholar] [CrossRef] [Green Version]
- Touryan, K.J. A Hypersonic Plasma Power Generator. AIAA J. 1965, 3, 652. [Google Scholar] [CrossRef]
- Hanquist, K.M.; Boyd, I.D. Effectiveness of Thermionic Emission for Cooling Hypersonic Vehicle Surfaces; AIAA Paper 2018-1714; American Institute of Aeronautics and Astronautic: Reston, VA, USA, 2018. [Google Scholar] [CrossRef]
- Hanquist, K.M.; Boyd, I.D. Plasma Assisted Cooling of Hot Surfaces on Hypersonic Vehicles. Front. Phys. Plasma Aerosp. 2019, 7, 1–13. [Google Scholar] [CrossRef]
- Morin, A.; Osborn, R.; Schindler, J.; Voll, B.; Fletcher, D.; Meyers, J. Inductively Coupled Facility Qualification for Electron Transpiration Cooling Investigations. In Proceedings of the AIAA SciTech 2020 Forum, Orlando, FL, USA, 6–10 January 2020. [Google Scholar]
- Owens, W.; Uhl, J.; Dougherty, M.; Lutz, A.; Fletcher, D. Development of a 30 kW Inductively Coupled Plasma Torch for Aerospace Material Testing; AIAA Paper 2010-4322; American Institute of Aeronautics and Astronautic: Reston, VA, USA, 2010. [Google Scholar]
- Kolesnikov, A.F. Extrapolation from High Enthalpy Tests to Flight Based on the Concept of Local Heat Transfer Simulation; Defense Technical Information Center: Fort Belvoir, VA, USA, 1999. [Google Scholar]
- Chazot, O.; Panerai, F.; Muylaert, J.; Thoemel, J. Catalysis Phenomena Determination in Plasmatron Facility for Flight Experiment Design; AIAA Paper 2010-1248; American Institute of Aeronautics and Astronautic: Reston, VA, USA, 2010. [Google Scholar]
- Barbante, P.; Chazot, O. Flight Extrapolation of Plasma Wind Tunnel Stagnation Region Flowfield. J. Thermophys. Heat Transf. 2006, 20, 493–499. [Google Scholar] [CrossRef]
- Barbante, P. Heat Flux Duplication Between Ground Facility and Hypersonic Flight. J. Thermophys. Heat Transf. 2009, 23, 684–692. [Google Scholar] [CrossRef]
- Anna, A.; Boyd, I.D. Numerical Analysis of Surface Chemistry in High-Enthalpy Flows. J. Thermophys. Heat Transf. 2015, 29, 653–670. [Google Scholar] [CrossRef] [Green Version]
- Chen, Y.S.; Boyd, I.D.; Martin, N.C.; Fletcher, D.G. Modeling of Gas-Phase Chemical Kinetics for Pyrolyzing Ablators. In Proceedings of the 2018 Joint Thermophysics and Heat Transfer Conference, Atlanta, GA, USA, 25–29 June 2018; pp. 1–15. [Google Scholar] [CrossRef]
- Fletcher, D.G.; Meyers, J.M. Surface Catalyzed Reaction Efficiencies in Oxygen Plasmas from LIF Measurements. J. Thermophys. Heat Transf. 2016, 31, 410–420. [Google Scholar] [CrossRef]
- Meyers, J.M.; Fletcher, D.G. Nitrogen Surface Catalyzed Recombination Efficiency from Two-Photon Laser Induced Fluorescence Measurements. J. Thermophys. Heat Transf. 2019, 33, 1–11. [Google Scholar] [CrossRef]
- Tillson, C.C.; Uhl, J.; Meyers, J.M.; Fletcher, D.G. Investigation of Pyrolysis Gas Chemistry in an Inductively Coupled Plasma Facility; AIAA Paper 2016-3235; American Institute of Aeronautics and Astronautic: Reston, VA, USA, 2016. [Google Scholar] [CrossRef] [Green Version]
- Scalabrin, L.C. Numerical Simulation of Weakly Ionized Hypersonic Flow Over Reentry Capsules. Ph.D. Thesis, University of Michigan, Ann Arbor, MI, USA, 2007. [Google Scholar]
- Holman, T.D.; Boyd, I.D. Numerical Investigation of the Effects of Continuum Breakdown on Hypersonic Vehicle Surface Properties; AIAA Paper 2008-3928; American Institute of Aeronautics and Astronautic: Reston, VA, USA, 2008. [Google Scholar]
- Deschenes, T.R. Extension of a Modular Particle-Continuum Method for Nonequilibrium, Hypersonic Flows. Ph.D. Thesis, University of Michigan, Ann Arbor, MI, USA, 2011. [Google Scholar]
- Alkandry, H. Aerodynamic Interactions of Propulsive Deceleration and Reaction Control System Jets on Mars-Entry Aeroshells. Ph.D. Thesis, University of Michigan, Ann Arbor, MI, USA, 2012. [Google Scholar]
- Martin, A.; Scalabrin, L.C.; Boyd, I.D. High Performance Modeling of Atmospheric Re-entry Vehicles. J. Phys. Conf. Ser. 2012, 341, 1–12. [Google Scholar] [CrossRef]
- Goodwin, D.G.; Speth, R.L.; Moffat, H.K.; Weber, B.W. Cantera: An Object-Oriented Software Toolkit for Chemical Kinetics, Thermodynamics, and Transport Processes. Version 2.4.0. 2018. Available online: https://www.cantera.org (accessed on 15 July 2021).
- Hanquist, K.M.; Hara, K.; Boyd, I.D. Detailed modeling of electron emission for transpiration cooling of hypersonic vehicles. J. Appl. Phys. 2017, 121, 1–13. [Google Scholar] [CrossRef]
- Sheehan, J.P.; Hershkowitz, N. Emissive Probes. Plasma Sources Sci. Technol. 2011, 20, 063001. [Google Scholar] [CrossRef]
- Hobbs, G.D.; Wesson, J.A. Heat Flow Through a Langmuir Sheath in the Presence of Electron Emission. Plasma Phys. 1967, 9, 85–87. [Google Scholar] [CrossRef]
- Hara, K.; Hanquist, K. Test cases for grid-based direct kinetic modeling of plasma flows. Plasma Sources Sci. Technol. 2018, 27, 1–14. [Google Scholar] [CrossRef]
- Takamura, S.; Ohno, N.; Ye, M.; Kuwabara, T. Space-charge limited current from plasma-facing material surface. Contrib. Plasma Phys. 2004, 44, 126–137. [Google Scholar] [CrossRef]
- Hanquist, K.M.; Alkandry, H.; Boyd, I.D. Evaluation of Computational Modeling of Electron Transpiration Cooling at High Enthalpies. J. Thermophys. Heat Transf. 2017, 31, 283–293. [Google Scholar] [CrossRef] [Green Version]
- Bohm, D. Minimum ionic kinetic energy for a stable sheath. In The Characteristics of Electrical Discharges in Magnetic Fields; Guthrie, A., Wakerling, R.K., Eds.; McGraw-Hill: New York, NY, USA, 1949; pp. 77–86. [Google Scholar]
- Chen, S.Y.; Boyd, I.D.; Martin, N.C.; Fletcher, D.G. Modeling of Emission Spectra in Nonequilibrium Plasmas for Testing Pyrolyzing Ablators. J. Thermophys. Heat Transf. 2019, 33, 907–916. [Google Scholar] [CrossRef]
- Reiman, A.L. Thermionic Emission from Carbon. Proc. Phys. Soc. 1938, 50, 496. [Google Scholar] [CrossRef]
- Krishnan, K.S.; Jain, S.C. Thermionic Constants of Graphite. Nature 1952, 169, 702–703. [Google Scholar] [CrossRef]
- Haynes, W.M. CRC Handbook of Chemistry and Physics; CRC Press: Boca Raton, FL, USA, 2013. [Google Scholar]
Figure 1.
Maximum cooling rates from evaporative and thermionic materials relative to the equivalent level of radiative cooling.
Figure 1.
Maximum cooling rates from evaporative and thermionic materials relative to the equivalent level of radiative cooling.

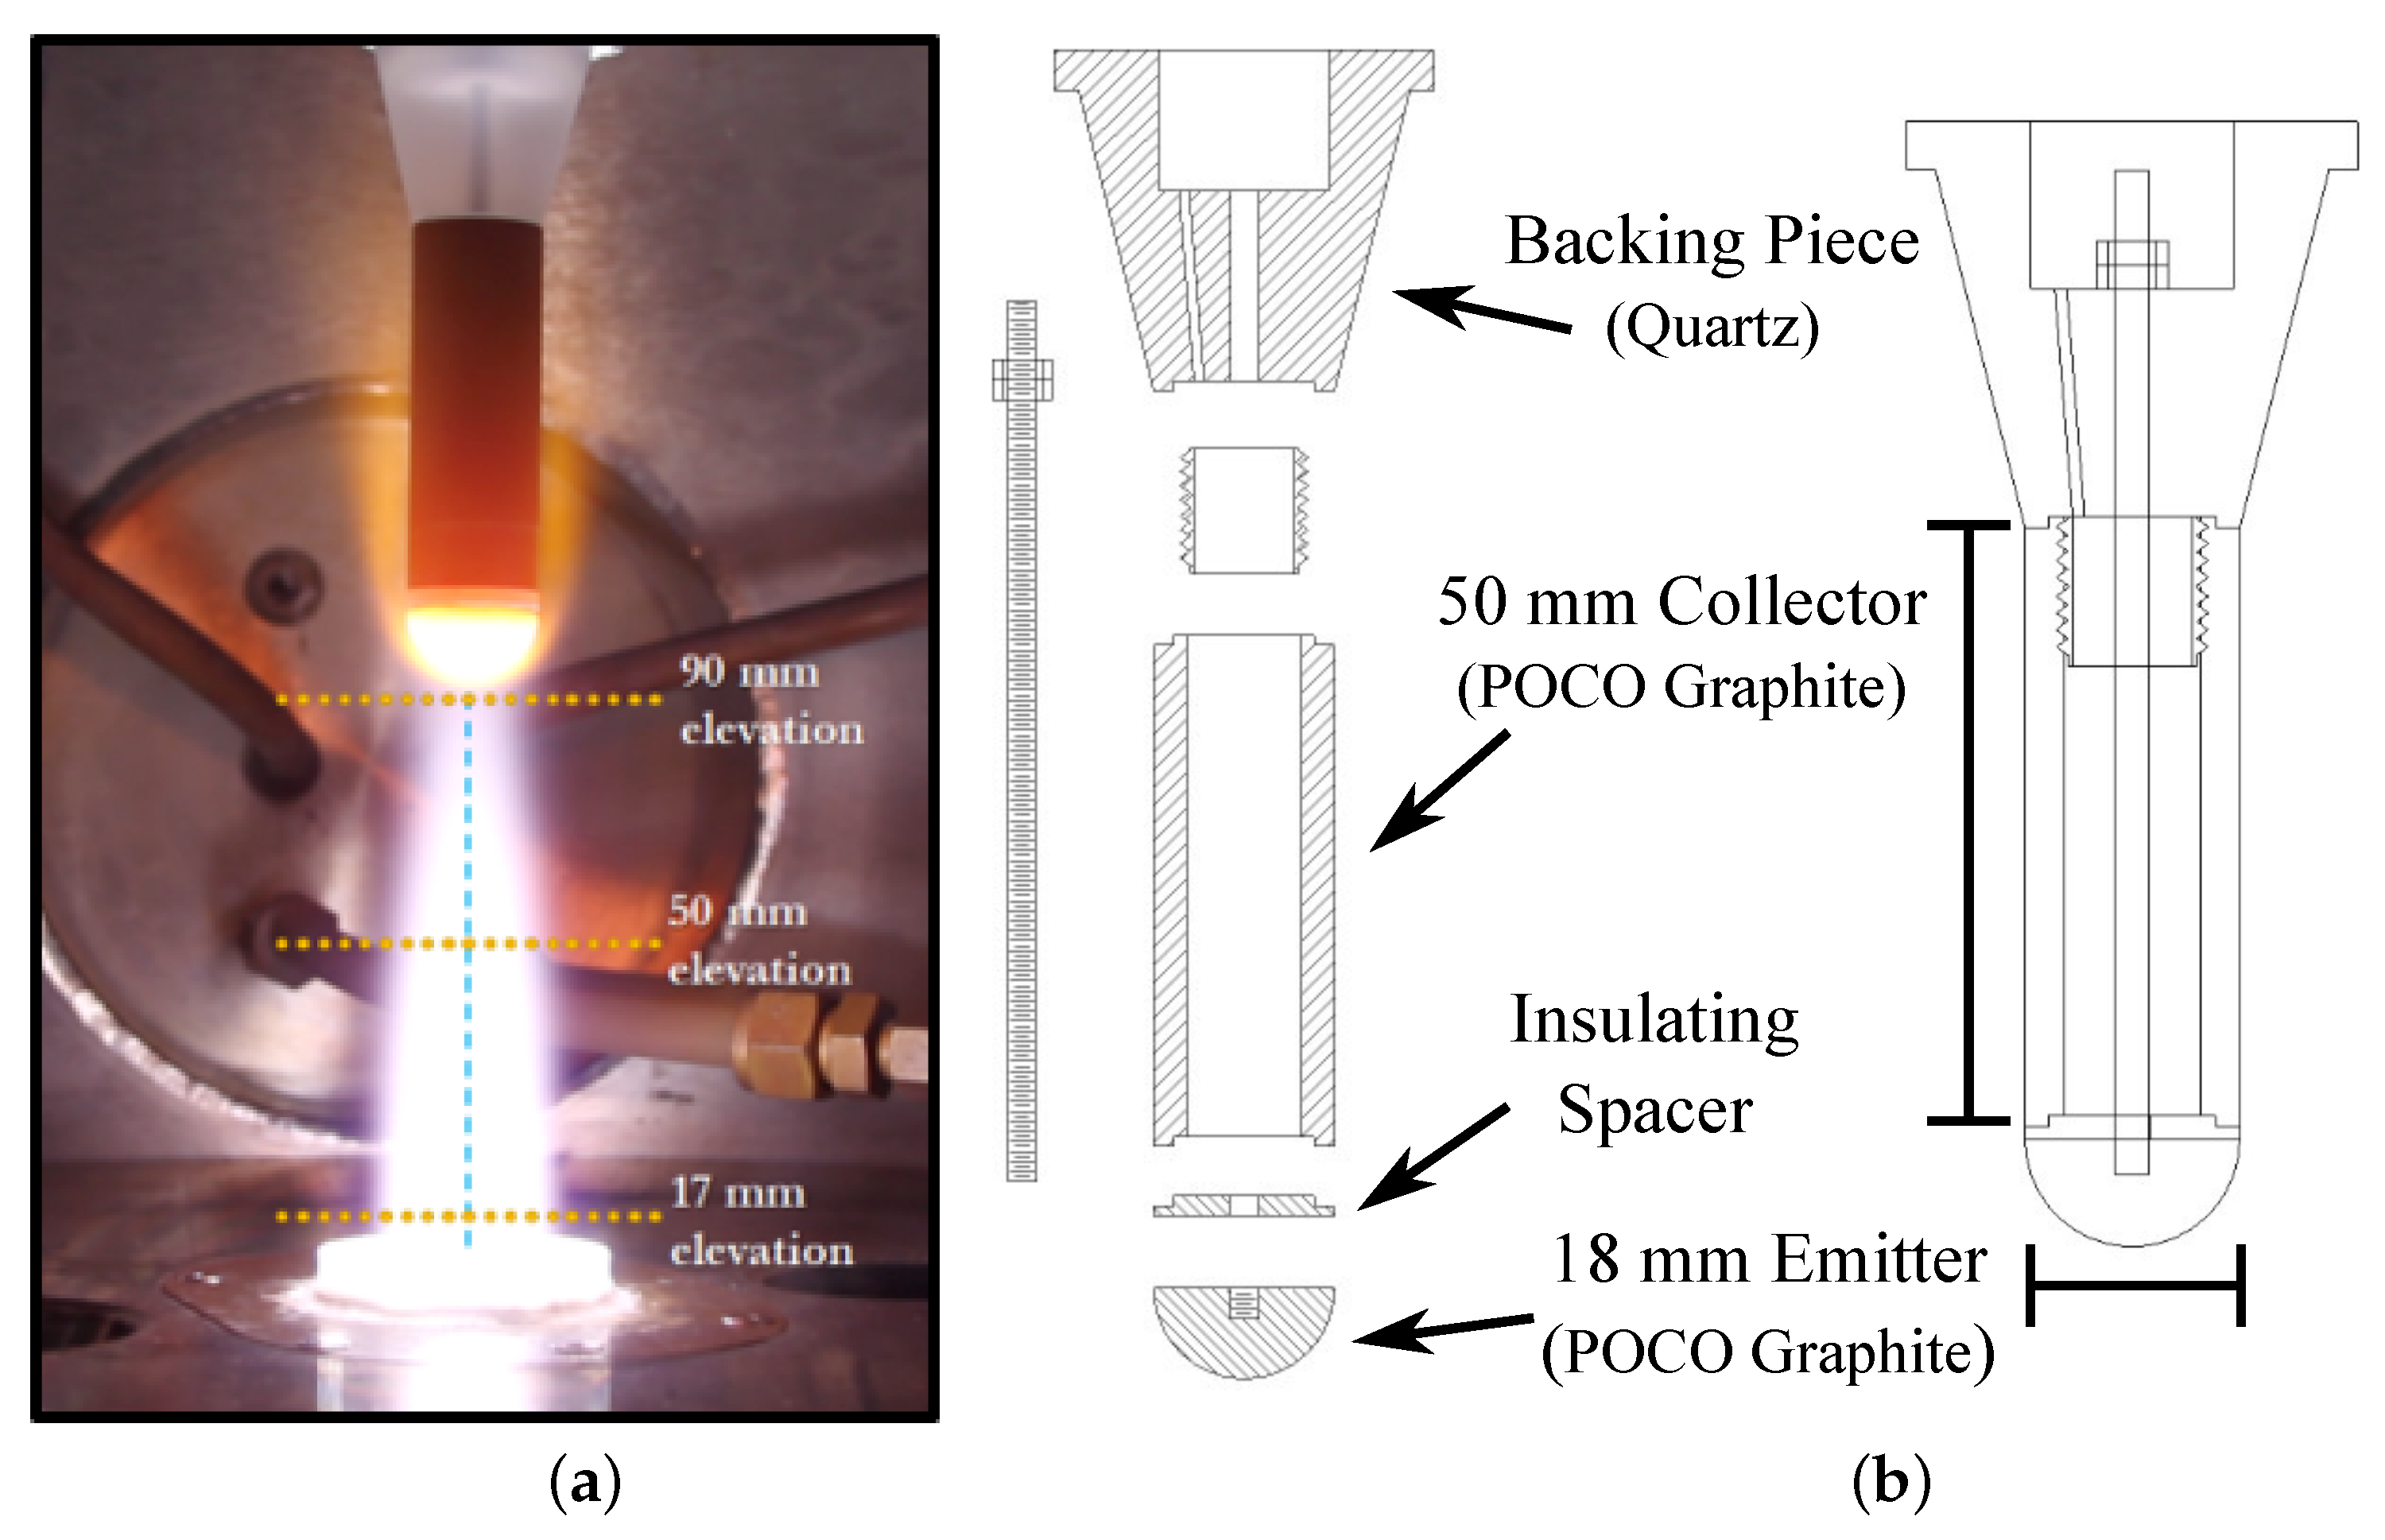
Figure 2.
(a) Experimental setup showing axial locations relevant to the CFD simulations performed in the current work. Figure from [19]. (b) Schematic of the test article design. Not shown is a water-cooled fixture to which the backing piece is attached.
Figure 2.
(a) Experimental setup showing axial locations relevant to the CFD simulations performed in the current work. Figure from [19]. (b) Schematic of the test article design. Not shown is a water-cooled fixture to which the backing piece is attached.

Figure 3.
Computational domain and boundary conditions.

Figure 4.
Ideal work functions based on Equations (28) and (29). All curves shown are plotted relative to a wall with and over the range of plasma densities, = 10 m− 10 m. (a) Compares floating and biased solutions for a range of wall temperatures with . (b) Shows the effect of A for a biased surface, at a constant wall temperature.

Figure 5.
Temperature fields for the minimum and maximum inlet temperature cases (1 and 6) simulated.
Figure 5.
Temperature fields for the minimum and maximum inlet temperature cases (1 and 6) simulated.

Figure 6.
Percent ionization, , for the minimum and maximum inlet temperature cases (1 and 6) simulated.
Figure 6.
Percent ionization, , for the minimum and maximum inlet temperature cases (1 and 6) simulated.

Figure 7.
Temperature fields for cases with = 7000 K, (top) case 3 and (bottom) case 4.

Figure 8.
Plasma temperature measurements and simulated values at Z = 17 mm downstream of the torch outlet.
Figure 8.
Plasma temperature measurements and simulated values at Z = 17 mm downstream of the torch outlet.

Figure 9.
Plasma temperature measurements and simulated values at Z = 50 mm downstream of the torch outlet.
Figure 9.
Plasma temperature measurements and simulated values at Z = 50 mm downstream of the torch outlet.

Figure 10.
Convective heat flux at various torch conditions. All for a wall with an emissivity of 0.85.
Figure 10.
Convective heat flux at various torch conditions. All for a wall with an emissivity of 0.85.

Figure 11.
(a) Net heating rates to surface in radiative equilibrium. (b) Emission current, , line style and color correlate to the ETC modeling options specified in (a).
Figure 11.
(a) Net heating rates to surface in radiative equilibrium. (b) Emission current, , line style and color correlate to the ETC modeling options specified in (a).

Figure 12.
ETC effect on surface temperatures.

Figure 13.
Wall temperature and plasma density along the wall for two levels of surface emissivity, , and inlet velocity model.
Figure 13.
Wall temperature and plasma density along the wall for two levels of surface emissivity, , and inlet velocity model.


Table 1.
Experimental conditions in ICP Torch Facility [19].
Table 1.
Experimental conditions in ICP Torch Facility [19].
| Torch Current, I | 2.0, 2.2, 2.5 | [A] |
| Gas Flow Rate, | 0.838 | [g/s] |
| Chamber Pressure, | 21.3 | [kPa] |
Table 2.
Test parameters considered in this study. Densities and flow rates determined from the test conditions provided in Table 1.
Table 2.
Test parameters considered in this study. Densities and flow rates determined from the test conditions provided in Table 1.
| Case No. | [K] | [m/s] | [MJ/kg] | [m] | [m] |
|---|---|---|---|---|---|
| 1 | 6500 | 52 | 3.24 | 6.02 × 10 | 1.13 × 10 |
| 2 | 6500 | 136 | 3.24 | 6.02 × 10 | 1.13 × 10 |
| 3 | 7000 | 56 | 3.51 | 6.02 × 10 | 3.41 × 10 |
| 4 | 7000 | 136 | 3.52 | 6.02 × 10 | 3.40 × 10 |
| 5 | 7500 | 60 | 3.81 | 6.00 × 10 | 8.89 × 10 |
| 6 | 7750 | 62 | 3.98 | 5.99 × 10 | 1.37 × 10 |
Publisher’s Note: MDPI stays neutral with regard to jurisdictional claims in published maps and institutional affiliations. |
© 2021 by the authors. Licensee MDPI, Basel, Switzerland. This article is an open access article distributed under the terms and conditions of the Creative Commons Attribution (CC BY) license (https://creativecommons.org/licenses/by/4.0/).
Share and Cite
MDPI and ACS Style
Campbell, N.S.; Hanquist, K.; Morin, A.; Meyers, J.; Boyd, I. Evaluation of Computational Models for Electron Transpiration Cooling. Aerospace 2021, 8, 243. https://0-doi-org.brum.beds.ac.uk/10.3390/aerospace8090243
AMA Style
Campbell NS, Hanquist K, Morin A, Meyers J, Boyd I. Evaluation of Computational Models for Electron Transpiration Cooling. Aerospace. 2021; 8(9):243. https://0-doi-org.brum.beds.ac.uk/10.3390/aerospace8090243
Chicago/Turabian StyleCampbell, Nicholas S., Kyle Hanquist, Andrew Morin, Jason Meyers, and Iain Boyd. 2021. "Evaluation of Computational Models for Electron Transpiration Cooling" Aerospace 8, no. 9: 243. https://0-doi-org.brum.beds.ac.uk/10.3390/aerospace8090243
Note that from the first issue of 2016, this journal uses article numbers instead of page numbers. See further details here.