Data Envelopment Analysis Approach to Energy-Saving Projects Selection in an Energy Service Company


School of Engineering, Universidad de Sevilla, E41092 Seville, Spain
*
Author to whom correspondence should be addressed.
Mathematics 2021, 9(2), 200; https://0-doi-org.brum.beds.ac.uk/10.3390/math9020200
Submission received: 3 December 2020
/
Revised: 7 January 2021
/
Accepted: 16 January 2021
/
Published: 19 January 2021
(This article belongs to the Special Issue Application of Mathematical Methods in Industrial Engineering and Management)
Abstract
:Project selection is a common problem for many companies. Specifically, it consists in identifying which projects should be selected with regard to their economic efficiency, i.e., the projects that maximise the profit they bring in while minimising the cost of the resources consumed. In this paper, we have focused our interest on energy service companies because of the importance of a convenient selection of their projects. In these types of companies, the attractiveness of a project depends on both the profit estimations obtained in simulations of the energy systems to be improved, as well as the probability that the project will be awarded (e.g., in local government bids, where typically several energy service companies compete to win the bid). We propose a new project selection method, especially tailored to energy service companies and based on centralised data envelopment analysis models with limited availability of the resources. This contrasts with all existing project selection methods and allows the proposed approach to make more efficient use of the limited resources. We have applied the model to a real-world case by selecting projects in a Spanish energy service company, showing the benefits of applying this approach, and comparing the results obtained with other data envelopment analysis project selection approaches.
1. Introduction
Energy service companies (ESCO) are companies that engage in developing, installing and financing comprehensive performance-based projects focused on improving energy efficiency and reducing the electricity bill of facilities owned or operated by customers [1]. This mechanism is named energy performance contracting (EPC) and the projects derived from it are performance-based as the compensation of the ESCO is linked to the amount of energy actually saved. The ESCO assumes the risk of coordinating its compensation directly with the results obtained. This risk creates as much motivation as possible in order to identify and design the savings correctly during the contract [1,2]. The number of ESCOs is increasing all over the world [3,4] and the energy-saving projects carried out can be grouped into five categories: residential, commercial, industrial, municipal and agricultural [5].
One of the main problems faced by an ESCO is to select an optimal portfolio of projects owing to their peculiarity. Thus, many come from local government bids and therefore there is no certainty that they will be assigned. In addition, the benefits of executing them depends not only on the probability of winning the bids, but also on the estimation of their economic performance, computed through a simulation of the energy savings that could be achieved if the planned changes to the existing facilities are carried out.
Many project selection approaches are based on selecting those that present the highest level of economic efficiency (generating maximum revenue using the minimum resources cost). Data envelopment analysis (DEA) is a mathematical tool based on linear programming models that can be used to provide a measure of the efficiency of portfolio projects.
In this paper, we propose a new approach for ESCO portfolio projects selection using DEA. On the one hand, it is assumed that the ESCO has a database of past projects and therefore it has information about the number of resources consumed and the outputs generated by previous projects. On the other hand, the ESCO has a portfolio of potential projects that can be carried out and has to select, taking into account certain resource availability constraints, those that are more profitable.
The structure of the paper is the following. In Section 2, we present a review of the literature on the project selection problem. In Section 3, the proposed approach is formulated and explained. Section 4 applies the proposed approach to a real case study extracted from a Spanish ESCO. Finally, Section 5 summarises and concludes.
2. Literature Review
Project selection is a common decision-making problem and has been extensively studied in the literature using many different techniques (see, e.g., [6,7]). One technique that has been used for project selection is data envelopment analysis (DEA). DEA is a non-parametric methodology commonly used for benchmarking facilities, companies or any entities that consume inputs to produce outputs [8]. The benchmarking is based on the concept of efficiency that is related to minimising the resources required to achieve given levels of output as well as maximising the amount of output generated by a given number of inputs. By comparing the performance of one entity with that of their peers DEA can determine whether it is efficient or, on the contrary, the number of inputs it has consumed could be reduced or the number of outputs it has produced could be increased. The quantification of those input and output improvements allows computing an efficiency score as well as target input and output levels. Achieving those targets would correspond to an efficient operation.
There are many DEA models that can be used in different situations [9,10,11,12,13]. In particular, several specific DEA approaches have been proposed for project selection. Sowlati et al. [14] presents a new DEA model to prioritise information system (IS) projects using as inputs and outputs the criteria used to judge the importance of the projects. Each real project is compared to the set of artificial projects provided by the decision-makers. Ghapanchi et al. [15] uses DEA to select the best portfolio of projects, considering the projects’ uncertainties and their interactions. They follow a four-step method: (1) modelling the problem to determine the inputs and outputs and their interactions as well as fuzzy estimates of them and of the associated risk; (2) selecting candidates’ projects using fuzzy data envelopment analysis (FDEA); (3) portfolio generation and establishing maximal portfolios; and (4) evaluation of maximal portfolios using FDEA once more.
Tavana et al. [16] proposes a project selection technique based on a new DEA model considering both ambiguity of inputs and outputs (modeled with fuzzy sets and a new α-cut based method), and vagueness of the objective function (modeled with multiobjective fuzzy linear programming). Yousef and Hadi-Vencheh [17] consider AHP, TOPSIS and DEA techniques to rank 19 six-sigma projects using the relevant criteria. Similarly, Ref. [18] selects the most efficient six-sigma project when interval or imprecise data are considered using a common weight IDEA approach.
Toloo et al. [19] proposes a DEA approach to find the most efficient IS project in the presence of subjective opinions and intuitive sense of decision-makers such as artificial DMUs with assigned priority scores on an equal footing. Fiala [20] proposes a new project portfolio selection method based on a combination of the DEA model and the de novo optimisation approach, assuming a total available budget.
Special attention deserves to be given to those DEA approaches that consider limited resources. Thus, Cook and Green [21] proposes a project selection approach based on the selection of the best subset of proposals with the aim to use the available resource as much as possible. The method considers the composite project as a virtual DMU evaluating its aggregate efficiency by maximising the weighted sum of outputs, using a common weight approach. More recently, Toloo and Mirbolouki [22] revise the above approach, using a single linear DEA problem that assigns an individual weight for each input and output of each selected proposal.
Although many studies have dealt with optimising the energy consumption in various environments [23,24,25], and many others treat some features of the ESCOs such as investment decisions, main barriers and market size [26,27,28]; as far as we know, only [29] deals with the selection of ESCO portfolio projects problem using multicriteria approaches.
In summary, although the ESCO project selection problem could in principle be solved by using some of the general methodologies present in the literature, we believe a new approach that considers all the peculiarities of ESCO projects is more appropriate and can lead to more reliable results.
3. Proposed Approach
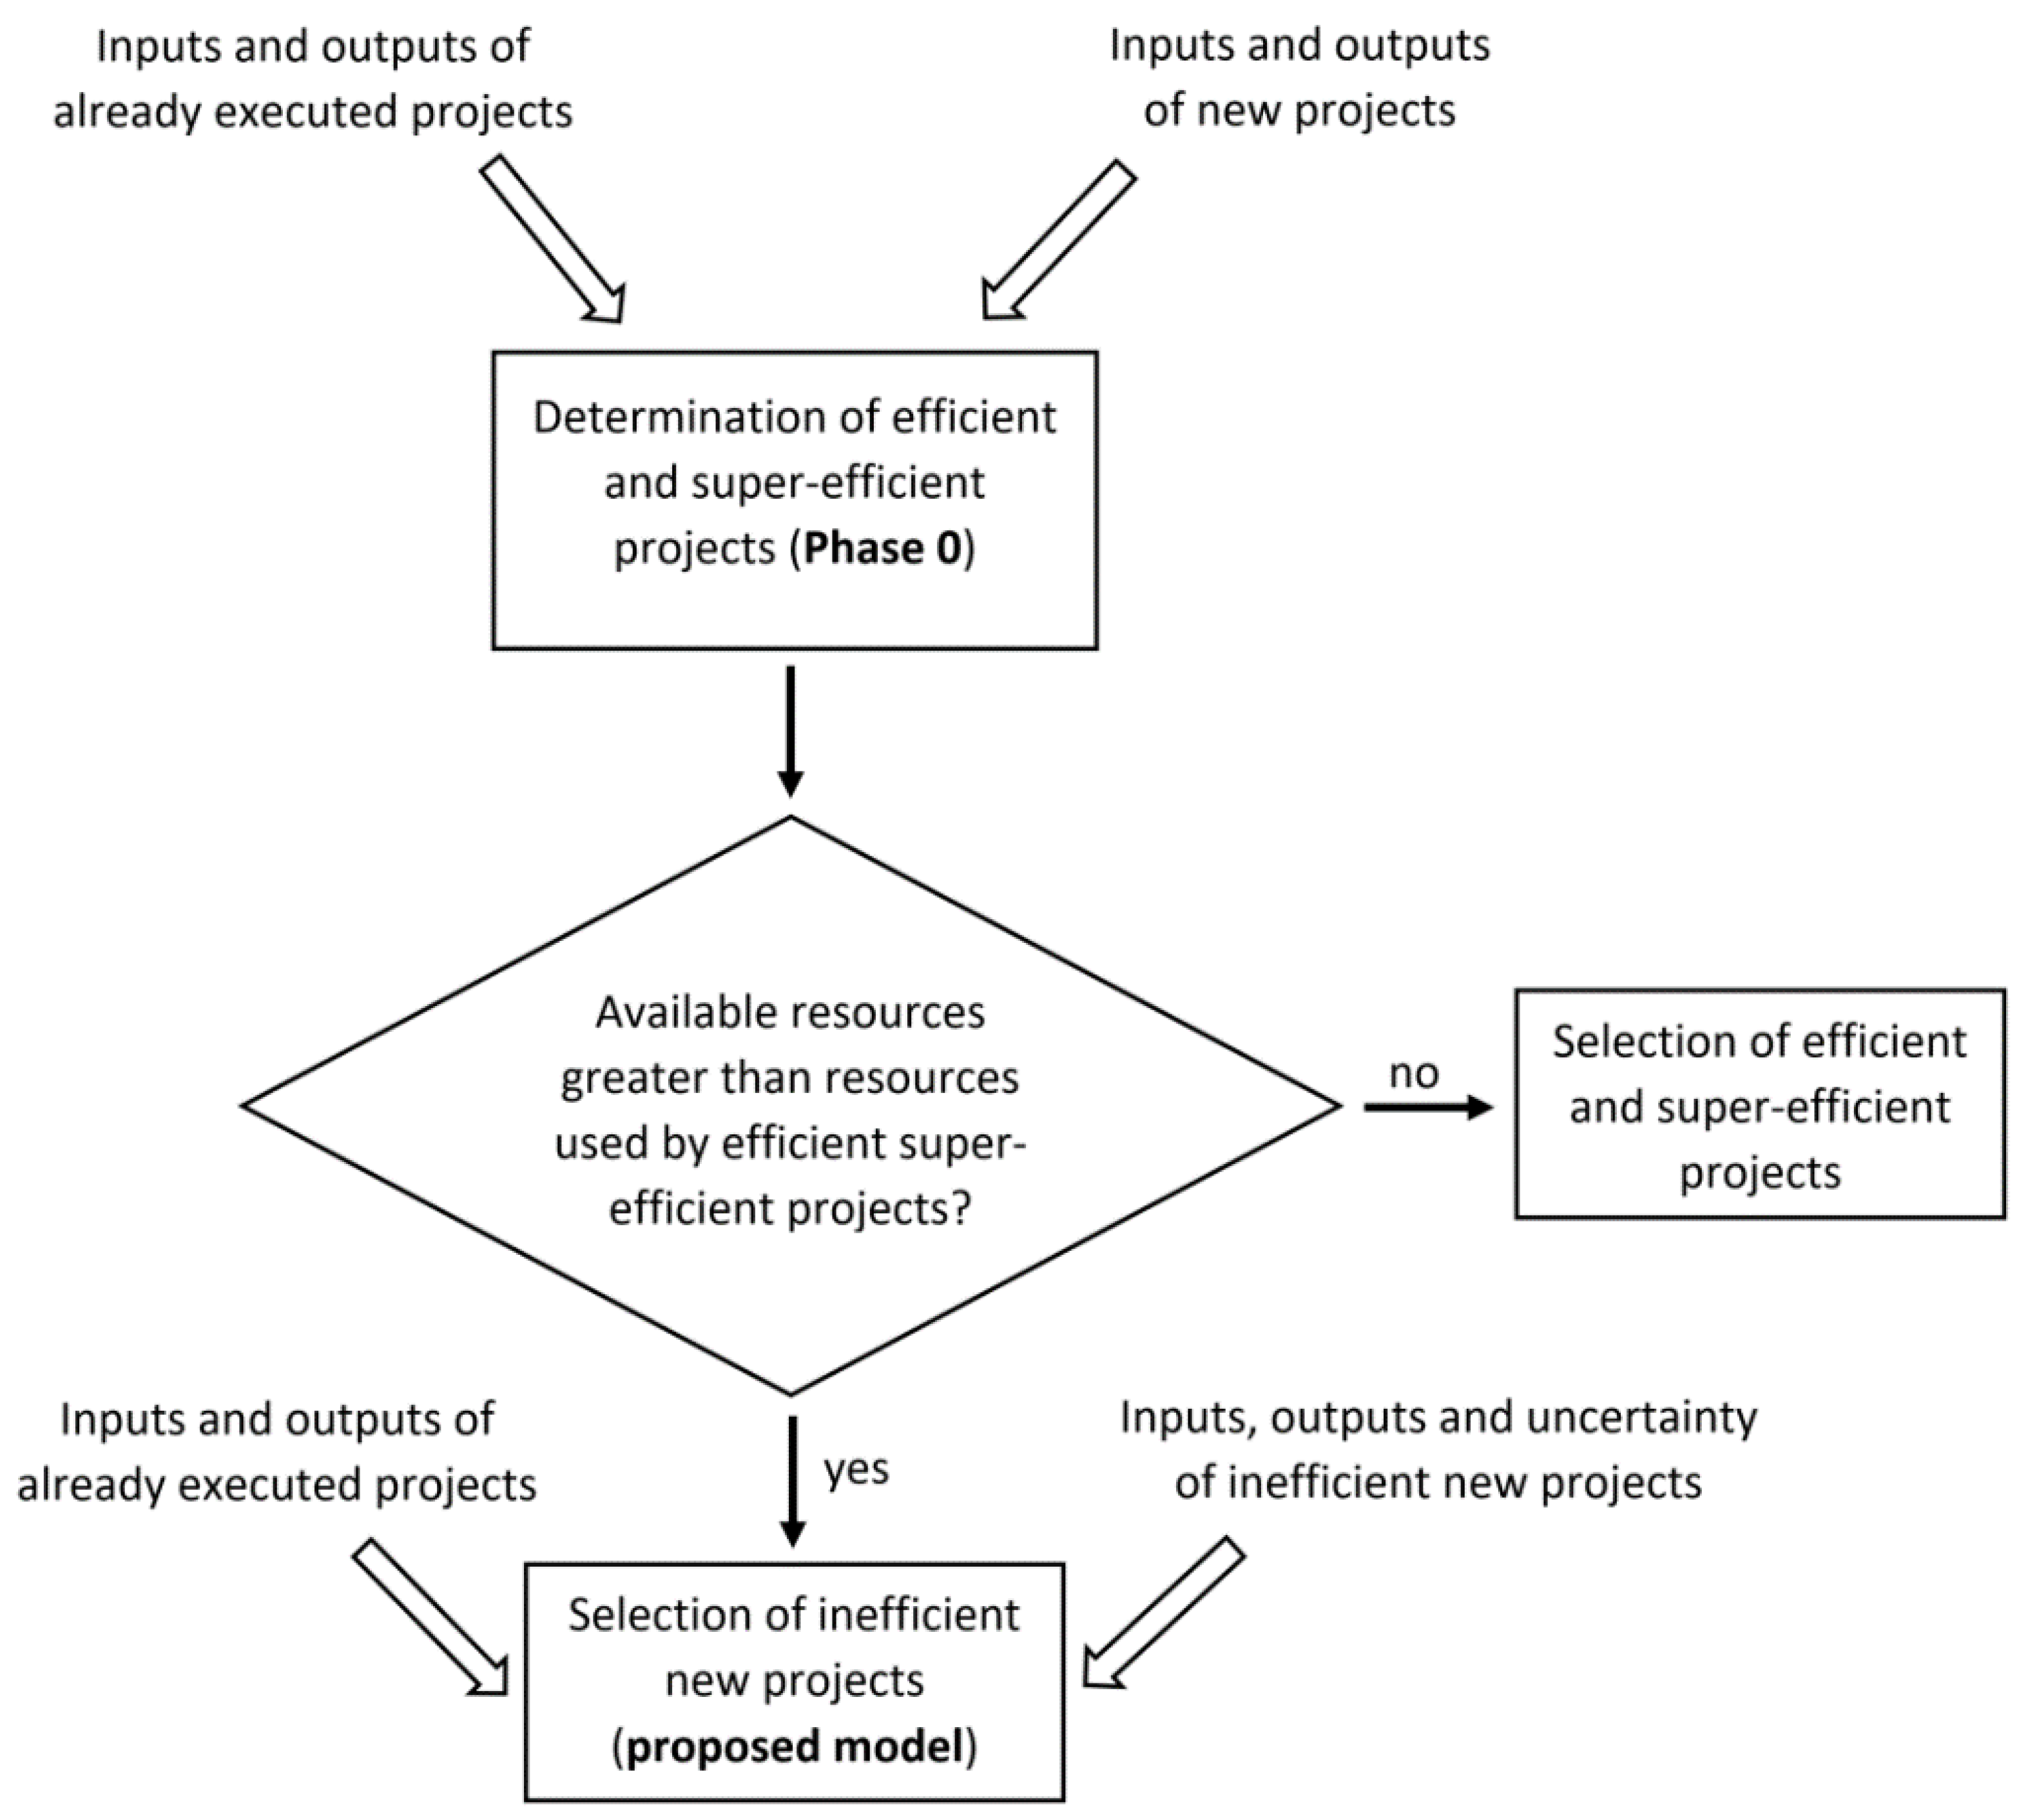
In this section, we propose a new DEA-based approach to solve the selection of ESCO portfolio projects. This approach could also be applied to other contexts, if similar assumptions can be considered. Figure 1 shows a block diagram that summarises the various phases that compose the proposed approach.
Through the inputs and outputs of both the already executed projects and the new projects, phase 0 determines which projects are efficient and super-efficient, assuming that the company’s DEA technology is inferred from the already executed projects. These projects are selected on the sufficiency of the available resources. In this case, with the remaining available resources, the selection of inefficient new projects in phase 0 would be made using a centralised DEA model (proposed model). Alternatively, in the event that the available resources were insufficient to face all the efficient and super-efficient projects determined by phase 0, it would be necessary to select which of these would be carried out by the company.
First, we will show the assumptions in which the problem is based, then we present the notation used, and finally, we present the proposed DEA model.
3.1. Assumptions
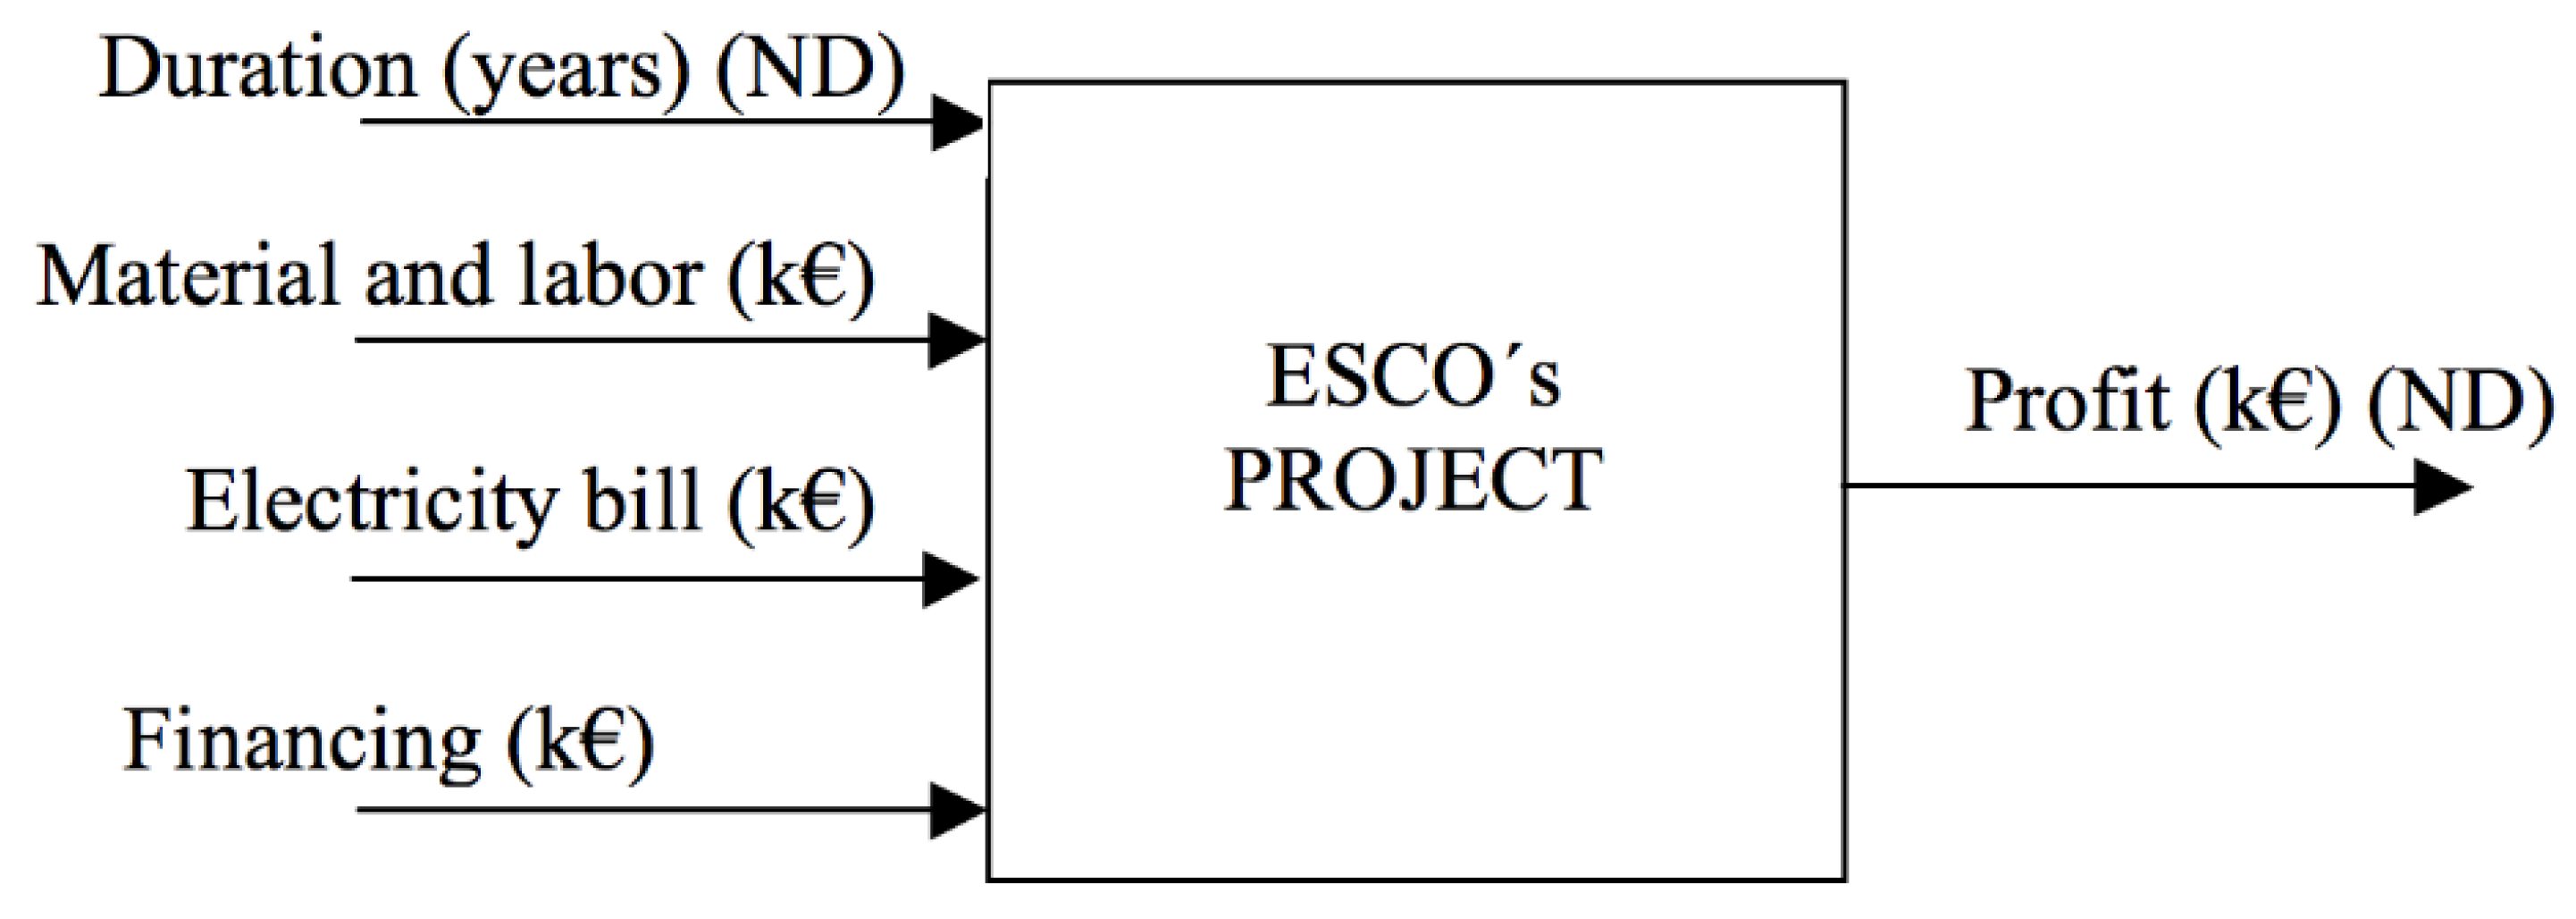
Consider an ESCO that has a portfolio of projects (PP) among which, due to resource availability constraints, it should select a subset to be carried out. To make this decision, it makes sense to use the recorded information on already-executed projects (AEP). Figure 2 shows the inputs and outputs involved in a typical ESCO project.
Both the project duration and the profit are non-discretionary variables defined in the request for proposal. The first is related to the risk of undertaking the project and is considered as an input as the lengthier the duration of the project, the higher the revenue obtained should be. On the other hand, the material and labour cost, electricity bill and the financing are set by the bid manager, to comply with customer requirements. We will consider that the ESCO has established an upper limit for the total amount of each of the discretionary resources of the projects that can be committed.
3.2. Notation
Before formulating the proposed DEA model, let us introduce the required notation:
Data
| j | index for already executed projects (AEP). |
| r | index for portfolio projects (PP). |
| i | index for discretionary inputs, namely: material and labour cost (MAT&LAB COST), electricity bill (ELEC BILL) and financing (FIN) |
| O | set of projects that have already been executed (AEP). |
| N | set of portfolio projects (PP) |
| revenue of AEP j | |
| revenue of PP r | |
| duration of AEP j | |
| duration of PP r | |
| amount of input i of AEP j (i = MAT&LAB COST, ELEC BILL), | |
| vector of discretionary inputs of PP r. | |
| cost of discretionary input i ( for i = MAT&LAB COST and ELEC BILL) | |
| amount of discretionary input i available for the execution of the projects. | |
| probability that PP r be won (i.e., the tender be chosen by the customer) |
Decision variables
| intensity variables for PP r. | |
| target of discretionary input i consumed by PP r. | |
| binary variable that indicates if PP r will be selected ( = 1) or not ( = 0). |
3.3. The Proposed Model
The proposed DEA can be formulated as:
This model uses a centralised DEA approach [30] with a profit maximisation criterion. It has, however, many features specific to the project selection at hand. Thus, for example, as we consider that PP r may eventually be executed with a probability pr, the objective function maximises the total expected profit that the selected projects would bring if they were executed. This profit is measured on the basis that the selected projects will be carried out efficiently, i.e., consuming the target values computed in constraint (2). Constraint (5) guarantees that the expected consumption of the discretionary inputs is below the established limits. The duration of PP r (DURr) and its revenue (REVr) are treated as non-discretionary variables in (3) and (4). Note that the revenue is multiplied by the binary variable in the objective function as well as in (4). Constraint (6) guarantees that efficient targets will be computed only for the selected projects. The variables thus serve to filter out the projects of interest when computing the expected revenue and cost. Note that the binary character of the lambda variables indicates the Free Disposal Hull (FDH) technology considered [31]. Note also that this technology is inferred from the AEP, whose inputs and outputs are certain. The PP inputs and outputs do not have this consideration. Until the corresponding project is executed, inputs and outputs are only considered as estimations. In addition, although the set O may contain all AEP, actually only non-dominated (i.e., efficient) AEP need to be considered as they define the corresponding efficient frontier.
The above model selects, among the PP, those that would bring about the largest expected profit without exceeding, in expected terms, the available input constraints. A very important feature of the above model, which distinguishes it from existing DEA project selection approaches is that not only the corresponding projects are selected but also, they are improved, i.e., any inefficient use of the resources is detected and removed so that the original PP are substituted by their improved, efficient targets. Note that the improvement only affects the discretionary inputs (i.e., MAT&LAB COST, ELEC BILL and FIN). The project duration and revenue are considered fixed and, hence, non-discretionary. As we commented above, when the diagram block of Figure 1 was explained, as the PP are selected using the technology defined by the AEP, and PP data are estimated, it may occur that some PP actually fall outside the AEP technology; in which case the above model might be infeasible or, at least, would never select such super-efficient PP. To prevent this, the super-efficient PP are identified using the DEA model below (labeled Phase 0). The super-efficient PP are selected ex ante and hence they are not included in the set of PP considered in model (1)–(9). Of course, the expected input consumption of those pre-selected projects is deducted from the overall input availability so that the values used in model (1)–(9) are the remaining available quantities. Similarly, the set N in model (1)–(9) consists of the PP not identified as super-efficient.
To identify the super-efficient projects, the following input-oriented slacks-based measure of efficiency (SBM) DEA model must be solved for each PP r. Let be the reduction of the discretionary input i for the PP r.
Phase 0
If for a certain DMU r this model is infeasible, i.e., PP r does not belong to the AEP technology, then objective function (10) and the constraint (16) should be reversed, i.e.,
Note that the reversed model corresponds to the super-SBM efficiency measure [10]. An alternative to carrying out these two steps to identify the super-efficient PP is to solve a single, integrated SBM/super-SBM as the one proposed in [25]. Once super-efficient PP are identified and with this information, their inputs and output values should be checked so that the corresponding estimations may be confirmed or revised. In the latter case, their super-efficient status should also be reassessed. In the end, the final super-efficient PP are removed from the set N because they are selected beforehand and therefore do need not be included in model (1)–(9). It is also necessary, as mentioned above, to calculate the total remaining inputs available . If there were many super-efficient PP and small amounts of available resources, it is possible that the latter would preclude carrying out all the super-efficient PP. In such an unlikely scenario, it would not be necessary to run model (1)–(9) and the projects would just be selected from the super-efficient PP in descending order of their super-SBM efficiency score (17) until the available resources are exhausted.
4. Case Study
In this section, the proposed approach is applied to a Spanish ESCO that provides comprehensive energy efficiency improvement services in all types of facilities, including investment finance management, and formalises it by conducting a contract for savings assurance services. The three main types of projects that this ESCO carries out are:
- Residential sector, mainly multi-family buildings. This represents 20% of annual turnover and the projects mainly involve improvement of heating and air conditioning systems and sanitary hot water;
- Commercial sector, mainly malls. This represents 30% of annual turnover and the projects involve the improvement of air conditioning, lighting, and photovoltaic installations;
- Local government sector. This represents the 50% of annual turnover. The projects are varied, from improvement of street lighting to energy saving in schools and municipal buildings including installing on-site solar and photovoltaic facilities.
At the time of this study, this ESCO had executed 19 efficient projects, and was considering the execution of 12 portfolio projects (see Table 1). Note that the AEP have been labeled as O# (old project) and the PP as N# (new project). Table 1 also shows the probability pr of the corresponding PP tenders being accepted.
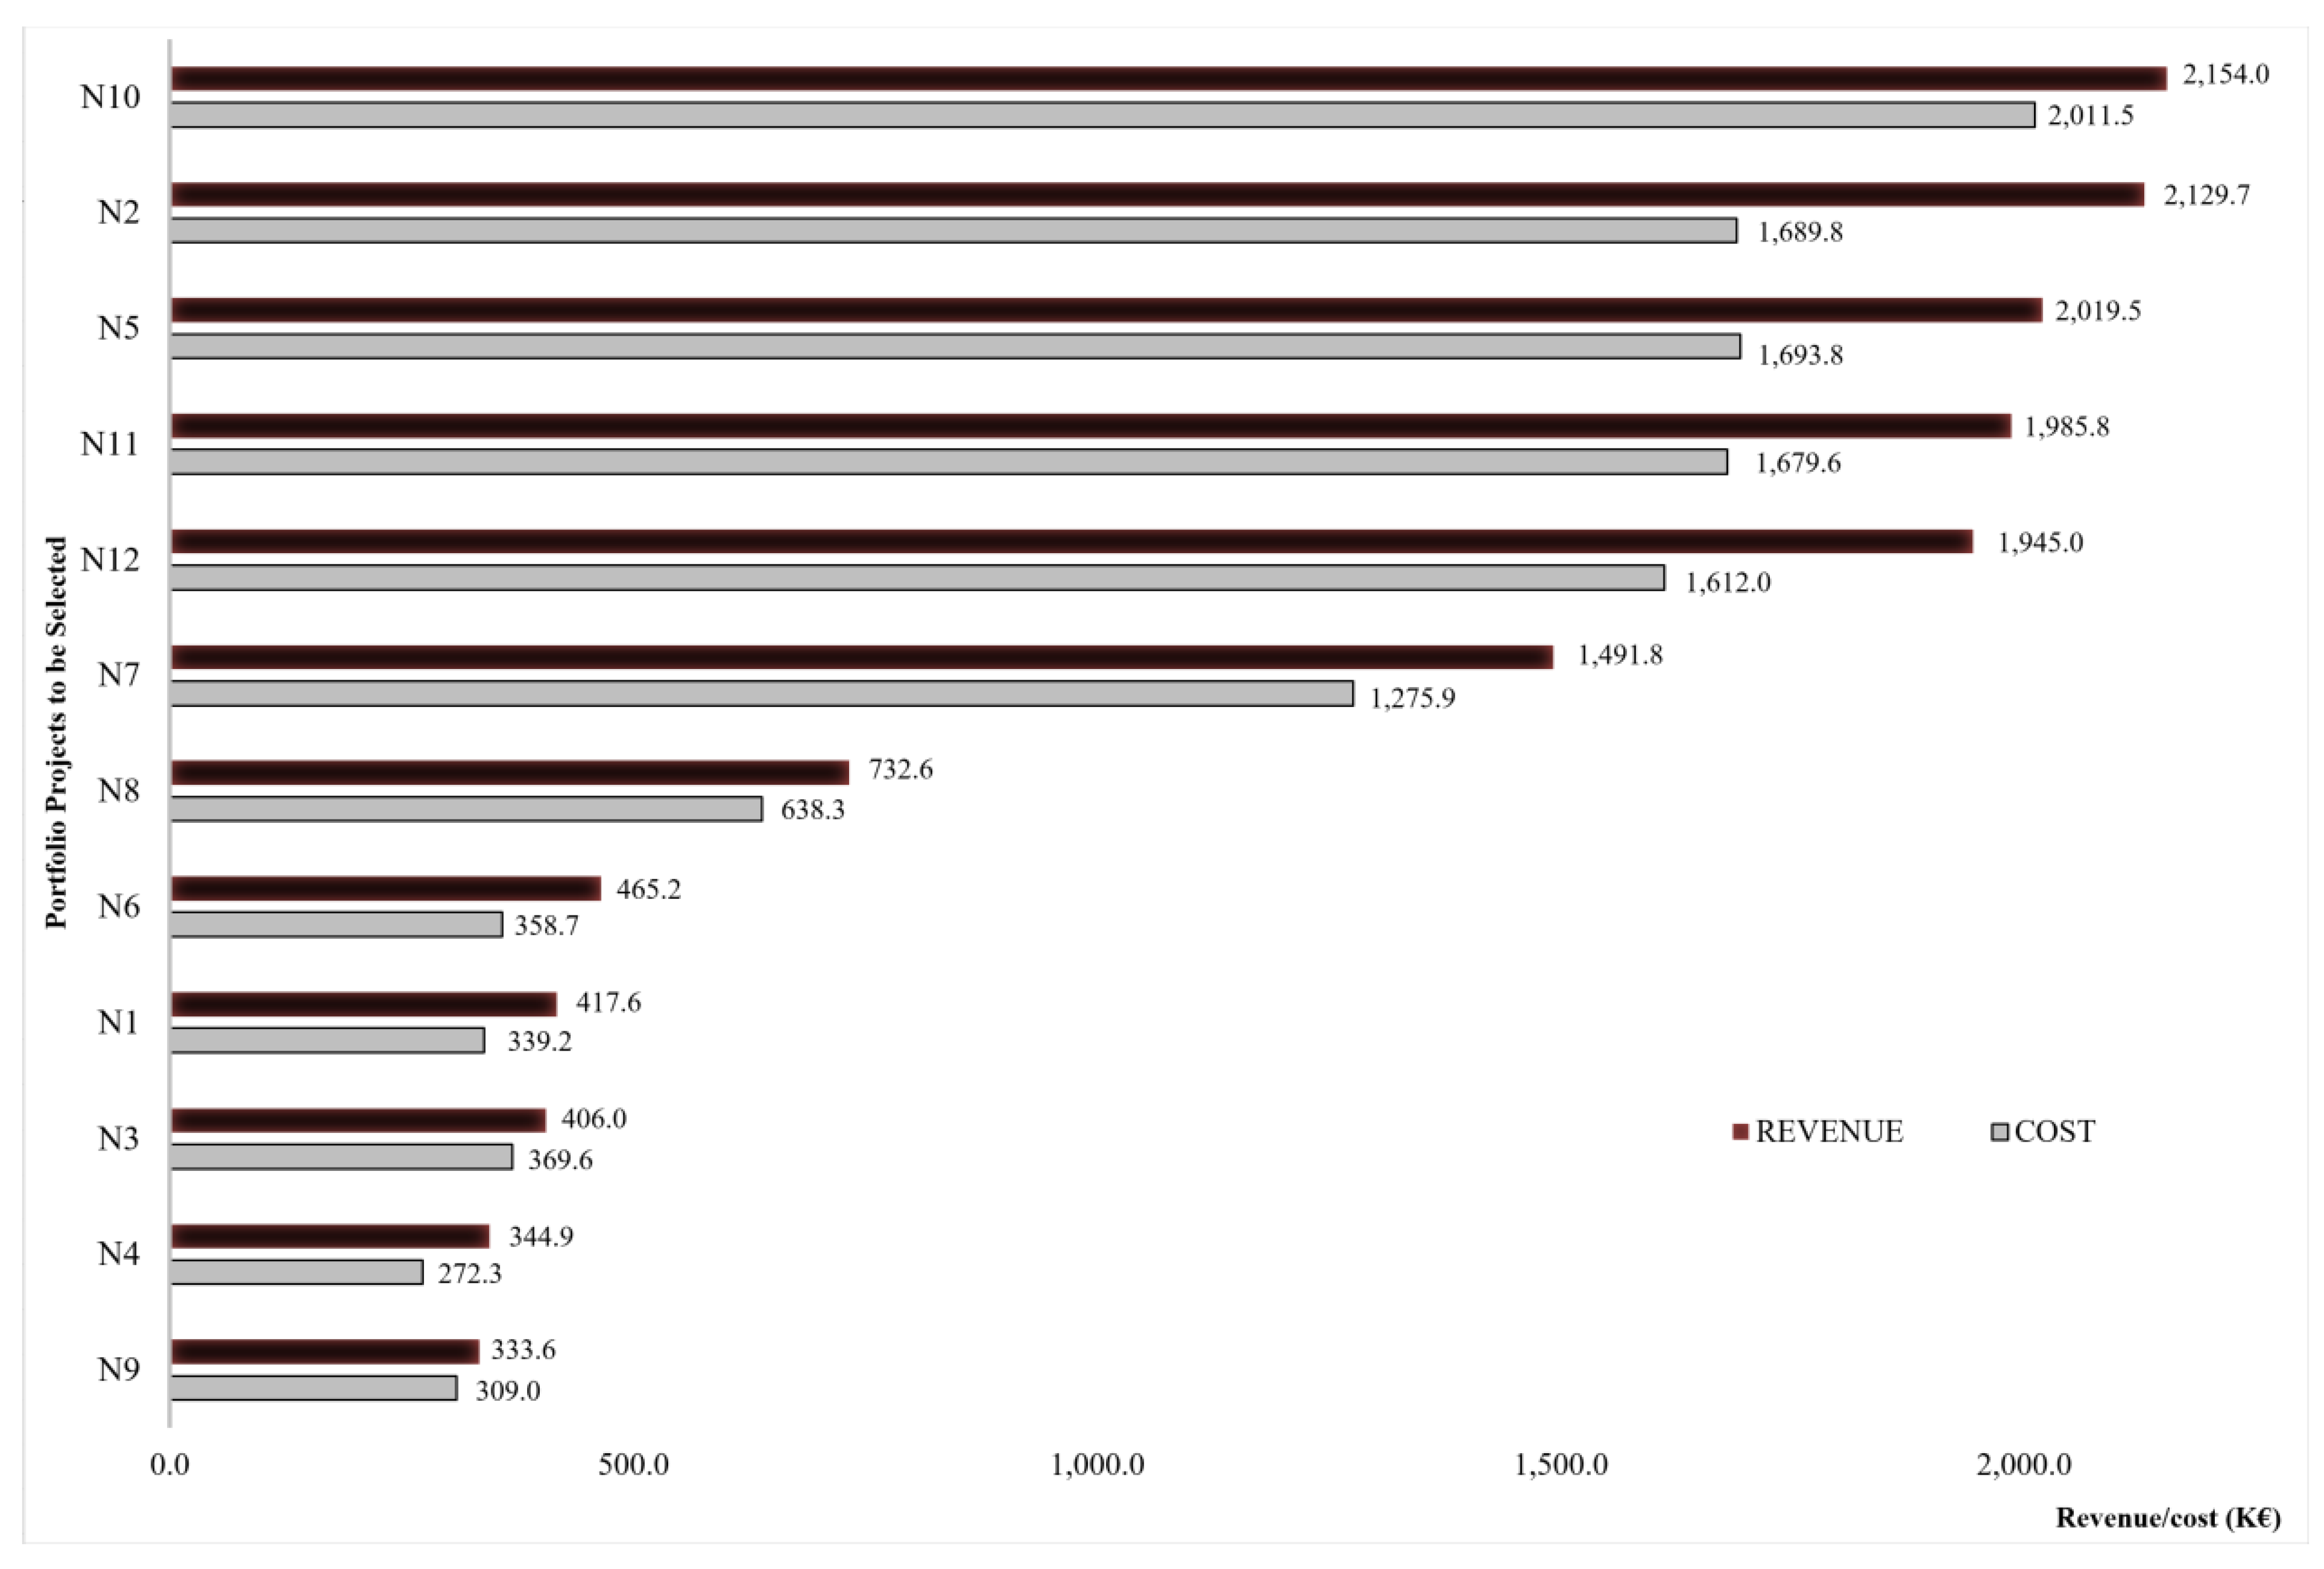
Figure 3 shows the revenue and the sum of the costs of each PP, assuming a 12% financing cost ( = 0.12). The PP are shown in descending order of their revenue. Note that half the PP are small and the other half are large (in terms of their revenue and input costs).
Table 2 shows the results of Phase 0. Two PP, namely N7 and N9, have been identified as super-efficient, i.e., they fall outside the AEP technology. The remaining PP are relatively inefficient, with a maximum SBM efficiency score of 0.825. The two super-efficient PP will be selected prior to solving model (1)–(9) and their expected input consumption will be deducted from the available inputs to determine the corresponding to be used in the model. Note that since N7 has a higher SuperSBM efficiency than N9, in case the available inputs were insufficient to carry out both projects, only N7 will be selected in Phase 0. In that case, model (1)–(9) would still be solved (without considering model N9) with the remaining available inputs to determine if it is possible to carry out some additional PP. Take into account that since model (1)–(9) considers improved versions of the original PP, this increases the number of PP that can be carried out (and the profits that can be obtained) with the given number of available resources. This feature of selecting improved, efficient versions of the original PP is a novelty, and an advantage of the proposed approach with respect to existing DEA project selection approaches, all of which can only select the original PP, even though they may be inefficient with regard to resource usage.
To compare our approach to other methods proposed in the literature, we have used the CG and TM models proposed in [21,22], respectively, which are unique methods that assume a limited level of resources. Note, however, that it has been necessary to modify them to consider the PP duration and profit as non-discretionary variables and to take into account the probability of the selected projects eventually winning their corresponding tenders. For more details of the formulation of both models see the Appendix A and Appendix B.
To specify the main differences between our approach and the models proposed in [21,22], Table 3 summarises the different features of these methods.
Table 4 shows the solution provided by the different approaches. The bottom row shows the available amount of each discretionary input as established by the ESCO. The figures within parenthesis represent the expected inputs necessary for the execution of the super-efficient PP (N7 and N9). The remaining number of resources available for the remaining projects, i.e., in model (1)–(9), can be obtained subtracting the total amount available by the expected consumption of N7 and N9.
The PP selected by the proposed approach, in addition to N7 and N9, are N4′; N5′; N6′; N8′; and N10′, where N#’ indicates the improved, efficient targets of the original PP. This does not occur in the cases of CG and TM models that choose only among the original PP. Note that for the given available inputs shown in the bottom row of Table 4, both CG and TM methods select the same number of projects and in both cases, the selected projects include N7 and N9. Note that our method is able to select a higher number of projects with the same availability of resources. This is possible because the proposed approach identifies and removes the inefficiency of the original PP, thus making more efficient use of the limited resources available.
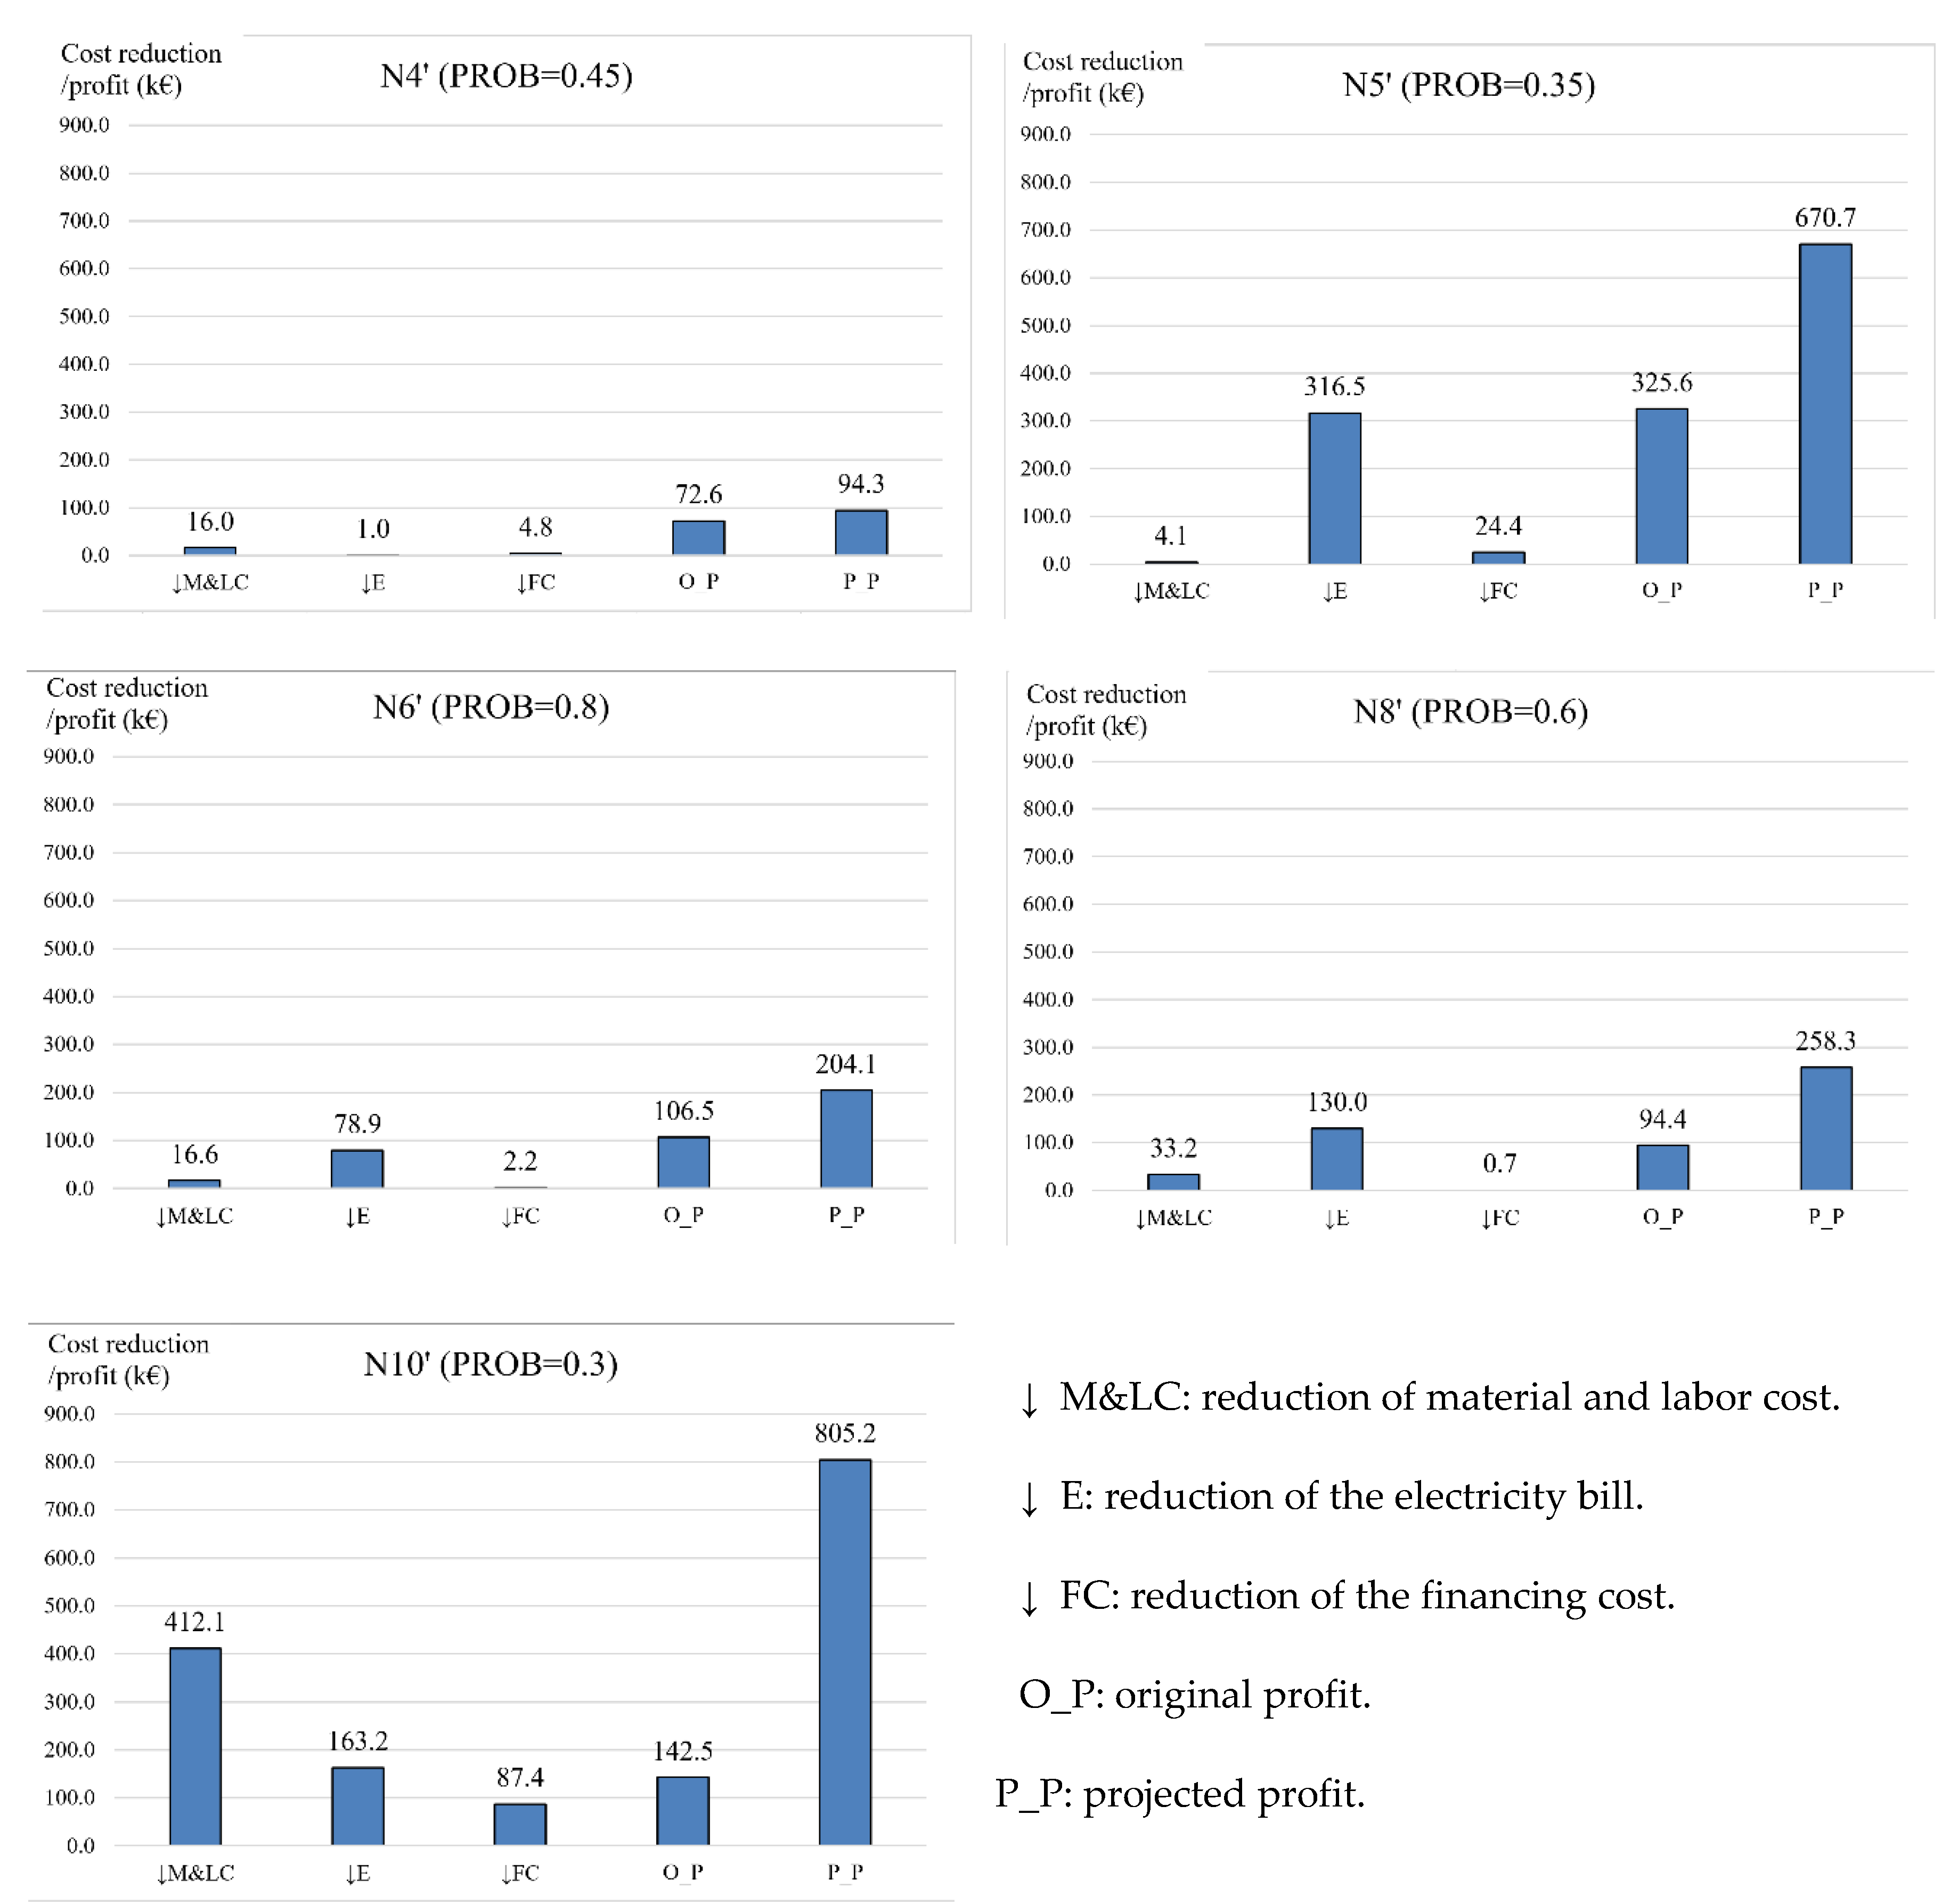
Figure 4 shows the input cost reductions obtained by the proposed approach, as well as the profit generated by each selected project in its original and improved, efficient version. N10′ provides the highest material and labour cost reduction (412.1 k€), what means that if N10′ is executed, the ESCO will reduce this cost with respect to the original data 1353.7 k€ (see Table 1) by 30.4%. The maximum reduction of the electricity bill is obtained by N5′ (316.5 k€), and the maximum reduction of financing cost is provided by N10′ (87.4 k€). In contrast, the minimum reductions are obtained by N5′ (4.1 k€ in material and labour cost); N4′ (1.0 k€ in electricity bill) and N8′ (0.7 k€ in financing cost). N10′ also presents the largest value of profit (805.2 k€), and the largest profit improvement with respect to the original one, as it presents the greatest value of the total cost reduction (412.1 k€ + 163.2 k€ + 87.4 k€ = 662.7 k€). From another view point, although the selection of the project N10′ will lead to the greatest benefits, its implementation will require the greatest effort in terms of the reduction of the original input values. On the contrary, the selection of project N4′ brings about a lower profit, but also it can be obtained with less effort (a total input cost reduction of just 21.7 k€ with respect to the original data).
In Table 5, we study how the “optimal” projects are selected by the proposed approach change when the availability of the discretionary inputs changes. The available inputs used in the base scenario considered in Table 4 and Figure 4 corresponds to the row shown in bold. Note that when the level of available inputs is very low (600 k€ for each input), only the PP with the highest SuperSBM efficiency (N7) is chosen. As soon as the availability of MAT&LAB COST and ELEC BILL rise an additional 100 k€ each, it is possible to also select N9. N6′ is the project selected the greatest number of times in the range of values studied (15), followed by N4′ (11) and N10′ (8). Contrarily, N11′ and N12′ are never chosen, probably because of their large size. In this regard, note that ultimately, project selection under resource constraints is similar to a multidimensional knapsack problem.
Note that N11 and N12 are not shown in the table due to not being selected in any case. The last column of Table 5 shows the expected profit obtained in each scenario, i.e., the optimal value of the objective function (1). The highest percentage profit increase occurs when project N6′ is added to N7 and N9 (80.4%). From that point on, the average profit increase obtained, with the successive increases in the availability of the resources, is 14.2%.
5. Conclusions
In this paper, a new method for solving the PP selection problem in an ESCO using a centralised DEA model is proposed. The model considers that the selected PP have a certain probability of being executed, and, if they are finally carried out, it will be done so efficiently. This is a novel and advantageous feature of the proposed approach as it not only identifies the combination of PP that provides the maximum expected profit but also identifies and removes the inefficiencies that may be present in those PP.
Another interesting feature of the proposed approach is that the DEA technology is determined by the AEP. This is because the data for these projects, i.e., their resource consumption, are known with certainty, unlike in the case of the PP that can be selected, whose resource consumption is estimated and will only be given the status of certain once those projects have been completed. The fact that the DEA technology is determined only by the AEP means that some PP may be super-efficient. A conventional, input-oriented super-SBM model can be used to detect that case. Moreover, the corresponding super-SBM efficiency score is used to rank the super-efficient PP, so that if the available resources allow it, they are selected beforehand (what we have labeled Phase 0) before solving the proposed centralised DEA PP selection model.
The proposed approach has been applied to the current portfolio projects of a Spanish ESCO. The results obtained by the proposed approach have been compared with the results of two project selection DEA approaches, namely CG [21] and TM [22], whose models have been appropriately adapted to be able to the PP problem under study. By design, the proposed approach obtains the largest expected profit for the selected projects. It also selects a higher number of PP, given the availability of discretionary inputs. This is because the proposed approach, unlike the CG and TM methods, is able to reduce the input consumption of the selected PP (from their original values) and hence makes more efficient use of the available resources. Additionally, it has been observed that the number and the specific PP selected generally depend on the amount of resources available, something which is logical and reasonable.
In conclusion, this article has proposed a new approach for selecting projects considering their economic efficiency, when the peculiarities of an ESCO are present; that is, assuming the uncertainty of not achieving said project, taking into account the available resources, and considering that all projects will be carried out efficiently. The results obtained indicate that the proposed approach makes a more realistic and efficient selection of portfolio projects than the existing DEA methods, which required modifying to accommodate the assumptions present in ESCOs’ scenario.
The results provided by our proposed method were shown to the target ESCO’s managers and although the results came after the company had already selected the projects with a methodology based primarily on experience, both results were quite similar. Likewise, the company was very interested in the way in which the projects had been selected, specifically because our methodology considers that they would be executed efficiently.
Since the proposed approach uses a novel centralised DEA perspective on the problem, it opens up many topics for further research. Thus, a dynamic DEA approach can be developed to take into account the multiperiod nature of the problem. Note that the projects have different start and end times, and hence, as soon as one project is completed, the resources used by one project (e.g., labour) will be released and made available for another to use. Additionally, in this paper the duration and revenue of the PP are assumed as fixed. The effects of relaxing this assumption, for example using goal programming or soft restrictions, can be assessed. Finally, modelling the uncertainty on the input and output data using fuzzy sets seems an interesting line of research.
Author Contributions
Conceptualization, G.V.; S.L. and S.R.; data collection, S.R.; methodology, G.V. and S.L.; software, G.V.; validation, S.L. and S.R.; writing—original draft preparation, G.V.; writing—review and editing, G.V. and S.L. All authors have read and agreed to the published version of the manuscript.
Funding
This research was carried out with the financial support of the Spanish Ministry of Economy, Industry and Competitiveness and the European Regional Development Fund, Grant DPI2017-85343-P.
Institutional Review Board Statement
Not applicable.
Informed Consent Statement
Not applicable.
Data Availability Statement
Data is contained within the article.
Conflicts of Interest
The authors declare no conflict of interest.
Appendix A
(Modified) CG model.
This model is adapted from the model proposed in [21]. Basically, we have followed the notation used in Equation (4) in [22], incorporating three modifications. First, the probabilities of the selected projects have been incorporated by multiplying the inputs and outputs of new projects (N) by pr in (A1), (A2), (A4) and (A5). Second, the PP duration is considered a non-discretionary variable. Hence, we have incorporated the corresponding terms in the objective function (A1). Finally, note that we have only considered the old projects (O) in (A3), as these are the projects used to define the technology.
Appendix B
(Modified) TM model.
References
- Vine, E.; Nakagami, H.; Murakoshi, C. The evolution of the US energy service company (ESCO) industry: From ESCO to Super ESCO. Energy 1999, 24, 479–492. [Google Scholar] [CrossRef]
- Shang, T.; Zhang, K.; Liu, P.; Chen, Z.; Li, X.; Wu, X. What to allocate and how to allocate?—Benefit allocation in Shared Savings Energy Performance Contracting Projects. Energy 2015, 91, 60–71. [Google Scholar] [CrossRef]
- Vine, E.; Murakoshi, C.; Nakagami, H. International ESCO business opportunities and challenges: A Japanese case study. Energy 1998, 23, 439–447. [Google Scholar] [CrossRef] [Green Version]
- Bertoldi, P.; Boza-Kiss, B. Analysis of barriers and drivers for the development of the ESCO markets in Europe. Energy Policy 2017, 107, 345–355. [Google Scholar] [CrossRef]
- Vine, E. An international survey of the energy service company (ESCO) industry. Energy Policy 2005, 33, 691–704. [Google Scholar] [CrossRef]
- Graves, S.B.; Ringuest, J.L. Models & Methods for Project Selection, Concepts from Management Science, Finance and Information Technology, 1st ed.; Springer US: New York, NY, USA, 2003. [Google Scholar]
- Sadi-Nezhad, S. A state-of-art survey on project selection using MCDM techniques. J. Proj. Manag. 2017, 2, 1–10. [Google Scholar] [CrossRef]
- Cooper, W.W.; Seiford, L.M.; Tone, K. Data Envelopment Analysis. A Comprehensive Text with Models, Applications, References and DEA-Solver Software, 1st ed.; Springer US: New York, NY, USA, 2000. [Google Scholar]
- Tone, K. A slacks-based measure of efficiency in data envelopment analysis. Eur. J. Oper. Res. 2001, 130, 498–509. [Google Scholar] [CrossRef] [Green Version]
- Tone, K. A slacks-based measure of super-efficiency in data envelopment analysis. Eur. J. Oper. Res. 2002, 143, 32–41. [Google Scholar] [CrossRef] [Green Version]
- Soltani, N.; Lozano, S. Interactive multiobjective DEA target setting using lexicographic DDF. RAIRO-Oper. Res. 2020, 54, 1703–1722. [Google Scholar] [CrossRef] [Green Version]
- Lozano, S.; Soltani, N. Lexicographic hyperbolic DEA. J. Oper. Res. Soc. 2020, 71, 979–990. [Google Scholar] [CrossRef]
- Lozano, S.; Soltani, N. Efficiency assessment using a multidirectional DDF approach. Int. Trans. Oper. Res. 2020, 27, 2064–2080. [Google Scholar] [CrossRef]
- Sowlati, T.; Paradi, J.C.; Suld, C. Information systems project prioritization using data envelopment analysis. Math. Comput. Model. 2005, 41, 1279–1298. [Google Scholar] [CrossRef]
- Ghapanchi, A.H.; Tavana, M.; Khakbaz, M.H.; Low, G. A methodology for selecting portfolios of projects with interactions and under uncertainty. Int. J. Proj. Manag. 2012, 30, 791–803. [Google Scholar] [CrossRef]
- Tavana, M.; Khalili-Damghani, K.; Sadi-Nezhad, S. A fuzzy group data envelopment analysis model for high-technology project selection: A case study at NASA. Comput. Ind. Eng. 2013, 66, 10–23. [Google Scholar] [CrossRef]
- Yousef, A.; Hadi-Vencheh, A. Selecting Six Sigma projects: MCDM or DEA? J. Model. Manag. 2016, 11, 309–325. [Google Scholar] [CrossRef]
- Wen, Y.; An, Q.; Xu, X.; Chen, Y. Selection of Six Sigma project with interval data: Common weight DEA model. Kybernetes 2018, 47, 1307–1324. [Google Scholar] [CrossRef]
- Toloo, M.; Nalchigar, S.; Sohrabi, B. Selecting most efficient information system projects in presence of user subjective opinions: A DEA approach. Cent. Eur. J. Oper. Res. 2018, 26, 1028–1051. [Google Scholar] [CrossRef]
- Fiala, P. Project portfolio designing using data envelopment analysis and De Novo optimization. Cent. Eur. J. Oper. Res. 2018, 26, 847–859. [Google Scholar] [CrossRef]
- Cook, W.D.; Green, R.H. Project prioritization: A resource-constrained data envelopment analysis approach. Socio-Econ. Plan. Sci. 2000, 34, 85–99. [Google Scholar] [CrossRef]
- Toloo, M.; Mirbolouki, M. A new project selection method using data envelopment analysis. Comput. Ind. Eng. 2019, 138, 116–119. [Google Scholar] [CrossRef]
- Sarkar, M.; Sarkar, B. How does an industry reduce waste and consumed energy within a multi-stage smart sustainable biofuel production system? J. Clean. Prod. 2020, 262, 121200. [Google Scholar] [CrossRef]
- Ahmed, W.; Sarkar, B. Management of next-generation energy using a triple bottom line approach under a supply chain framework. Resour. Conserv. Recycl. 2019, 150, 104431. [Google Scholar] [CrossRef]
- Bhuniya, S.; Sarkar, B.; Pareek, S. Multi-Product Production System with the Reduced Failure Rate and the Optimum Energy Consumption under Variable Demand. Mathematics 2019, 7, 465. [Google Scholar] [CrossRef] [Green Version]
- Rabbani, M.; Zahedifard, S.; Rezaei-Malek, M. An integrated multi-criteria decision-making approach for portfolio problem in energy service companies under uncertainty. Econ. Comput. Econ. Cybern. Stud. Res. Metr. 2018, 52, 305–322. [Google Scholar]
- Painuly, J.P.; Park, H.; Lee, M.K.; Noh, J. Promoting energy efficiency financing and ESCOs in developing countries: Mechanisms and barriers. J. Clean. Prod. 2003, 11, 659–665. [Google Scholar] [CrossRef]
- Stuart, E.; Larsen, P.H.; Goldman, C.A.; Gilligan, D. A method to estimate the size and remaining market potential of the U.S. ESCO (energy service company) industry. Energy 2014, 77, 362–371. [Google Scholar] [CrossRef] [Green Version]
- Deng, Q.; Jiang, X.; Zhang, L.; Cui, Q. Making optimal investment decisions for energy service companies under uncertainty: A case study. Energy 2015, 88, 234–243. [Google Scholar] [CrossRef]
- Lozano, S.; Villa, G. Centralized resource allocation using data envelopment analysis. J. Prod. Anal. 2019, 22, 143–161. [Google Scholar] [CrossRef]
- Deprins, D.; Simar, L.; Tulkens, H. Measuring Labor-Efficiency in Post Offices. In Public Goods, Environmental Externalities and Fiscal Competition, 1st ed.; Chander, P., Drèze, J., Lovell, C.K., Mintz, J., Eds.; Springer: Boston, MA, USA, 2006; pp. 285–309. [Google Scholar]
Figure 1.
Representation of the proposed approach.

Figure 2.
The energy service company (ESCO) project selection problem.

Figure 3.
Revenue and cost of the new projects (Projects shown in descending order of Revenue).

Figure 4.
Input costs reductions and original and projected profit of projects selected by the proposed approach.
Figure 4.
Input costs reductions and original and projected profit of projects selected by the proposed approach.


Table 1.
Inputs, outputs of old and new projects; and probability of new projects. (ND = non-discretionary).
Table 1.
Inputs, outputs of old and new projects; and probability of new projects. (ND = non-discretionary).
| Project | Inputs | Output | pr | |||
|---|---|---|---|---|---|---|
| DUR (Years) (ND) | MAT&LAB COST (k€) | ELEC BILL (k€) | FIN (k€) | REVENUE (k€) (ND) | ||
| O1 | 10 | 123.1 | 82.8 | 111.0 | 299.9 | - |
| O2 | 10 | 229.4 | 219.4 | 212.2 | 865.3 | - |
| O3 | 7 | 117.0 | 291.2 | 121.3 | 490.6 | - |
| O4 | 12 | 744.2 | 258.6 | 916.8 | 1158.4 | - |
| O5 | 10 | 832.9 | 294.2 | 694.1 | 1315.5 | - |
| O6 | 12 | 329.5 | 174.4 | 197.4 | 603.7 | - |
| O7 | 5 | 77.4 | 128.2 | 49.9 | 226.3 | - |
| O8 | 10 | 59.6 | 186.8 | 35.7 | 347.3 | - |
| O9 | 12 | 95.0 | 75.6 | 86.0 | 210.4 | - |
| O10 | 10 | 852.7 | 2157.5 | 861.9 | 3489.7 | - |
| O11 | 8 | 395.0 | 159.2 | 230.0 | 647.9 | - |
| O12 | 10 | 941.6 | 346.7 | 504.0 | 2169.1 | - |
| O13 | 5 | 150.3 | 95.4 | 128.8 | 511.0 | - |
| O14 | 12 | 736.1 | 490.3 | 336.0 | 1295.2 | - |
| O15 | 10 | 126.2 | 185.9 | 86.7 | 392.2 | - |
| O16 | 5 | 232.9 | 375.0 | 244.0 | 681.0 | - |
| O17 | 15 | 1548.0 | 2605.3 | 1391.5 | 5006.6 | - |
| O18 | 15 | 199.2 | 544.2 | 118.8 | 770.8 | - |
| O19 | 16 | 1135.4 | 176.4 | 280.0 | 1487.4 | - |
| N1 | 5 | 190.0 | 118.6 | 255.4 | 417.6 | 0.80 |
| N2 | 12 | 1075.0 | 497.5 | 977.2 | 2129.7 | 0.85 |
| N3 | 12 | 250.5 | 95.5 | 196.5 | 406.0 | 0.75 |
| N4 | 10 | 75.6 | 187.7 | 75.3 | 344.9 | 0.45 |
| N5 | 12 | 945.7 | 663.2 | 707.3 | 2019.5 | 0.35 |
| N6 | 10 | 166.8 | 174.3 | 147.1 | 465.2 | 0.80 |
| N7 | 12 | 488.3 | 757.3 | 252.0 | 1491.8 | 0.85 |
| N8 | 10 | 262.6 | 349.5 | 218.0 | 732.6 | 0.60 |
| N9 | 12 | 231.3 | 64.9 | 106.4 | 333.6 | 0.80 |
| N10 | 12 | 1353.7 | 509.9 | 1232.0 | 2154.0 | 0.30 |
| N11 | 10 | 978.8 | 596.2 | 872.0 | 1985.8 | 0.80 |
| N12 | 10 | 987.5 | 520.0 | 871.2 | 1945.0 | 0.70 |
Table 2.
Slacks-based measure (SBM) and super-SBM efficiency scores of new projects provided by Phase 0.
Table 2.
Slacks-based measure (SBM) and super-SBM efficiency scores of new projects provided by Phase 0.
| Project | θ1 | θ2 | θ3 | SBM | θ1 | θ2 | θ3 | SuperSBM |
|---|---|---|---|---|---|---|---|---|
| N1 | 0.791 | 0.805 | 0.504 | 0.700 | - | - | - | - |
| N2 | 0.876 | 0.697 | 0.516 | 0.696 | - | - | - | - |
| N3 | 0.600 | 0.999 | 0.655 | 0.751 | - | - | - | - |
| N4 | 0.789 | 0.995 | 0.474 | 0.752 | - | - | - | - |
| N5 | 0.996 | 0.523 | 0.713 | 0.744 | - | - | - | - |
| N6 | 0.901 | 0.547 | 0.876 | 0.775 | - | - | - | - |
| N7 | - | - | - | - | 1.928 | 1 | 2 | 1.643 |
| N8 | 0.873 | 0.628 | 0.973 | 0.825 | - | - | - | - |
| N9 | - | - | - | - | 1 | 1.470 | 1.211 | 1.227 |
| N10 | 0.696 | 0.680 | 0.409 | 0.595 | - | - | - | - |
| N11 | 0.962 | 0.582 | 0.578 | 0.707 | - | - | - | - |
| N12 | 0.954 | 0.667 | 0.579 | 0.733 | - | - | - | - |
Table 3.
Characteristics of the methods compared in the article.
| Method | Metric | Technology | Uncertainty | Target Setting |
|---|---|---|---|---|
| Proposed | Economic Efficiency | FDH using already executed projects | YES | YES |
| CG [21] | Aggregate sum of outputs, using an aggregated weight | CRS, only use new projects | NO | NO |
| TM [22] | Aggregate sum of outputs, using individual weights | CRS, only use new projects | NO | NO |
Table 4.
Sum of inputs and expected inputs of selected projects in the solution of the different methods.
Table 4.
Sum of inputs and expected inputs of selected projects in the solution of the different methods.
| Method | Projects Selected | Raw Sum of Inputs of Selected Projects | Expected Input Consumption of Selected Projects | ||||
|---|---|---|---|---|---|---|---|
| MAT&LAB COST (k€) | ELEC BILL (k€) | FIN (k€) | MAT&LAB COST (k€) | ELEC BILL (k€) | FIN (k€) | ||
| Proposed | N4′; N5′; N6′; (N7); N8′; (N9); N10′ | 2322.4 | 1195.0 | 1384.7 | 1496.8 (600.1) | 1213.0 (695.7) | 873.0 (299.3) |
| CG | N4; N5; N6; N7; N8; N9 | 2170.4 | 2197.0 | 1506.1 | 1256.2 | 1361.4 | 829.2 |
| TM | N1; N3; N6; N7; N8; N9 | 1590.0 | 1560.0 | 1175.4 | 1231.1 | 1211.2 | 899.5 |
| Available inputs | 1500.0 (600.1) | 1400.0 (695.7) | 900.0 (299.3) | ||||
Notes: Projects labeled ′ represent the improved, efficient targets of the original portfolio of projects (PP). Projects within parenthesis were selected in Phase 0 (super-efficient PP). Their corresponding expected input consumption also appears within parenthesis.
Table 5.
Dependence of the selection projects solution on the available inputs.
| Available Inputs | Projects N# Selected | Expected Input Costs | Expected Profit | |||||||||||||
|---|---|---|---|---|---|---|---|---|---|---|---|---|---|---|---|---|
| MAT&LAB COST (k€) | ELEC BILL (k€) | FIN (k€) | 1′ | 2′ | 3′ | 4′ | 5′ | 6′ | 7 | 8′ | 9 | 10′ | MAT&LAB COST (k€) | ELEC BILL (k€) | FIN (k€) | |
| 600 | 600 | 600 | ✓ | 415.1 | 643.7 | 25.7 | 183.5 | |||||||||
| 700 | 700 | 600 | ✓ | ✓ | 600.1 | 695.7 | 35.9 | 203.2 | ||||||||
| 800 | 800 | 600 | ✓ | ✓ | ✓ | 720.3 | 772.0 | 48.3 | 366.5 | |||||||
| 800 | 900 | 600 | ✓ | ✓ | ✓ | ✓ | 747.1 | 856.0 | 50.2 | 408.9 | ||||||
| 900 | 1000 | 600 | ✓ | ✓ | ✓ | ✓ | ✓ | 884.8 | 987.7 | 65.5 | 563.9 | |||||
| 1000 | 1100 | 700 | ✓ | ✓ | ✓ | ✓ | ✓ | ✓ | 997.5 | 1059.2 | 77.1 | 672.5 | ||||
| 1100 | 1100 | 800 | ✓ | ✓ | ✓ | ✓ | ✓ | ✓ | ✓ | 1117.7 | 1135.5 | 89.4 | 797.7 | |||
| 1200 | 1100 | 800 | ✓ | ✓ | ✓ | ✓ | ✓ | ✓ | 1167.3 | 1091.7 | 83.6 | 805.5 | ||||
| 1300 | 1100 | 800 | ✓ | ✓ | ✓ | ✓ | ✓ | ✓ | 1260.7 | 1084.0 | 94.1 | 888.2 | ||||
| 1400 | 1200 | 900 | ✓ | ✓ | ✓ | ✓ | ✓ | ✓ | ✓ | 1373.4 | 1155.5 | 105.7 | 996.8 | |||
| 1500 | 1400 | 900 | ✓ | ✓ | ✓ | ✓ | ✓ | ✓ | ✓ | 1496.8 | 1213.0 | 104.8 | 1040.2 | |||
| 1600 | 1400 | 900 | ✓ | ✓ | ✓ | ✓ | ✓ | 1547.5 | 1150.7 | 101.6 | 1072.7 | |||||
| 1700 | 1400 | 900 | ✓ | ✓ | ✓ | ✓ | 1682.9 | 1094.4 | 105.5 | 1108.6 | ||||||
| 1800 | 1400 | 900 | ✓ | ✓ | ✓ | ✓ | ✓ | 1709.7 | 1178.4 | 107.4 | 1151.0 | |||||
| 1900 | 1400 | 1000 | ✓ | ✓ | ✓ | ✓ | ✓ | ✓ | 1830.0 | 1254.7 | 119.8 | 1314.3 | ||||
| 1900 | 1400 | 1100 | ✓ | ✓ | ✓ | ✓ | ✓ | ✓ | ✓ | 1805.4 | 1358.7 | 129.3 | 1352.9 | |||
| 1900 | 1400 | 1200 | ✓ | ✓ | ✓ | ✓ | ✓ | ✓ | ✓ | 1891.2 | 1346.2 | 138.9 | 1419.0 | |||
| 2000 | 1400 | 1200 | ✓ | ✓ | ✓ | ✓ | ✓ | ✓ | ✓ | 1967.6 | 1386.4 | 135.0 | 1469.3 | |||
Publisher’s Note: MDPI stays neutral with regard to jurisdictional claims in published maps and institutional affiliations. |
© 2021 by the authors. Licensee MDPI, Basel, Switzerland. This article is an open access article distributed under the terms and conditions of the Creative Commons Attribution (CC BY) license (http://creativecommons.org/licenses/by/4.0/).
Share and Cite
MDPI and ACS Style
Villa, G.; Lozano, S.; Redondo, S. Data Envelopment Analysis Approach to Energy-Saving Projects Selection in an Energy Service Company. Mathematics 2021, 9, 200. https://0-doi-org.brum.beds.ac.uk/10.3390/math9020200
AMA Style
Villa G, Lozano S, Redondo S. Data Envelopment Analysis Approach to Energy-Saving Projects Selection in an Energy Service Company. Mathematics. 2021; 9(2):200. https://0-doi-org.brum.beds.ac.uk/10.3390/math9020200
Chicago/Turabian StyleVilla, Gabriel, Sebastián Lozano, and Sandra Redondo. 2021. "Data Envelopment Analysis Approach to Energy-Saving Projects Selection in an Energy Service Company" Mathematics 9, no. 2: 200. https://0-doi-org.brum.beds.ac.uk/10.3390/math9020200
Note that from the first issue of 2016, this journal uses article numbers instead of page numbers. See further details here.