Article

Development of a Natural Preservative from Chestnut Flowers: Ultrasound-Assisted Extraction Optimization and Functionality Assessment

1
Centro de Investigação de Montanha (CIMO), Instituto Politécnico de Bragança, Campus de Santa Apolónia, 5300-253 Bragança, Portugal
2
Department of Food Processing, Private Higher Polytechnic Institute (ISP2), Free University of Tunis (ULT), 32 Bis Av. Kheireddine Pacha, 1002 Tunis, Tunisia
3
Institute for Biological Research “Siniša Stanković”-National Institute of Republic of Serbia, University of Belgrade, Bulevar despota Stefana 142, 11000 Belgrade, Serbia
4
Nutrition and Bromatology Group, Department of Analytical and Food Chemistry, Faculty of Food Science and Technology, University of Vigo—Ourense Campus, E-32004 Ourense, Spain
*
Authors to whom correspondence should be addressed.
Submission received: 10 April 2021 / Revised: 26 May 2021 / Accepted: 7 June 2021 / Published: 15 June 2021

Abstract

:
This study was carried out with the aim of optimizing the ultrasound-assisted extraction (UAE) of phenolic compounds from male chestnut flowers (C. sativa Mill) to develop a bioactive extract with potential to be used as a natural antioxidant preservative ingredient in the food industry. Time (t, 1–39 min), solvent concentration (S, 0–100%), and ultrasonic power (P, 5–500 W) were used as the independent variables for a 5-level experimental circumscribed central composite design (CCCD) coupled with response surface methodology (RSM) to optimize the extraction of phenolic compounds by UAE. Regarding the variables, the three showed a significant effect on the extraction of phenolic compounds. The content of phenolic compounds (including flavonoids and tannins) and the extraction yield (extract weight gravimetrically assessed) were the response criteria for the optimization. Based on the statistically validated predictive polynomial models, it was possible to reach a maximum content of phenolic compounds at the global optimal conditions of 24 ± 3 min, 259 ± 16 W, and 51 ± 7% ethanol. Additionally, pentagalloyl-glucoside and trigalloyl-hexahydroxydiphenoyl-glucoside were the major phenolic compounds identified. The optimized extract was then analyzed for their biological properties. The bioactive potential of the chestnut flower extract obtained under these optimized conditions was evaluated using in vitro assays for antioxidant, anti-inflammatory, and antimicrobial activity, as well as cytotoxicity and hepatotoxicity tests. The results revealed that the enriched extract has antioxidant, antitumoral, and anti-inflammatory activities without toxicity issues. Overall, this study allowed to define the optimal conditions for the extraction of phenolic compounds from chestnuts male flowers by UAE, to obtain an enriched extract with biological properties that could be further used as a natural antioxidant ingredient with applications on functional foods.

1. Introduction

Several scientific studies have been classifying edible plants as important sources of physiologically active ingredients with beneficial effects capable of acting on human health. Some bioactive compounds present in the composition of these plants, namely, anthocyanins, flavonols, phenolic acids, and vitamins, when isolated or in combined extracts have antioxidant, anti-inflammatory, anticarcinogenic, cardioprotective, and antibacterial properties [1].
In this sense, some authors ensure that these phenolic compounds may be used as potential natural additives. It contributes to increasing the shelf-life of food products as naturally produced antimicrobials and antioxidants [2]. The use of natural additives as a substitute for food synthetic additives is seen as an excellent alternative due to the beneficial health effects associated to these ingredients, which have been linked to the prevention of various chronic diseases [3].
Male chestnut flowers have outstanding bioactive properties that can be combined by the great abundance of phenolic compounds present in their composition [4]. In this sense, its application in the food industry appears as a promising application as a natural ingredient in the preservation of food [4,5] and with functional capacity acting in the health of consumers [6].
As such, mathematical models and optimization methodologies have been recognized to establish the ideal conditions of extraction that contribute to the best response values. In addition, several extraction parameters, such as the solvent, time, and energy, as well as the potential loss of natural compounds, must also be considered [7]. The selection and optimization of the correct extraction conditions are necessary to guarantee an optimal yield for the least time, solvent, and energy used [8].
Therefore, this study intends to optimize the ultrasound assisted extraction (UAE) method for the recovery of a higher yield of natural preservative rich in phenolic compounds from chestnut flowers. Three variables: time (t), solvent (S), and ultrasound power (P) were combined in a RSM system for extraction process optimization followed by identification, quantification of phenolic compounds, and bioactivity evaluation of the optimized extract.

2. Materials and Methods

2.1. Plant Material

Male flowers Castanea sativa Mill. were carefully collected from the soil in an area of the northeast region of Portugal (Samil, Bragança; 41°46′52′′ N, 6°45′54′′ W) during the month of June 2017. Upon receipt at the laboratory, the samples were frozen and lyophilized (FreeZone 4.5, Labconco, Kansas City, MO, USA) and subsequently reduced to a fine powder (20 mesh) that was stored at room temperature (~25 °C), protected from light, until further analysis.

2.2. Optimization of the Extraction Process to Obtain an Extract Rich in Phenolic Compounds, from Male Flowers of Castanea sativa Mill

To optimize the extraction of phenolic compounds from male chestnut flowers, ultrasound-assisted extraction was used, and an experimental design called the circumscribed central composite design (CCCD) was developed (Table 1).
Next, by applying the surface methodology of response (RSM), it is possible to optimize several factors (time, percentage of solvent and applied power) at the same time, and develop 2D and 3D models that together with polynomial equations will attempt to describe the optimal conditions for maximizing the studied response [9].
Individual analysis of the variables was conducted and those with significant impact were selected along with the pertinent intervals. Afterwards, a CCCD of five levels was used to study the effects of the three set variables [10], generating a total of 28 combinations of responses to obtain a greater predictive capacity of the model (Table 1).

2.3. Ultrasound-Assisted Extractions

The extraction procedure was performed as previously described by López et al. [11], using ultrasound probe (sonotrode) equipment (QSonica sonicators, model CL-334, Newtown, CT, USA) and 1.5 g of sample were extracted with 50 mL of solvent. In this case, the variables and their intervals were: time (t, 1 to 39 min), UAE power (P, 50 to 500 W) and ethanol–water extraction solvent (S, 0 to 100%), while the temperature was controlled by the equipment fixed at 30 °C.

2.4. Preparation of Extracts Obtained by Ultrasound-Assisted Extraction

After the procedure of each extraction mentioned above, the samples were centrifuged (5000 rpm; for 20 min at 10 °C) and, to remove suspended solids, they were filtered through filter paper (Whatman no 4). The supernatant was collected and divided into two fractions: one for HPLC-DAD-ESI/MS analysis and the second for determining the extraction yield. The fraction separated for HPLC analysis (2 mL) was filtered through an LC syringe filter (0.22 μm) and then injected; the second fraction, used to determine the extraction yield (5 mL) was subjected to drying at a temperature of 105 °C for 48 h, for subsequent weighing of the solid extract.

2.5. Identification and Quantification of Phenolic Compounds by HPLC-DAD-ESI/MS

The extracts obtained in Section 2.4 were analyzed using a chromatograph system. A Dionex Ultimate 3000 UPLC system (Thermo Scientific, San Jose, CA, USA) an equipped with a quaternary pump, an automatic injector at 5 °C, a degasser, and a column compartment with an automated thermostat was used. The detection of the compounds was carried out with a diode detector (DAD), applying the wavelengths of 280 nm, 330 nm, and 370 nm, coupled to a mass spectrometry (MS) detector. The spectrometer used for the detection of MS was the Linear Ion Trap LTQ XL (ThermoFinnigan, San Jose, CA, USA), equipped with an ESI source (electrospray ionization source). For the compound’s separation a Waters Spherisorb S3 ODS-2 reverse phase C18 column (4.6 × 150 mm, 3 μm) (Milford, CT, USA) was used, thermostated at 35 °C. The mobile phase used was (A) formic acid/water (0.1%) and (B) acetonitrile. The elution gradient established was: 10% to 15% B up to 5 min, 15–20% B up to 5 min, 20–25% B 10 min, 25–35% B 10 min, 35–50% B 10 min and rebalancing the column for 10 min.
Considering UV spectra and retention times, and by comparing with authentic standards the phenolic compounds were identified and quantified considering the calibration curves (concentration range: 2.5–100 μg/mL of standard compounds: ellagic acid (y = 26,719x − 317,255; R2 = 0.999) and quercetin 3-O-glucoside (y = 34,843x − 160,173; R2 = 0.999). The results were expressed as mg of compound detected per g of extracted residue (mg/g R) [12].

2.6. Experimental Design, Modeling, and Optimization

2.6.1. Mathematical Model

The RSM data were fitted by means of least-squares calculation using the following third-order polynomial equation with complex interactive terms of Equation (1):
Y = b 0 + i = 1 n b i X i + i = 1 j > i n 1 j = 2 n b i j X i X j + i = 1 n b i i j j X i 2 X j 2 + i = 1 n b i i i X i 3
where Y defines the response variable (dependent variable) to be modeled, Xi and Xj are the independent variables, b0 is the constant coefficient, bi is the coefficient responsible for describing linear individual effect of each variable, bij is the coefficient that describes the linear interactive effect between two variables, bii the coefficient that describes the quadratic effect of each variable, biijj is the coefficient responsible of the quadratic interactive mechanisms between two variables, biii defines the coefficient responsible of cubic effect of each variable, and n is the number of variables.
Readers must note that the polynomial model used here has a cubic term and interactive effects not only for the linear terms as usually done, but it also has interactive effects in the quadratic terms. All these unusual terms allow the predictive model to be able to fit properly the complex interactions between the three variables here described.
The response (Y) results used to optimize phenolic composition of the extracts were the residue (Yield, g R/g DW), flavonoids content (individual analysis of F1-5 and total of TF, mg/g R) and hydrolysable tannins content (individual analysis of T1-5 and total of TT, mg/g R) according to the CCCD shown in (Table 1).

2.6.2. Procedure for Optimization of Variables

For this purpose, a simplex method able to solve non-linear problems was applied to optimize the model and maximize the response in terms of extraction yield, total flavonoids content, and tannins total content [13]. Some limits to avoid unnatural values or unrealistic physical conditions were imposed to the coded variables (namely, t ≥ 0; 0 ≤ S ≤ 100).

2.6.3. Numerical Methods, Statistical Analysis, and Graphic Illustrations

A previously described procedure was applied to perform coefficient estimates, adjustment procedures, and statistical calculations of the experimental results [14]. First, coefficient significance was assessed with ‘SolverAid’ macro in Microsoft Excel to determine their intervals (α = 0.05). Secondly, parameters adjustment was performed by the application of integrated macro ‘Solver’, to minimize the variances between observed and predicted values using the quasi-Newton algorithm (least-square). Third, the model reliability was demonstrated by different statistical criteria: (a) the models’ adequacy for describing the experimental data was described by Fisher F-test (α = 0.05); (b) the assessment of the parameters and model prediction uncertainties were studied through ‘SolverStat’ macro [15]; and (c) the R² is defines as the proportion of variability of the dependent variable described by the model.

2.7. Bioactivities of the Optimized Extract from Chestnut Male Flower

2.7.1. Extract’s Preparation

The optimized extract of male chestnut flowers was obtained from 1.5 mg of dried powdered flowers extracted with 50 mL of a mixture of water: ethanol (50:50), using the optimal conditions previously established (t = 24 min, P = 258 W). After lyophilization, the samples were stored at room temperature (average 25 °C), protected from light and moisture, until further analysis.

2.7.2. Evaluation of Antioxidant Activity

To evaluate the antioxidant activity, the optimized extract was redissolved in water (2.5 mg/mL) and successively diluted. Then, the procedure described by Hodges et al. [16] to assess inhibition of lipid peroxidation was assessed by decreasing the formation of substances reactive to thiobarbituric acid (TBARS). Additionally, and following the procedure described by Lockowandt et al. [17] to verify the inhibition of oxidative hemolysis (OxHLIA) using red blood cells (RBC) isolated from healthy sheep. For both tests, the Trolox (3.125–125 µg/mL) was used as a positive control and the results presented in values of IC50 (µg/mL).

2.7.3. Evaluation of Anti-Inflammatory Activity

To evaluate the anti-inflammatory activity, lyophilized extract was redissolved in water to a concentration of 8 mg/mL and assessed in the mouse macrophage cell line RAW 264.7 By following the procedure described Svobodova et al. [18]. Dexamethasone was used as a positive control and the results obtained were expressed in EC50 values (μg/mL).

2.7.4. Evaluation of the Cytotoxic and Hepatotoxic Activity

To assess cytotoxicity, the extract was dissolved in water at a concentration of 8 mg/mL. Following the procedure described by Guimarães, et al. [19], four human tumor cell lines were tested: gastric adenocarcinoma (AGS), colorectal adenocarcinoma (CaCo), breast carcinoma (MCF7), non-small cell lung carcinoma (NCI-H460) using the sulforodamine B assay. To assess the hepatotoxic potential, a non-tumor culture of the African green monkey (Vero) was used. Ellipticin was used in both tests as a positive control and the results were presented in GI50 values (μg/mL).

2.7.5. Evaluation of Antimicrobial Activity

To assess the antibacterial potential, the extract was dissolved in 30% ethanol to a concentration of 10 mg/mL and followed a methodology previously described by Soković et al. [20] testing three Gram-negative bacteria: Escherichia coli (ATCC 25922), Salmonella Typhimurium (ATCC 13311) and Enterobacter cloacae (ATCC 35030), and three strains of Gram-positive bacteria: Staphylococcus aureus (ATCC 11632), Bacillus cereus (clinical isolate), Listeria monocytogenes (NCTC 7973).
On the other hand, for the evaluation of antifungal activity, the methodology described by Soković and van Griensven [21] was followed, testing six micromicetes: Aspergillus fumigatus (human isolate), Aspergillus niger (ATCC 6275), Aspergillus versicolor (ATCC 11730), Penicillium funiculosum (ATCC 36839), Penicillium verrucosum var. cyclopium (food isolate), and Trichoderma viride (IAM 5061).
For both tests, sodium sulphite (E221) and potassium metabisulphite (E224) were used as positive controls and the results were expressed as values of minimum inhibitory concentration (MIC), minimum bactericidal concentration (MBC), and minimum fungicidal concentration (MFC). The microorganisms are deposited at Mycological laboratory, Department of Plant Physiology, Institute for biological research “Siniša Stanković” (National Institute of Republic of Serbia, University of Belgrade, Belgrade, Serbia).

3. Results and Discussion

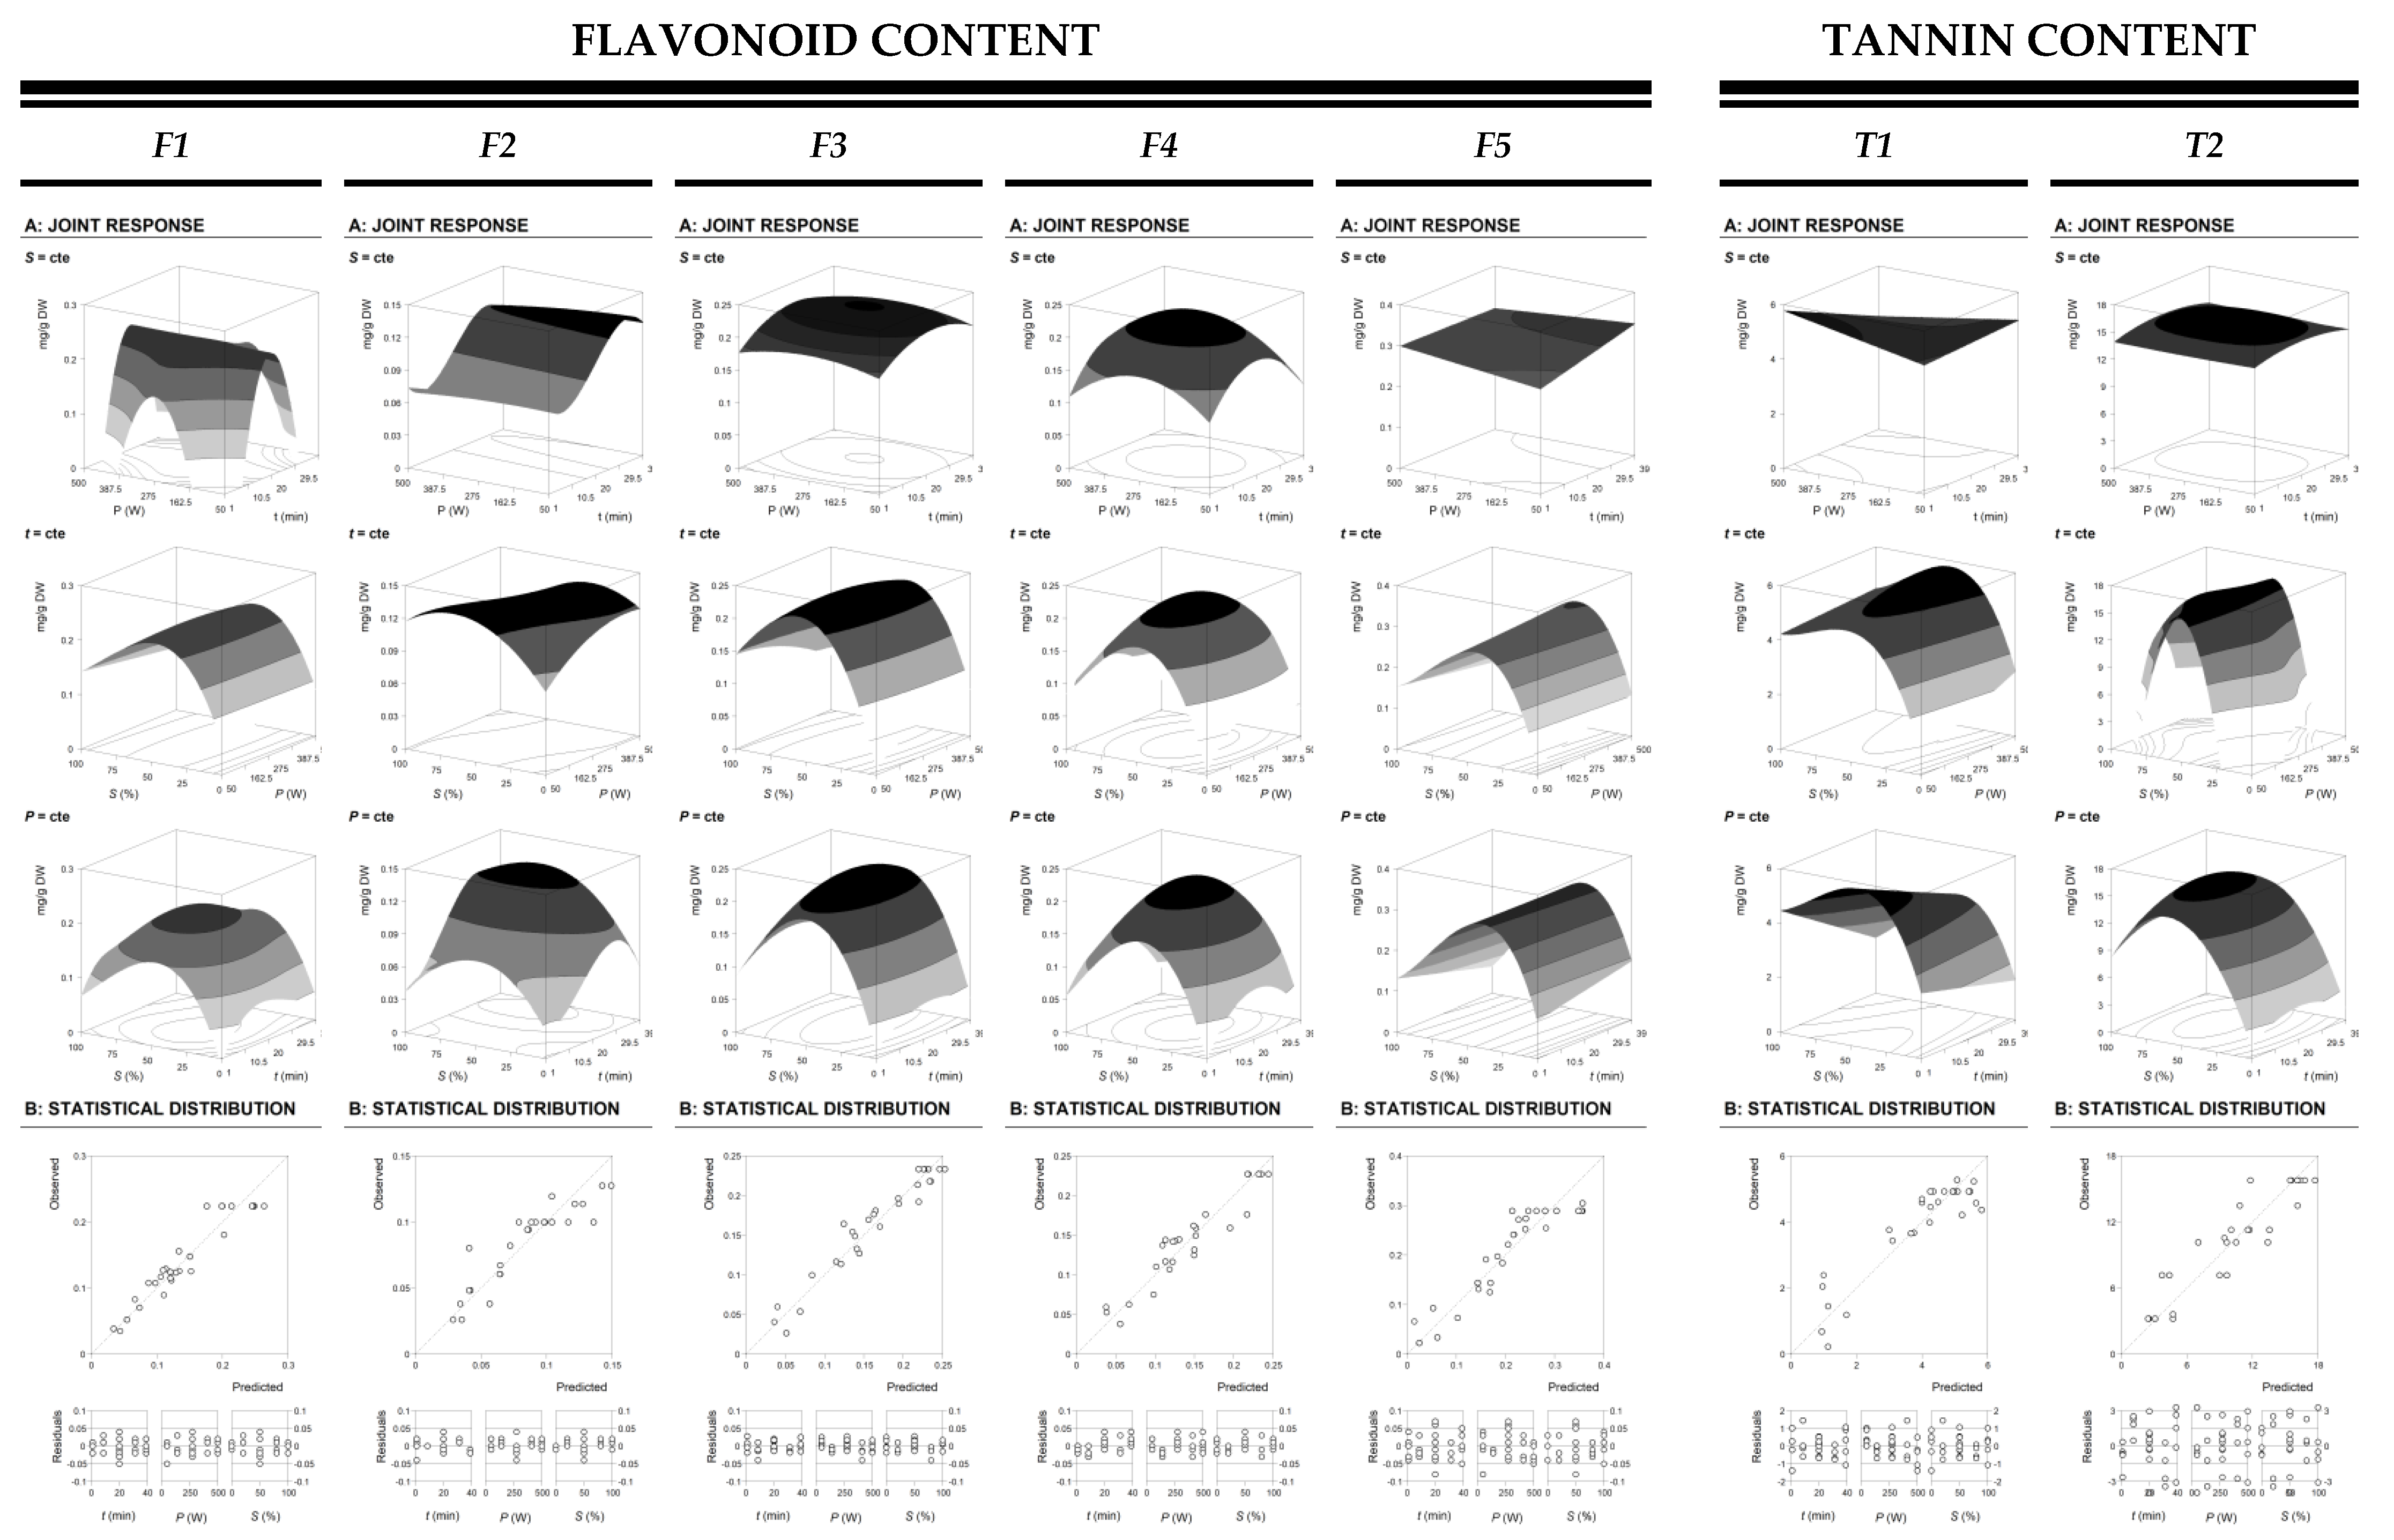
3.1. Theoretical Response Surface Models of the Used Response Criteria for the RSM Analysis and Statistical Verification

Nowadays, there are not studies about the optimal conditions maximizing the extraction of phenolic compounds from the flowers of C. sativa Mill. Moreover, the direct extrapolation of the extraction conditions of phenolic compounds from other studied sources is not correct. Hence, it is necessary to perform independent studies to maximize the extraction of phenolic compounds from C. sativa Mill.
Despite this, there are studies that describe the compounds present in flowers of C. sativa Mill and other sources, and that describe the conditions used for their extraction have been described [22,23], the results from this study may depend on dissimilarities not found in these studies. Therefore, RSM coupled to a CCCD design with five levels of variation for the three independent variables of t (1–39 min), P (50–500 W), and S (0–100%) application could allow to optimize the extraction efficiency of UAE to obtain phenolic compounds from flowers C. sativa Mill. Table 1 shows a thorough compilation of the coded and natural values of the three selected variables in the CCCD design.
Response surface methodology (RSM) is a useful tool to evaluate the effects of multiple variables and their interactions on one or more responses, such as the extraction of phenolic compounds. CCCD is commonly applied in RSM studies since it has been previously applied for the optimization of different food processing methods [24].
In a previous study, relevant compounds were identified in the flowers of C. sativa Mill. by HPLC-DAD-ESI/MS [22,23,25,26]. The phenolic compounds present in the sample were previously identified by the authors and the relevant compounds were the hydrolysable tannins of pentagalloyl-glucoside (T1) and trigalloyl-hexahydroxydiphenoyl (HHDP)-glucoside (T2), and flavonoids like myricetin-3-O-glucoside (F1), quercetin-3-O-glucuronide (F2), quercetin-3-O-glucuronide (F3), quercetin-3-O-glucoside (F4), and kaempferol-3-O-rutinoside (F5) [23]. Considering that the predominant biological activities, such as antioxidant and antimicrobial, are derived from those compounds, the rich extracts could be of interest to the industry sector.
The response results used to optimize phenolic composition of the extracts were the residue (Yield, g R/g DW), flavonoids (individual analysis of F1-5 and total of TF, mg/g R), and hydrolysable tannins content (individual analysis of T1-5 and total of TT, mg/g R) according to the CCCD displayed in Table 1.
Table 2 shows the results of the experimental design for the extraction of phenolic compounds from chestnut flowers as a function of the three selected variables that affect UAE extraction. The experimental values (observed values) obtained under the 28 runs of the five-level CCCD design applied to obtain phenolic compounds from the flowers of C. sativa Mill. are essential to increase the knowledge about target compounds’ concentration in plant materials and to further apply this information at industrial scale, knowing the necessary biomass to extract a certain quantity of target compounds.
Once responses are produced, the next step is to fit the response values (Table 2) to the third-order polynomial model of Equation (1) using a non-linear algorithm. By performing these analytical solutions, researchers can translate the response patterns by mathematical models, simplifying complexity of the possible scenarios.
Table 3 shows the parametric values of the third-order polynomial model of Equation (1) obtained after fitting the extraction response format values and the corresponding statistical information (α = 0.05).
The fitting procedure of Equation (1) applied to the experimental responses was performed using non-linear least-squares estimations and those that were non-significant (ns) values were excluded. These values come from the extrapolation of the response patterns and are basis for the development of mathematical models that could further explain the complexity of the potential scenarios. Those statistically ns parametric values that were excluded did not reveal any substantial improvement when included in the models, according to the statistic lack-of-fit observed when the adequacy of the obtained models used was tested. Table 2 shows a good correlation between the experimental and predicted values and thus, explains observed results. Furthermore, residues were randomly distributed around zero and no grouped data or autocorrelations were observed. Table 3 shows that the obtained coefficients of determination (R2) were higher than 0.81 in all cases, indicating that the independent selected variables can explain the variability of each response. Therefore, the developed models demonstrated their efficacy and were applied in the next predictions and optimization steps. In addition, the sign of the parametric values defines part of the response; when the parametric value is positive, the response is higher at high levels whereas when is negative, the response is lower at the high levels. In both cases, the higher (in absolute terms) of the parametric value, the more significant the weight of the leading variable is.
The variables were decreasingly ordered as a function of its significance in the extraction process as S > P > t. As it can be seen in Table 3, parametric values demonstrated stronger interactions between t × P than between the variables P × S, which were of minor relevance. Those values agree with the application of RSM for optimization purposes. Furthermore, to better visualize and interpret all the combined effects and extraction behavior, results were displayed in the response surface graphs discussed below.

3.2. Effect of the Extraction Variables on the Target Responses

Figure 1 and Figure 2 shows the results of the extraction optimization as function of the combination of the selected variables (t, P, and S). In particular, Figure 1 shows the 3D surface plots of the extraction of the flavonoid individual analysis of F1-5 (mg/g R) and tannin individual analysis of T1-5 (mg/g R). Meanwhile, the optimized extraction yield (g R/g DW) of the total flavonoid content of FT (mg/g R) and total tannin content of TT (mg/g R) is presented on 3D surface plots shown in Figure 2. In this case, the third-order polynomial model of Equation (1) was applied to predict net surfaces using the model equations presented in Table 3. The individual phenolic content (Figure 1) together with the global analysis (Figure 2) allow to understand the behavior of each response and select the optimal conditions from a global perspective, in view of all responses. Furthermore, part B of Figure 1 and Figure 2 represents the statistical agreement of the model, this is the ability to predict the real values considering all the variables for each function, as well as their residual distribution. In fact, the goodness of fit of the model comes from the capability to simulate response changes between the observed and predicted data.
In respect to the residual distribution (Figure 1 and Figure 2), the majority showed more than 90% reliability, thus presenting an optimal fit between experimental and predicted values. Table 3 shows high R2 values in all cases, also validating the percentage of variability explained by the model. However, small differences in the behavior of the extraction variables, both when comparing the flavonoid vs, the tannin content extraction (as individual or global values) may be observed. In both extraction responses, the ethanol concentration was the most significant variable in the terms of extracted compounds, which can be seen from the negative impact of quadratic S in all plots. Additionally, S indicates a saddle point and maximum yield was obtained at ethanol concentrations around 50%. This negative quadratic effect of ethanol concentration could be related to the use of water to improve the extraction rate.
In general, a negative interactive effect between the three variables is observed. In some cases, the use of low energy combined with higher S has been reported to avoid or diminish phenolic compounds degradation. However, in this case dented surfaces to the central values of the three variables show that higher system energies together with ethanol concentrations around 50% could improve flavonoids and tannins solubility and release, which has also been reported in other studies [9,22].
In this study, the three variables showed a significant effect on the extraction of phenolic compounds from the flowers of C. sativa Mill. Regarding the employment of UAE, this technique has been demonstrated to enhance plant tissues’ rupture through cavitation forces at the same time it favors the entry of solvent into cells, thus increasing mass transfer events [27,28].

3.3. Numerical Optimal Conditions That Maximize the Extraction and Experimental Verification of Predictive Models

To obtain the optimum level of the independent variables with attractive response levels numerical optimizations from the experimental results and statistical analysis have been performed. It is necessary to know the degree of similarity between the experimental in the estimated optimal conditions and predicted values to verify the mathematical model used. In this study, the RMS model established a good correlation between these values.
Once the models are validated by statistical analysis (Table 3), then it is possible to obtain the most efficient extraction by the determination of the absolute optimal values of the variable conditions to maximize the responses. The individual and global optimal values for each of the response values assessed the residue (Yield, g R/g DW), flavonoid (individual analysis of F1-5 and total of TF, mg/g R), and tannin content (individual analysis of T1-5 and total of TT, mg/g R), as shown in Table 4. In this table is shown the individual and global optimal variable conditions for each group of compounds extraction and the respective amounts of the extracted compounds. For the individual response, optimal variable conditions of 39.00 ± 3.74 min, 446.34 ± 21.13 W and 58.08 ± 7.62% of ethanol were found to produce a maximum yield of the extracted residue of 0.18 ± 0.04 g R/g DW.
  • Regarding flavonoids, individual variable conditions were found for F1 at 17.64 ± 2.59 min, 291.45 ± 17.07 W and 43.28 ± 6.58% of ethanol, producing maximum response values of 0.23 ± 0.13 mg F1/g R. For F2, variable conditions at 33.06 ± 3.46 min, 50.00 ± 7.07 W and 65.80 ± 8.11% of ethanol were found to produce a maximum response values of 0.13 ± 0.04 mg F2/g R. In the case of F3, variable conditions were found at 23.37 ± 2.94 min, 275.00 ± 16.58 W and 50.00 ± 7.07% of ethanol, producing a maximum response values of 0.23 ± 0.05 mg F3/g R. Variable conditions at 20.11 ± 2.75 min, 279.01 ± 16.70 W and 45.20 ± 6.72% of ethanol were found to produce a maximum response values of 0.23 ± 0.05 mg F4/g R in the case of F4. Variable conditions were found for F5 at 9.31 ± 1.96 min, 500.00 ± 22.36 W and 46.12 ± 6.79% of ethanol for F5, producing maximum response values of 0.30 ± 0.05 mg F5/g R. At last, for total flavonoids, individual variable conditions at 23.92 ± 2.97 min, 289.36 ± 17.01 W and 44.18 ± 6.65% of ethanol were found to produce maximum response values of 1.12 ± 0.08 mg FT/g R.
  • In respect to tannins, individual variable conditions were found at 1.00 ± 0.24 min. 500.00 ± 22.36 W and 46.31 ± 6.81% of ethanol, producing maximum response values of 5.78 ± 0.39 mg T1/g R for T1 whereas individual variable conditions at 20.00 ± 2.74 min, 275.00 ± 16.58 W and 59.96 ± 7.74% of ethanol were found to produce maximum response values of 16.13 ± 0.90 mg in the case of T2/g R. Finally, for total tannins content, 8.52 ± 1.89 min, 500.00 ± 22.36 W and 52.71 ± 7.26% of ethanol were the individual variable conditions found to be able to produce a maximum response values of 23.35 ± 0.47 mg TT/g R.
  • Regarding the relative optimal response values for flavonoid content, the global optimal variable conditions were found at 26.32 ± 3.07 min, 285.57 ± 16.90 W and 44.80 ± 6.69% of ethanol, achieving maximum response values of 0.21 ± 0.06 mg F1/g E, 0.12 ± 0.04 mg F2/g R, 0.23 ± 0.08 mg F3/g R, 0.22 ± 0.07 mg F4/g R, 0.30 ± 0.05 mg F5/g R, respectively, from F1 to F5 compounds. In the case of tannins under optimal response values for flavonoid content, their maximum response values were 4.79 ± 0.19 mg T1 /g R and 15.12 ± 1.89 mg T2/g R, respectively, for each tannin. Focusing on the yield of the extracted residue, it was lower than in the case of optimizing individual variables, but still reaches 0.13 ± 0.07 g R/g DW.
  • In respect to the relative optimal response values for tannin content, global optimal variable conditions at 11.44 ± 2.03 min, 500.00 ± 22.39 W and 51.22 ± 7.16% of ethanol were found to produce maximum response levels of 5.35 ± 0.31 mg T1/g R and 15.23 ± 0.90 mg T2/g R, respectively. In the case of flavonoids, responses values ranged from 0.07 ± 0.01 mg F1/g R, 0.07 ± 0.02 mg F2/g R, 0.20 ± 0.05 mg F3/g R, 0.16 ± 0.03 mg F4/g R, and 0.29 ± 0.04 mg F5/g R. Furthermore, the maximum yield obtained at these fixed conditions was 0.15 g R/g DW.
  • At the end, the global optimal variable conditions for the optimization of both, flavonoids and tannins content and also yield, were found at 23.47 ± 2.90 min, 258.78 ± 16.09 W and 50.51 ± 7.11% of ethanol, thus producing the following maximum response values: 0.13 ± 0.07 g R/ g DW, 0.22 ± 0.07 mg F1/g R, 0.11 ± 0.03 mg F2/g R, 0.23 ± 0.08 mg F3/g R, 0.23 ± 0.07 mg F4/g R, 0.29 ± 0.04 mg F5/g R, 4.88 ± 0.21 mg T1/g R, and 15.77 ± 0.97 mg T2/g R.
Although the parametric values show the responses and can be used to understand the patterns of the responses, to obtain 3D surface or contour plots, in each case two variables within the experimental range are fixed while the other two variables vary among the different levels. This is the best approach to express the impacts of any independent variable on the extraction of the different studied responses. In this sense, 3D surface and contour plots give graphical support to explain the influence of the different selected UAE parameters on the extraction yield (g R/g DW), and the phenolic compounds of total flavonoid content of FT (mg/g R) and total tannin content of TT (mg/g R) from chestnut flowers as a function of the three main DW variables involved (X1, X2, and X3) are shown in Figure 3.
The plots enable to visualize the influence and interaction between the variables. Table 3 described the visual analysis of 3D surface and contour plots that are in accordance with parametric values derived from the multiple regression analysis.
Regarding individual conditions, the ideal solvent concentration ranged between 40% and 65% in all cases, energy applied varied in almost all scenarios from 250 to 500 W whereas time reached up to a maximum of 39 min. Considering both the individual and the global values for each group of compounds (flavonoids and tannins) and yield, the largest amounts of extracted total phenolic compounds were obtained with the global optimal conditions of 23.47 ± 2.90 min, 258.78 ± 16.09 W and 50.51 ± 7.11% of ethanol by the application of UAE technique. Optimal obtained conditions values proposed by the experimental design were the central values of time, energy, and solvent. The results obtained coincide with similar conclusions of previously studies [29], in which UAE consumed less energy and time at the same time it provided higher extraction values and purity was increased [7,30,31].
UAE is a modern green alternative for plant-based chemistry applications that has shown to be an economically viable alternative to conventional techniques. The main benefits of applying this technique are the reduction in time, energy, and solvents used, and, consequently, industrial emissions [7], which is also in agreements with the pillars of “green” chemistry. According to the obtained results, the process can be performed in short times (10–20 min) and high reproducibility, less manipulation and work, thus diminishing the necessity of further treatments and obtaining extracts of higher [7].

3.4. Evaluation of Bioactivities of Chestnut Flowers Optimized Extract

3.4.1. Antioxidant Activity

The antioxidant activity of the optimized extract obtained from chestnut flowers was evaluated using the two in vitro assays of OxHLIA and TBARS, which indicate the extract concentration needed to protect 50% of the erythrocyte population from the hemolytic action caused by the oxidizing agent AAPH for Δt of 60 and 80 min, or to provide 50% of antioxidant activity, respectively. The results obtained with these assays are presented in Table 5. The optimized extract showed an outstanding capacity to inhibit lipid peroxidation and antihemolytic activity, translated by low IC50 values (lower than that of the trolox in TBARS), which is in line with what has been described in the literature in studies carried out with the same plant matrix. Therefore, the preservation of food products from spoilage and deterioration can be achieved by adding the natural ingredient rich in phenolic compounds developed in this study.
Several authors have described chestnut flowers as interesting sources of polyphenolic antioxidants with a high capacity to eliminate free radicals and other reactive species, being associated with protective effects against different diseases, namely coronary heart disease [32], cancer [33], neurodegenerative diseases [34], and osteoporosis [35]. The antioxidant potential of extracts from different parts of C. sativa, namely flowers, leaves, barks, and fruits, was previously reported by [36].
Due to the powerful antioxidant potential described for C. sativa flowers, some authors have already tested the effectiveness of incorporation their extract in food products. Previous researchers have incorporated the extract in traditional Portuguese food products, namely in “Serra da Estrela” cheese and “pastel de nata” cake [6,23]. The results obtained by both authors demonstrated that the functionalized products showed higher antioxidant activity, when compared to the control samples formulated without extract.

3.4.2. Anti-Inflammatory and Cytotoxic Properties in Cell Lines

The optimized extract was tested for cytotoxicity in human tumor cell lines or in a non-tumor culture, the results being shown in Table 5. The results are very satisfactory for all cell lines tested, highlighting greater efficacy against colorectal adenocarcinoma (CaCo) followed by gastric adenocarcinoma (AGS), with lower GI50 values. The anti-inflammatory properties of the optimized extract were also evaluated, and the result shown in Table 5.
Carocho et al. [4] carried out a study on the bioactivities of flower extracts of C. sativa obtained from infusions and decoctions. The extracts were tested for four human tumor cell lines: breast adenocarcinoma (CF7), colon carcinoma (HCT15), cervical carcinoma (HeLa), and hepatocellular carcinoma (HepG2) with HepG2 and HCT15 being the most sensitive cell lines. The literature has attributed the antitumor activity observed in the extracts of C. sativa to the presence of phenolic compounds present in its composition namely, trigalloyl-HHDP-glucoside and pentagalloyl glucoside which has shown antitumor activity in vitro [37].

3.4.3. Antimicrobial Activity

The extract of chestnut flowers obtained by the optimized conditions, was tested for its antibacterial properties (against a panel of three Gram-negative bacteria strains and three Gram-positive bacteria strains) and antifungal (testing six micromycetes) and the results obtained are presented in Table 5. The optimized extract of C. sativa showed an efficiency equal to or greater than the food additives tested in relation to all the tested bacteria. The same was true for the fungi tested, except for A. fumigatus, for which the extract did not perform as well as food additives. Thus, the results obtained are very favorable, showing an excellent antimicrobial performance of the extract.
In a study developed by Sanches-Silva et al. [38], extracts obtained from different C. sativa bio-residues demonstrated antibacterial potential against Gram-positive and Gram-negative bacteria, with only inefficiency against the growth of E. coli and S. enteritidis. Additionally, Carocho et al. [4] presented interesting results that prove the excellent antimicrobial behavior of aqueous extracts of chestnut flowers against different microorganisms presenting MIC values that are quite low, even in some cases lower than the antibiotics used as positive controls. The excellent results of MIC’s have been related to the high amount of trigalloyl-HHDP-glucoside and quercetin-3-O-glucuronide, as well as the large number of organic acids and excellent antioxidant results demonstrated by this matrix.

4. Conclusions

Non-conventional technologies (such as the UAE) have attracted the attention of different industries to recover compounds of plant materials since they are advantageous from an environmental and economic point of view in relation to conventional methodologies. However, to take full advantage of technological advances, extraction conditions need to be optimized with precision, otherwise the efficiency and consequent profitability of the process may not be achieved. In this work, a new fast method to extract phenolic compounds from flowers of C. sativa Mill. is proposed. RSM and other mathematical strategies have been successfully employed to optimize extraction conditions that maximize the recovery of phenolic compounds to produce a rich extract with potential industrial application as a natural antioxidant additive. In the present study, the variables were decreasingly ordered as a function of its significance in the extraction process as S > P > t. In addition, relative optimal conditions for total flavonoids and tannins were obtained but the global approach showed that an extract with the maximum content of flavonoids and tannins will be obtained under the following global conditions: 24 ± 3 min, 259 ± 16 W and 51 ± 7% ethanol. Under these values, the optimized extract showed evidence of its antioxidant, antimicrobial and anti-inflammatory properties due to its content in phenolic compounds. As such, the obtained data suggest that the male flowers of C. sativa can be explored by the food industry as a natural ingredient, but also by the pharmaceutical and cosmetic industries and thus creating added economic and environmental value.

Author Contributions

Conceptualization, C.C., I.C.F.R.F. and L.B.; Formal analysis, I.b.A., E.P., M.I.D., J.P., R.C.C., M.S., M.K., M.A.P. and C.C.; Investigation, I.b.A. and E.P.; Methodology, E.P., M.I.D., J.P., C.C. and L.B.; Resources, L.B.; Supervision, F.E., C.C. and L.B.; Writing—original draft, I.b.A., E.P., M.I.D., J.P., M.A.P. and C.C.; Writing—review and editing, M.S., F.E., I.C.F.R.F. and L.B. All authors have read and agreed to the published version of the manuscript.

Funding

This work is funded by the European Regional Development Fund (ERDF) through the Regional Operational Program North 2020, within the scope of Project GreenHealth—Digital strategies in biological assets to improve well-being and promote green health, Norte-01-0145-FEDER-000042. This work was also conducted under the project “BIOMA—Bioeconomy integrated solutions for the mobilization of the Agro-food market” (POCI-01-0247-FEDER-046112), by “BIOMA” Consortium, and financed by European Regional Development Fund (ERDF), through the Incentive System to Research and Technological development, within the Portugal2020 Competitiveness and Internationalization Operational Program. The authors are also grateful to FEDER-Interreg España-Portugal programme for financial support through the project TRANSCoLAB 0612_TRANS_CO_LAB_2_P. This work has been supported by the Ministry of Education, Science and Technological Development of Republic of Serbia (451-03-9/2021-14/200007).

Institutional Review Board Statement

Not applicable.

Informed Consent Statement

Not applicable.

Data Availability Statement

Not applicable.

Acknowledgments

The authors are grateful to the Foundation for Science and Technology (FCT, Portugal) for financial support by national funds FCT/MCTES to CIMO (UIDB/00690/2020). M.I. Dias, R.C. Calhelha and L. Barros would like to thank the national funding by FCT, P.I., through the institutional scientific employment program-contract. J. Pinela also thanks FCT for his contract (CEECIND/01011/2018) under the individual scientific employment program-contract. The research leading to these results was supported by MICINN supporting the Ramón and Cajal grant for M.A. Prieto (RYC-2017-22891) and by Xunta de Galicia supporting the post-doctoral grant of M. Fraga-Corral (ED481B-2019/096) and the program EXCELENCIA-ED431F 2020/12. To the project AllNat for the contract of C. Caleja (Project AllNat POCI-01-0145-FEDER-030463) and to the Project Mobilizador Norte-01-0247-FEDER-024479: ValorNatural® for the contract of E. Pereira.

Conflicts of Interest

The authors declare no conflict of interest.

References

  1. Socaci, S.A.; Fărcaş, A.C.; Tofană, M. Functional ingredients derived from aromatic plants. Feed Addit. 2020, 133–146. [Google Scholar] [CrossRef]
  2. Munekata, P.E.; Pateiro, M.; Bellucci, E.R.B.; Domínguez, R.; Barretto, A.C.D.S.; Lorenzo, J.M. Strategies to increase the shelf life of meat and meat products with phenolic compounds. Mar. Med. Foods Implic. Appl. Anim. Microbes 2021. [Google Scholar] [CrossRef]
  3. Foo, J.; Michor, F. Evolution of resistance to anti-cancer therapy during general dosing schedules. J. Theor. Biol. 2010, 263, 179–188. [Google Scholar] [CrossRef] [PubMed] [Green Version]
  4. Carocho, M.; Barros, L.; Bento, A.; Santos-Buelga, C.; Morales, P.; Ferreira, I.C.F.R. Castanea sativa mill. Flowers amongst the Most Powerful Antioxidant Matrices: A Phytochemical Approach in Decoctions and Infusions. BioMed Res. Int. 2014, 2014, 1–7. [Google Scholar] [CrossRef] [PubMed] [Green Version]
  5. Caleja, C.; Barros, L.; Prieto, M.A.; Bento, A.; Oliveira, M.B.P.P.; Ferreira, I.C.F.R. Development of a natural preservative obtained from male chestnut flowers: Optimization of a heat-assisted extraction technique. Food Funct. 2019, 10, 1352–1363. [Google Scholar] [CrossRef]
  6. Carocho, M.; Barreira, J.C.; Barros, L.; Bento, A.; Cámara, M.; Morales, P.; Ferreira, I.C. Traditional pastry with chestnut flowers as natural ingredients: An approach of the effects on nutritional value and chemical composition. J. Food Compos. Anal. 2015, 44, 93–101. [Google Scholar] [CrossRef] [Green Version]
  7. Chemat, F.; Rombaut, N.; Sicaire, A.G.; Meullemiestre, A.; Fabiano-Tixier, A.S.; Abert-Vian, M. Ultrasound assisted extrac-tion of food and natural products. Mechanisms, techniques, combinations, protocols and applications. A review. Ultrason. Sonochem. 2017, 34, 540–560. [Google Scholar] [CrossRef] [PubMed]
  8. Diouf, P.N.; Stevanovic, T.; Boutin, Y. The effect of extraction process on polyphenol content, triterpene composition and bioactivity of yellow birch (Betula alleghaniensis Britton) extracts. Ind. Crop. Prod. 2009, 30, 297–303. [Google Scholar] [CrossRef]
  9. Chavan, Y.; Singhal, R.S. Ultrasound-assisted extraction (UAE) of bioactives from arecanut (Areca catechu L.) and optimization study using response surface methodology. Innov. Food Sci. Emerg. Technol. 2013, 17, 106–113. [Google Scholar] [CrossRef]
  10. Mandpe, S.R.; Parate, V.R.; Naik, J.B. Method optimization and analysis of flurbiprofen loaded Eudragit L100 nanoparticles using RP-HPLC technique: A central composite design approach. Mater. Today Proc. 2021, 1–10. [Google Scholar] [CrossRef]
  11. López, C.J.; Caleja, C.; Prieto, M.A.; Barreiro, M.F.; Barros, L.; Ferreira, I.C. Optimization and comparison of heat and ultrasound assisted extraction techniques to obtain anthocyanin compounds from Arbutus unedo L. Fruits. Food Chem. 2018, 264, 81–91. [Google Scholar] [CrossRef] [Green Version]
  12. Bessada, S.M.; Barreira, J.C.; Barros, L.; Ferreira, I.C.; Oliveira, M.B.P. Phenolic profile and antioxidant activity of Coleostephus myconis (L.) Rchb.f.: An underexploited and highly disseminated species. Ind. Crop. Prod. 2016, 89, 45–51. [Google Scholar] [CrossRef] [Green Version]
  13. Vieira, V.; Prieto, M.A.; Barros, L.; Coutinho, J.A.P.; Ferreira, O.; Ferreira, I.C.F.R. Optimization and comparison of macera-tion and microwave extraction systems for the production of phenolic compounds from Juglans regia L. for the valorization of walnut leaves. Ind. Crop. Prod. 2017, 107, 341–352. [Google Scholar] [CrossRef] [Green Version]
  14. Prieto, M.; Vázquez, J.; Murado, M. A new mathematical model to quantify and characterize the response to pro- and anti-oxidants of the copper-induced oxidation of LDL assay. A tool for examination of potential preventive compounds and clinical risk prediction. Food Res. Int. 2014, 66, 501–513. [Google Scholar] [CrossRef] [Green Version]
  15. Murado, M.A.; Prieto, M.A. Dose-Response Analysis in the Joint Action of Two Effectors. A New Approach to Simulation, Identification and Modelling of Some Basic Interactions. PLoS ONE 2013, 8. [Google Scholar] [CrossRef] [Green Version]
  16. Hodges, D.M.; Delong, J.M.; Forney, C.F.; Prange, R.K. Improving the thiobarbituric acid-reactive-substances assay for estimating lipid peroxidation in plant tissues containing anthocyanin and other interfering compounds. Planta 1999, 207, 604–611. [Google Scholar] [CrossRef]
  17. Lockowandt, L.; Pinela, J.; Roriz, C.L.; Pereira, C.; Abreu, R.M.; Calhelha, R.C.; Alves, M.J.; Barros, L.; Bredol, M.; Ferreira, I.C. Chemical features and bioactivities of cornflower (Centaurea cyanus L.) capitula: The blue flowers and the unexplored non-edible part. Ind. Crop. Prod. 2019, 128, 496–503. [Google Scholar] [CrossRef] [Green Version]
  18. Svobodova, B.; Barros, L.; Sopik, T.; Calhelha, R.C.; Heleno, S.; Alves, M.J.; Walcott, S.; Kuban, V.; Ferreira, I.C.F.R. Non-edible parts of Solanum stramoniifolium Jacq.—A new potent source of bioactive extracts rich in phenolic compounds for functional foods. Food Funct. 2017, 8, 2013–2021. [Google Scholar] [CrossRef] [Green Version]
  19. Guimarães, R.; Calhelha, R.C.; Froufe, H.J.C.; Abreu, R.M.V.; Carvalho, A.M.; João, R.P.Q.M.; Ferreira, I.C.F.R. Wild Roman chamomile extracts and phenolic compounds: Enzymatic assays and molecular modelling studies with VEGFR-2 tyrosine kinase. Food Funct. 2015, 7, 79–83. [Google Scholar] [CrossRef] [PubMed] [Green Version]
  20. Soković, M.; Glamoćlija, J.; Marin, M.D.; Brkić, D.; van Griensven, L.J.L.D. Antibacterial effects of the essential oils of com-monly consumed medicinal herbs using an in vitro model. Molecules 2010, 15, 7532–7546. [Google Scholar] [CrossRef] [Green Version]
  21. Soković, M.; van Griensven, L.J.L.D. Antimicrobial activity of essential oils and their components against the three major pathogens of the cultivated button mushroom, Agaricus bisporus. Eur. J. Plant Pathol. 2006, 116, 211–224. [Google Scholar] [CrossRef]
  22. Pinela, J.; Prieto, M.A.; Carvalho, A.M.; Barreiro, M.F.; Oliveira, M.B.P.; Barros, L.; Ferreira, I.C. Microwave-assisted extraction of phenolic acids and flavonoids and production of antioxidant ingredients from tomato: A nutraceutical-oriented optimization study. Sep. Purif. Technol. 2016, 164, 114–124. [Google Scholar] [CrossRef] [Green Version]
  23. Caleja, C.; Barros, L.; Barreira, J.C.M.; Soković, M.; Calhelha, R.C.; Bento, A.; Oliveira, M.B.P.P.; Ferreira, I.C.F.R. Castanea sativa male flower extracts as an alternative additive in the Portuguese pastry delicacy “pastel de nata”. Food Funct. 2020, 11, 2208–2217. [Google Scholar] [CrossRef] [PubMed]
  24. Bezerra, M.A.; Santelli, R.E.; Oliveira, E.P.; Villar, L.S.; Escaleira, E.A.; Escaleira, L.A. Response surface methodology (RSM) as a tool for optimization in analytical chemistry. Talanta 2008, 76, 965–977. [Google Scholar] [CrossRef] [PubMed]
  25. Dias, M.I.; Ferreira, I.C.F.R.; Barreiro, M.F. Microencapsulation of bioactives for food applications. Food Funct. 2015, 6, 1035–1052. [Google Scholar] [CrossRef] [PubMed] [Green Version]
  26. Echegaray, N.; Gómez, B.; Barba, F.J.; Franco, D.; Estévez, M.; Carballo, J.; Marszałek, K.; Lorenzo, J.M. Chestnuts and by-products as source of natural antioxidants in meat and meat products: A review. Trends Food Sci. Technol. 2018, 82, 110–121. [Google Scholar] [CrossRef]
  27. Antonio, A.L.; Pereira, E.; Pinela, J.; Heleno, S.A.; Pereira, C.; Ferreira, I.C. Determination of Antioxidant Compounds in Foodstuff. In Food Safety: Innovative Analytical Tools for Safety Assessment; John Wiley & Sons, Inc.: Hoboken, NJ, USA, 2016; pp. 179–220. [Google Scholar]
  28. Misra, N.N.; Martynenko, A.; Chemat, F.; Paniwnyk, L.; Barba, F.J.; Jambrak, A.R. Thermodynamics, transport phenomena, and electrochemistry of external field-assisted nonthermal food technologies. Crit. Rev. Food Sci. Nutr. 2018, 58, 1832–1863. [Google Scholar] [CrossRef] [Green Version]
  29. Tomšik, A.; Pavlić, B.; Vladić, J.; Ramić, M.; Brindza, J.; Vidović, S. Optimization of ultrasound-assisted extraction of bioac-tive compounds from wild garlic (Allium ursinum L.). J. Food Sci. Technol. 2020, 57, 4627–4636. [Google Scholar]
  30. Montesano, D.; Fallarino, F.; Cossignani, L.; Bosi, A.; Simonetti, M.S.; Puccetti, P.; Damiani, P. Innovative extraction proce-dure for obtaining high pure lycopene from tomato. Eur. Food Res. Technol. 2008, 226, 327–335. [Google Scholar] [CrossRef]
  31. Zhu, Z.; He, J.; Liu, G.; Barba, F.J.; Koubaa, M.; Ding, L.; Bals, O.; Grimi, N.; Vorobiev, E. Recent insights for the green reco-very of inulin from plant food materials using non-conventional extraction technologies: A review. Innov. Food Sci. Emerg. Technol. 2016, 33, 1–9. [Google Scholar] [CrossRef]
  32. Engler, M.B.; Engler, M.M. The Emerging Role of Flavonoid-Rich Cocoa and Chocolate in Cardiovascular Health and Disease. Nutr. Rev. 2006, 64, 109–118. [Google Scholar] [CrossRef] [PubMed]
  33. Nichenametla, S.N.; Taruscio, T.G.; Barney, D.L.; Exon, J.H. A Review of the Effects and Mechanisms of Polyphenolics in Cancer. Crit. Rev. Food Sci. Nutr. 2006, 46, 161–183. [Google Scholar] [CrossRef] [PubMed]
  34. Lau, F.C.; Shukitt-Hale, B.; Joseph, J.A. The beneficial effects of fruit polyphenols on brain aging. Neurobiol. Aging 2005, 26, 128–132. [Google Scholar] [CrossRef] [PubMed]
  35. Weaver, C.M.; Cheong, J.M.K. Soy Isoflavones and Bone Health: The Relationship Is Still Unclear. J. Nutr. 2005, 135, 1243–1247. [Google Scholar] [CrossRef] [Green Version]
  36. Barreira, J.C.; Ferreira, I.C.; Oliveira, M.B.P.; Pereira, J.A. Antioxidant activity and bioactive compounds of ten Portuguese regional and commercial almond cultivars. Food Chem. Toxicol. 2008, 46, 2230–2235. [Google Scholar] [CrossRef] [PubMed]
  37. Zhang, J.; Li, L.; Kim, S.H.; Hagerman, A.E.; Lü, J. Anti-cancer, anti-diabetic and other pharmacologic and biological activities of penta-galloyl-glucose. Pharm. Res. 2009, 26, 2066–2080. [Google Scholar] [CrossRef] [Green Version]
  38. Sanches-Silva, A.; Testai, L.; Nabavi, S.F.; Battino, M.; Devi, K.P.; Tejada, S.; Sureda, A.; Xu, S.; Yousefi, B.; Majidinia, M.; et al. Therapeutic potential of polyphenols in cardiovascular diseases: Regulation of mTOR signaling pathway. Pharmacol. Res. 2020, 152. [Google Scholar] [CrossRef] [PubMed]
Figure 1. Graphical results of phenolic compounds from chestnut flowers as a function of the three main variables involved (X1, X2, and X3) for the flavonoid individual analysis content of F1-5 (mg/g R) and tannin individual analysis content of T1-5 (mg/g R). Each figure is divided in two parts. Part A: Shows the graphical analysis by net surfaces that represents the 3D response surface predicted with the third order polynomial of Equation (1). The binary actions between variables are presented when the excluded variable is positioned at the individual optimum (Table 4). The statistical design and results are described in Table 1. Part B: To illustrate the goodness of fit, two basic graphical statistic criteria are used. The first one, the ability to simulate the changes of the response between the predicted and observed data; and the second one, the residual distribution as a function of each of the variables.
Chemosensors 09 00141 g001
Figure 2. Graphical results of phenolic compounds from chestnut flowers as a function of the three main variables involved (X1, X2, and X3) for the yield (g R/g DW), total flavonoid content of FT (mg/g R) and total tannin content of TT (mg/g R). Each figure is divided in two parts. Each figure is divided in two parts. Part A: Shows the graphical analysis by net surfaces that represents the 3D response surface predicted with the second order polynomial of Equation (1). The binary actions between variables are presented when the excluded variable is positioned at the individual optimum (Table 4). Part B: To illustrate the goodness of fit, two basic graphical statistic criteria are used. The first one, the ability to simulate the changes of the response between the predicted and observed data; and the second one, the residual distribution as a function of each of the variables.
Chemosensors 09 00141 g002
Figure 3. Part (A): Optimized isolines projections of the yield of extraction (g R/g DW) and the phenolic compounds of total flavonoid content of FT (mg/g R) and total tannin content of TT (mg/g R) from chestnut flowers as a function of the three main variables involved (X1, X2, and X3). The figures describe visually the tendencies of each response and guide the selection of the most favorable conditions, considering simultaneously all responses. Each of the contour graphs represents the projection in XY plane of the theoretical three-dimensional response surface predicted with the second order polynomial of Equation (1). The binary actions between variables are presented when the excluded variable is positioned at the individual optimum (Table 4). The statistical design and experimental results are described in Table 2. Estimated parametric values used are shown in Table 3. Part (B): Final summary of all variables assessed. Shows the individual 2D responses of all studied responses as a function of all the variables assessed. The variables in each of the 2D graphs were positioned at the individual optimal values of the others (Table 4). The dots (ʘ) presented alongside each line highlight the location of the optimum value. Lines and dots are generated by the respective theoretical second order polynomial derived from Equation (1).
Chemosensors 09 00141 g003
Table 1. Experimental domain and codification of independent variables in the CCCD factorial design with 5 range levels.
CODED VALUESNATURAL VALUES
t (min)P (W)S (%)
−1.681.050.00.0
−18.7141.220.3
020.0275.050.0
+131.3408.879.7
+1.6839.0500.0100.0
Table 2. Experimental design for the extraction of phenolic compounds from chestnut flowers. Experimental RSM results of the CCCD for the optimization of the three main variables involved (X1, X2, and X3) in the UAE for the residue (Yield, g R/g DW), flavonoid (individual analysis of F1-5 and total of TF, mg/g R) and tannin content (individual analysis of T1-5 and total of TT, mg/g R).
EXPERIMENTAL DESIGN VALUESRESIDUEFLAVONOID CONTENTTANNIN CONTENT
CODED NATURALINDIVIDUALTOTALINDIVIDUALTOTAL
X1X2X3X1: tX2: PX3: SYieldF1F2F3F4F5FtT1T2Tt
minW%g R/g DWmg/g Rmg/g Rmg/g Rmg/g Rmg/g Rmg/g Rmg/g Rmg/g Rmg/g R
1−1−1−18.7141.220.30.100.150.060.140.130.210.693.679.6713.34
21−1−131.3141.220.30.100.090.120.140.120.220.683.103.736.83
3−11−18.7408.820.30.120.110.060.170.150.280.785.829.0014.82
411−131.3408.820.30.120.130.140.160.150.230.823.004.417.41
5−1−118.7141.279.70.110.110.060.160.110.180.634.4911.7516.24
61−1131.3141.279.70.100.100.150.190.130.220.794.0010.0614.06
7−1118.7408.879.70.170.130.060.120.110.160.594.0013.5717.57
811131.3408.879.70.160.110.130.160.150.190.743.7511.5715.32
900−1.682027500.110.120.070.140.120.170.634.249.4313.67
10001.68202751000.100.070.070.070.100.100.421.704.746.44
110−1.6802050500.110.180.090.230.160.210.884.9411.8216.76
1201.68020500500.160.250.120.240.220.261.085.4218.7324.15
13−1.68001275500.100.130.040.220.150.240.795.0710.8515.92
141.680039275500.150.200.100.220.200.361.085.6416.1321.77
15−1.68−1.68−1.6815000.040.030.030.040.040.020.160.952.463.41
161.68−1.68−1.68395000.060.050.040.050.060.060.261.143.094.23
17−1.681.68−1.68150000.040.040.030.040.040.050.211.002.533.53
181.681.68−1.683950000.130.110.090.110.120.140.571.144.745.88
19−1.68−1.681.681501000.080.120.060.140.110.170.605.229.6514.87
201.68−1.681.6839501000.110.150.090.190.150.240.825.5813.4219.00
21−1.681.681.6815001000.080.120.040.120.100.150.524.2610.5014.76
221.681.681.68395001000.130.070.040.080.070.010.270.977.058.02
2300020275500.140.200.080.220.240.351.095.4615.5621.02
2400020275500.150.200.100.230.220.361.104.2516.8021.05
2500020275500.120.250.100.250.220.351.165.0816.3521.43
2600020275500.140.210.100.250.230.301.114.3415.4619.81
2700020275500.140.250.090.230.220.251.034.6816.1020.78
2800020275500.140.260.140.230.240.281.154.9615.4720.43
Table 3. Parametric results of the third-order polynomial equation of Equation (1) in terms of the extraction behavior for the residue (Yield, g R/g DW), flavonoid (individual analysis of F1-5 and total of TF, mg/g R), and tannin content (individual analysis of T1-5 and total of TT, mg/g R), according to the CCCD with 5 range levels (Table 1). The parametric subscript 1, 2, and 3 stands for the variables involved t (X1), P (X2), and S (X3), respectively. Analysis of significance of the parameters (α = 0.05) are presented in coded values. Additionally, the statistical information of the fitting procedure to the model is presented.
PARAMETERSRESIDUEFLAVONOID CONTENTTANNIN CONTENT
INDIVIDUALTOTALINDIVIDUALTOTAL
YieldF1F2F3F4F5TFT1T2TT
Interceptb00.140±0.0040.224±0.0110.100±0.0060.233±0.0100.227±0.0120.289±0.0161.106±0.0364.923±0.27315.786±1.30620.312±0.861
Linear Effect b10.010±0.002−0.017±0.017ns ns −0.016±0.016−0.045±0.032−0.083±0.049ns 2.061±0.5312.744±0.452
b20.026±0.007ns ns ns ns ns ns ns ns ns
b3−0.011±0.007−0.018±0.0170.037±0.0120.006±0.004ns 0.009±0.0090.043±0.015−0.207±0.164ns −3.754±1.515
Quadratic Effectb11−0.014±0.003−0.045±0.009−0.006±0.006−0.051±0.007−0.046±0.008−0.064±0.009−0.206±0.026−0.827±0.154−3.077±0.864−3.628±0.745
b22ns ns ns −0.005±0.007−0.018±0.008ns −0.045±0.026ns ns ns
b33−0.005±0.003−0.020±0.009ns −0.011±0.007−0.024±0.008ns −0.061±0.026ns −0.812±0.864ns
Cubic Effectb111ns 0.012±0.007ns 0.008±0.0020.010±0.0060.023±0.0130.055±0.0190.294±0.064ns ns
b222−0.006±0.003ns ns ns ns ns ns ns ns ns
b3330.009±0.0030.009±0.007−0.009±0.005ns ns ns ns ns ns 1.462±0.596
Interactive Linear Effectb12ns −0.005±0.004−0.005±0.003−0.010±0.003−0.007±0.003−0.016±0.007−0.043±0.010−0.260±0.116ns −0.498±0.321
b13ns −0.004±0.004ns ns −0.003±0.003ns −0.015±0.010ns ns ns
b230.003±0.002ns ns ns ns −0.007±0.001ns −0.173±0.116ns −0.380±0.321
b123−0.002±0.001−0.004±0.002−0.002±0.002−0.004±0.002−0.003±0.002−0.006±0.004−0.018±0.006−0.077±0.072ns −0.307±0.198
Interactive Quadratic Effectb1122ns ns ns ns ns ns ns ns −4.273±0.864−5.336±0.952
b1133ns ns ns ns ns ns −0.135±0.071ns ns ns
b2233ns −0.069±0.023ns ns ns ns ns ns ns ns
b112233ns 0.026±0.008−0.001±0.0010.002±0.0010.005±0.002ns 0.057±0.022ns 1.594±0.1761.849±0.657
Statistics (R²)0.93310.90660.81600.94080.90360.84730.96410.83050.84260.9206
Table 4. Variable conditions in natural values that lead to optimal response values for RSM using a CCCD for each of the response values assessed the residue (Yield, g R/g DW), flavonoid (individual analysis of F1-5 and total of TF, mg/g R), and tannin content (individual analysis of T1-5 and total of TT, mg/g R).
OPTIMAL VARIABLE CONDITIONS
X1: t (min)X2: P (W)X3: S (%)
A) INDIVIDUAL OPTIMAL RESPONSE VALUES
Yield39.00±3.74446.34±21.1358.08±7.620.18±0.04g R/g DW
FLAVONOID
CONTENT
F117.64±2.59291.45±17.0743.28±6.580.23±0.13mg F1/g R
F233.06±3.4650.00±7.0765.80±8.110.13±0.04mg F2/g R
F323.37±2.94275.00±16.5850.00±7.070.23±0.05mg F3/g R
F420.11±2.75279.01±16.7045.20±6.720.23±0.05mg F4/g R
F59.31±1.96500.00±22.3646.12±6.790.30±0.05mg F5/g R
FT23.92±2.97289.36±17.0144.18±6.651.12±0.08mg TF/g R
TANNIN
CONTENT
T11.00±0.24500.00±22.3646.31±6.815.78±0.39mg T1/g R
T220.00±2.74275.00±16.5859.96±7.7416.13±0.90mg T2/g R
TT8.52±1.89500.00±22.3652.71±7.2623.35±0.47mg TT/g R
B) RELATIVE OPTIMAL RESPONSE VALUES FOR FLAVONOID CONTENT
Yield26.32±3.07285.57±16.9044.80±6.690.13±0.07g R/g DW
FLAVONOID
CONTENT
F10.21±0.06mg F1/g R
F20.12±0.04mg F2/g R
F30.23±0.08mg F3/g R
F40.22±0.07mg F4/g R
F50.30±0.05mg F5/g R
TANNIN
CONTENT
T14.79±0.19mg T1/g R
T215.12±1.89mg T2/g R
C) RELATIVE OPTIMAL RESPONSE VALUES FOR TANNIN CONTENT
Yield11.44±2.03500.00±22.3951.22±7.160.15±0.09g R/g DW
FLAVONOID
CONTENT
F10.07±0.01mg F1/g R
F20.07±0.02mg F2/g R
F30.20±0.05mg F3/g R
F40.16±0.03mg F4/g R
F50.29±0.04mg F5/g R
TANNIN
CONTENT
T15.35±0.31mg T1/g R
T215.23±0.90mg T2/g R
D) GLOBAL OPTIMAL RESPONSE VALUES
Yield23.47±2.90258.78±16.0950.51±7.110.13±0.07g R/g DW
FLAVONOID
CONTENT
F10.22±0.07mg F1/g R
F20.11±0.03mg F2/g R
F30.23±0.08mg F3/g R
F40.23±0.07mg F4/g R
F50.29±0.04mg F5/g R
TANNIN
CONTENT
T14.88±0.21mg T1/g R
T215.77±0.97mg T2/g R
Table 5. Bioactivity assays of chestnut flowers optimized extract.
Optimized ExtractPositive Control
Antioxidant Activity (IC50 Values, µg/mL) Trolox
TBARS Inhibition2.7 ± 0.15.8 ± 0.6
OxHLIAΔt 60 min29 ± 119.6 ± 0.7
Δt 80 min54 ± 226.9 ± 0.8
Anti-Inflammatory Activity (EC50 Values, µg/mL) Dexamethasone
RAW 267.4195 ± 816 ± 1
Cytotoxicity (GI50 Values, µg/mL) Ellipticine
AGS (gastric carcinoma)58 ± 30.9 ± 0.1
CaCo (colorectal adenocarcinoma)39 ± 10.8 ± 0.1
MCF-7 (breast carcinoma)141 ± 51.020 ± 0.004
NCI-H460 (non-small cell lung cancer)232 ± 61.01 ± 0.01
Hepatotoxicity (GI50 Values, µg/mL) Dexamethasone
VERO110 ± 50.6 ± 0.1
Antibacterial Activity (mg/mL) E221E224
MICMBCMICMBCMICMBC
Staphylococcus aureus124411
Bacillus cereus0.510.50.524
Listeria monocytogenes12120.51
Escherichia coli0.51120.51
Salmonella Typhimurium0.511211
Enterobacter cloacae12240.50.5
Antifungal Activity (mg/mL) E221E224
MICMFCMICMFCMICMFC
Aspergillus fumigatus241211
Aspergillus niger121211
Aspergillus versicolor122211
Penicillium funiculosum0.250.5120.50.5
Penicillium verrucosum var. cyclopium122412
Trichoderma viride0.250.5120.50.5
The antioxidant activity was expressed as EC50 values, which means that higher values correspond to lower reducing power or antioxidant potential. EC50: extract concentration corresponding to 50% of antioxidant activity or 0.5 of absorbance in the reducing power assay. Cytotoxicity results are expressed in GI50 values corresponding to the sample concentration achieving 50% of growth inhibition in human tumor cell lines or in a non-tumor culture from African green monkey (VERO). Anti-inflammatory activity is expressed as EC50 values corresponding to 50% of inhibition of the NO production in comparison with the negative control (100% of NO production). Antimicrobial activity is expressed as minimal inhibitory concentration (MIC), minimal bactericidal concentration (MBC), and minimal fungicidal concentration (MFC) values. Trolox, dexamethasone, ellipticine, and sodium sulphite (E221), and potassium metabisulphite (E224) food additives, respectively, were used as positive controls in the assays. All values are expressed as means ± SD (n = 9).
Publisher’s Note: MDPI stays neutral with regard to jurisdictional claims in published maps and institutional affiliations.

