
Investigation of the Role of Face Shape on the Flow Dynamics and Effectiveness of Face Masks

Department of Mechanical Engineering, Joint College of Engineering, Florida A&M University-Florida State University, Tallahassee, FL 32310, USA
*
Author to whom correspondence should be addressed.
Fluids 2022, 7(6), 209; https://0-doi-org.brum.beds.ac.uk/10.3390/fluids7060209
Submission received: 20 May 2022
/
Revised: 14 June 2022
/
Accepted: 16 June 2022
/
Published: 18 June 2022
(This article belongs to the Special Issue Computational Biofluiddynamics: Advances and Applications)
Abstract
:Due to the COVID-19 pandemic, face masks have been used extensively in society. The effectiveness of face masks depends on their material, design, and fit. With much research being focused on quantifying the role of the material, the design and fit of masks have been an afterthought at most. Recent studies, on the other hand, have shown that the mask fit is a significant factor to consider when specifying the effectiveness of the face mask. Moreover, the fit is highly dependent on face topology. Differences in face types and anthropometrics lead to different face mask fit. Here, computational fluid dynamics simulations employing a novel model for porous membranes (i.e., masks) are used to study the leakage pattern of a cough through a face mask on different faces. The three faces studied (female, male, and child) are characteristic faces identified in a previous population study. The female face is observed to have the most leakage through the periphery of the mask, which results in the lowest fitted filtration efficiency of the three faces. The male and child faces had similar gap profiles, leakage and fitted filtration efficiencies. However, the flow of the three faces differs significantly. The effect of the porosity of the mask was also studied. While all faces showed the same general trend with changing porosity, the effect on the child’s face was more significant.
1. Introduction
During the COVID-19 pandemic, the use of face masks has been adopted by the general public. Both the World Health Organization (WHO) and Center for Disease Control (CDC) recommended using fabric face masks at the peak of the pandemic in lieu of N95 respirators and surgical masks, to ensure the latter two would be available to high-risk individuals such as infected patients and medical personnel. A tutorial to make a face mask from fabric was even provided by CDC, and later, it was followed by many diverse design patterns on the web to make custom-made face masks at home. Donning face masks and social distancing have been the primary tools in mitigating droplet and airborne transmission [1,2]. It is well-known that proper material designs can be employed to reach a high filtration efficiency and proper pressure drop through mask fabrics [3,4,5]. However, when the mask is fabricated from the cloth or is loosely placed on the face, its efficacy decreases significantly due to leakage around the perimeter of the mask [6,7]. In order to have an accurate estimation of the protection offered by the mask, it is necessary to study their perimeter leakage. The cloth and surgical face masks are often loosely placed on the wearer’s face, and their fit might be changed due to the incorrect wearing habits [8], certain facial features [9] and also daily physical activities [10,11].
Experimental studies, using both humans and manikins, show that mask usage can limit the transmission of various infections to and from the wearer [12,13,14,15,16,17,18,19,20]. However, face masks are still plagued by peripheral leakage that reduces the effectiveness. Air leakage around the mask perimeter, where it does not make a seal with the face, has been observed to reduce the effectiveness of the mask [6,9,21]. The amount of perimeter leakage depends on facial dimensions and features significantly [6,9,22,23]. It is known and stressed that, for efficacious filtering of contaminants, N95 respirators must be tightly fitted to the face. Surgical masks on the other hand are primarily designed to block outward bound droplets; therefore, the fit is much looser. Fabric face masks such as the original CDC website pattern are likely to have an even looser fit, resulting in more peripheral leakage. In a study comparing the effectiveness of different face masks, homemade masks were shown to be half as effective as surgical masks and 50 times less effective than an FFP2 mask. These effects were more pronounced amongst the subjects with smaller faces likely due to an inferior fit [20].
The amount of leakage that results from improperly fitted masks has been shown to be the main driver of the overall protection of face masks. Regardless of mask type, researchers have consistently observed flow leakage through the periphery of the mask. A wide array of research has studied how facial differences correlate to differences in face mask seal. Zhuang et al. found significant differences in facial dimensions (anthropometrics) across gender, race, and age that were considered significant for the design of face masks [24]. Oestenstad and collaborators were able to identify leakage location and shape on subjects wearing half-mask respirators using a fluorescent tracer [22,23]. The effect of gender, race, respirator brand, and anthropometrics were studied. Differences in anthropometrics between the subjects were found to be highly correlated with leakage location, while the other categorical analysis showed weaker correlations. O’Kelly et al. compared the fit of different respirators and face masks on different participants and found that minor facial differences had a large impact on the quantitative fit [25]. Hariharan et al. were also interested in the effect of anthropometric differences on the fit of respirators and found that the fit varied between faces, therefore, resulting in a different distribution of leakage through the respirator’s perimeter [26]. Chopra et al. studied a compilation of literature on the effects of anthropometric differences on mask leakage and found that gender-based anthropometric differences are associated with lower mask efficacy in half of the studies [27]. Anthropometric difference is also significant across ethnicities, and Chopra et al. stated that, although minority groups are disproportionately affected by the COVID-19 pandemic, they are under-represented in literature [27].
Motivated by the conclusion that differences in anthropometrics lead to sub-optimal face mask seals, researchers have been studying personalized mask and frame designs [28,29,30,31,32]. Nold et al. tested the air seal of different mask designs, including custom 3D printed mask frames, on multiple faces [28]. They tried a surgical mask, an FFP2 mask, a 3D printed personalized mask, and a statistically shaped mask based on 190 face scans. The personalized mask demonstrated the lowest leakage. The statistically shaped mask and FFP2 mask showed similar leakage, and the surgical mask had the most leakage. Based on their study, Nold et al. concluded that personalized mask designs may be recommended for the best protection. Chen et al. 3D printed a customized fitter and placed it over the surgical mask, which demonstrated a significant increase in fit factor for the wearer [32]. Hyun et al. sought to increase the protection offered by surgical masks with three simple modifications: pliable wire around the mask perimeter, earloop tensioner, and an internal flap [30]. The pliable wire could be formed to each wearer’s face, offering a personalized mask fit and improved face seal. The modified mask, donned the “Ultra Fit Mask (UFM)” by Hyun et al., proved to have a better seal based on all the metrics tested by the researchers, including an over increase of the fit factor. Riutord et al. developed a personal peripheral sealing device 3D printed from thermoplastic [29]. The thermoplastic properties allowed the device to be uniquely formed to a wearer’s face. The device was tested by a group of participants and compared to a control group without using the device. The inward protection was tested by exposing the participants to an odorous solution, and of the group with the personal peripheral sealing device reported not smelling the solution while of the group without the device were able to detect it.
It is clear that face mask fit is not universal and highly dependent on face types and shapes. Therefore, predicting or modeling the transmission of the virus is anything but accurate when accounting for a population wearing face masks. Researchers have then been interested in accounting for these leakages in their transmission models [33,34,35,36,37]. The use of computational models of the face, i.e., headform models, paired with computational fluid dynamics (CFD) or other physics models can be used to more accurately and systematically estimate the magnitude and location of the leakage sites for different face types. Headform models provide a high fidelity representation of the head anatomy based on 3D scanning of different subjects ranging in age, weight, gender, etc. [38,39]. These models can be used to systematically change the face structure to study the effects of gender, age, race, anthropocentric differences on the fit and effectiveness of face masks. A headform model paired with a mask deployment model was used by the authors in an earlier study to simulate the mask fit on different faces [6,9]. The effect of gender, age, weight, and height on the fit of simple fabric masks of various sizes and tuck-in ratios was studied [6]. The average gap area and maximum gap opening were reported for 150 different faces in each category. Similar to previous studies, it was observed that facial dimensions had a significant impact on predicting the leakage. Another study by the authors aimed at pinpointing which facial features had the most impact on proper mask fitting [9]. The chin and nose length were found to be key characteristic measurements that affected the fit of the mask. In the same study, a simple model was developed to predict the gap opening based on different anthropometric measurements. Here, we study the flow of a respiratory event and the effect of different face types on mask fit and flow leakage using CFD simulations. The outcome of the study can be used to form better predictive metrics of virus spreading probability in epidemiological models [13,40].
2. Faces
A quasi-static model is employed for the deployment of face masks onto different faces generated from a headform model [6]. The mask deployment simulation uses a minimum energy method to model the fit of the mask on the face. The cloth mask consists of a rectangular (9 in. × 5.5 in.) fabric which side edges are “scrunched” (referred to as the tuck-in ratio). The mask is modeled as a membrane with stretching and no bending energy. The membrane has a border which has both stretching and bending energy, and elastic ear-loop bands (stretching only) are attached to the corners. A nonlinear set of equations can be obtained for the mask’s mesh node locations by relating the internal forces of the mask to the derivatives of the energy. The mask is initially placed in front of the face with the elastic bands wrapped around the ears with zero tension. The resting length of the band gradually decreases from the initial length to its final value during the initial transient phases. The intermediate quasi-static equilibrium position of the mask is calculated iteratively until the mask rests in the final configuration on the face. A full description of the model and solution method is presented in Solano et al. (2021) [6]. The numerical procedure is similar to the practical procedure of putting on a face mask by placing the mask on the face and pulling the bands over the ears. The contact between the face and mask is treated as a soft contact, meaning the mask can “squish” the face slightly. However, this deformation is not shown in the face depiction (Figure 1).
The headform model used to generate the faces is based on principle component analysis (PCA). The creators of this model, Paysan et al., used the face scans of over 100 male and female subjects to create a model that can be used to systematically generate faces with specific characteristics [38]. Solano et al. used this model to study the mask fit on different faces characteristic of masculine, feminine, young, old, thin, heavy, short, and tall subjects [6]. Wang et al. isolated the modes (principle components) associated with specific facial features such as the size of the nose or width of the face using the same headform model and PCA [9].
The faces considered here are based on one of the authors’ previous study [6]. The results of that study showed that both leakage area and maximum gap opening of the mask edges are needed to reach a characterizing factor that can identify different modes of leakage around the mask. The ratio of the standard deviation of the opening gap (), and the average opening distance along the edges (), , was found to be a viable parameter for unsupervised classification of the results. The data consisting of 150 different faces for each of the nine face-types, was grouped into five clusters to best separate the effect of facial categories (see Figure 10 in [6]). The clustering results, based on the differences in the face categories, show that, for face groups such as heavy and thin faces, the most effective face covering with minimal gap opening can be determined. However, for the other cases (male, female, old, young), the optimal cloth mask covering depends on other factors beyond those considered in the unsupervised clustering.
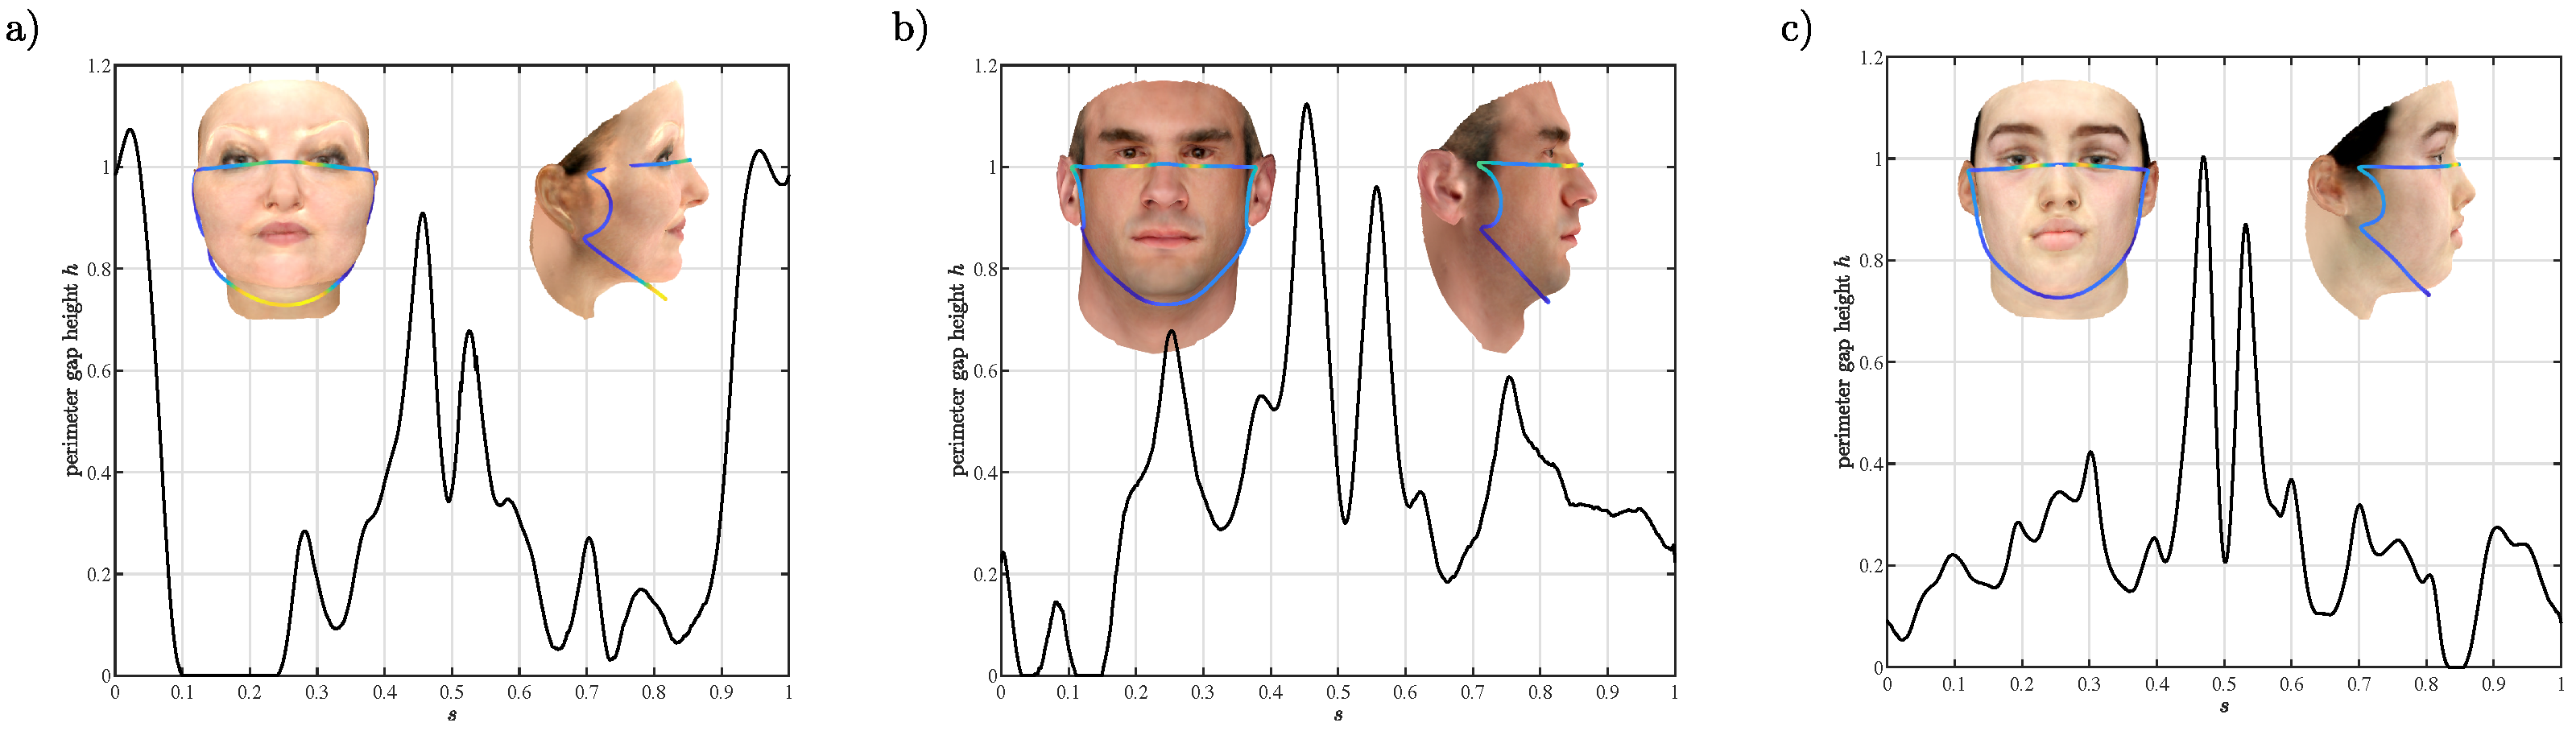
The particular faces considered here are that of a female, a male, and a child, shown in Figure 1, which best represents the cases that the clustering results offered no obvious suggestion of optimal mask fit. Figure 1 shows the peripheral gap created by the deployment of the mask on each face. The horizontal axis of the figures is the perimeter description s of the mask border starting at the center of the chin () and tracing the mask clockwise to the center of the nose at and finally ending at the center of the chin again (). The insets show the frontal and side view of the faces and the mask border colored by the gap height. The female face shown in Figure 1a is observed to have large gaps between the mask and face on either side of the nose () and at the chin (). This is also seen by the yellow color of the mask border in the inset at these locations. The male face (Figure 1b) has large gaps at either side of the nose as well but almost no gap at the chin. The peaks at correspond to the top corners of the mask. Due to the face shape and size and the deployment model, as the corners are pulled towards the ears, gaps are generated at these locations. However, as will be shown later, these gaps are inconsequential for two reasons: (1) no flow leaks through these locations; (2) the mask makes a seal with the face near these corners but further into the mask (i.e., closer to the center of the mask). The child’s face (Figure 1c) is observed to have the smallest gaps of the three faces. It also shows that the main gaps appear on either side of the nose. While not explicitly apparent here, the male face is the largest face in terms of width and length. The child and female faces are similar in size; however, the female face is wider and the child face is longer. Qualitatively, the mask fits tightest to the face on the male subject, loosest on the female subject, and on the child face the mask does not appear tight or loose. Note that the mask size and design are the same for all.
3. Computational Model
3.1. Problem Description
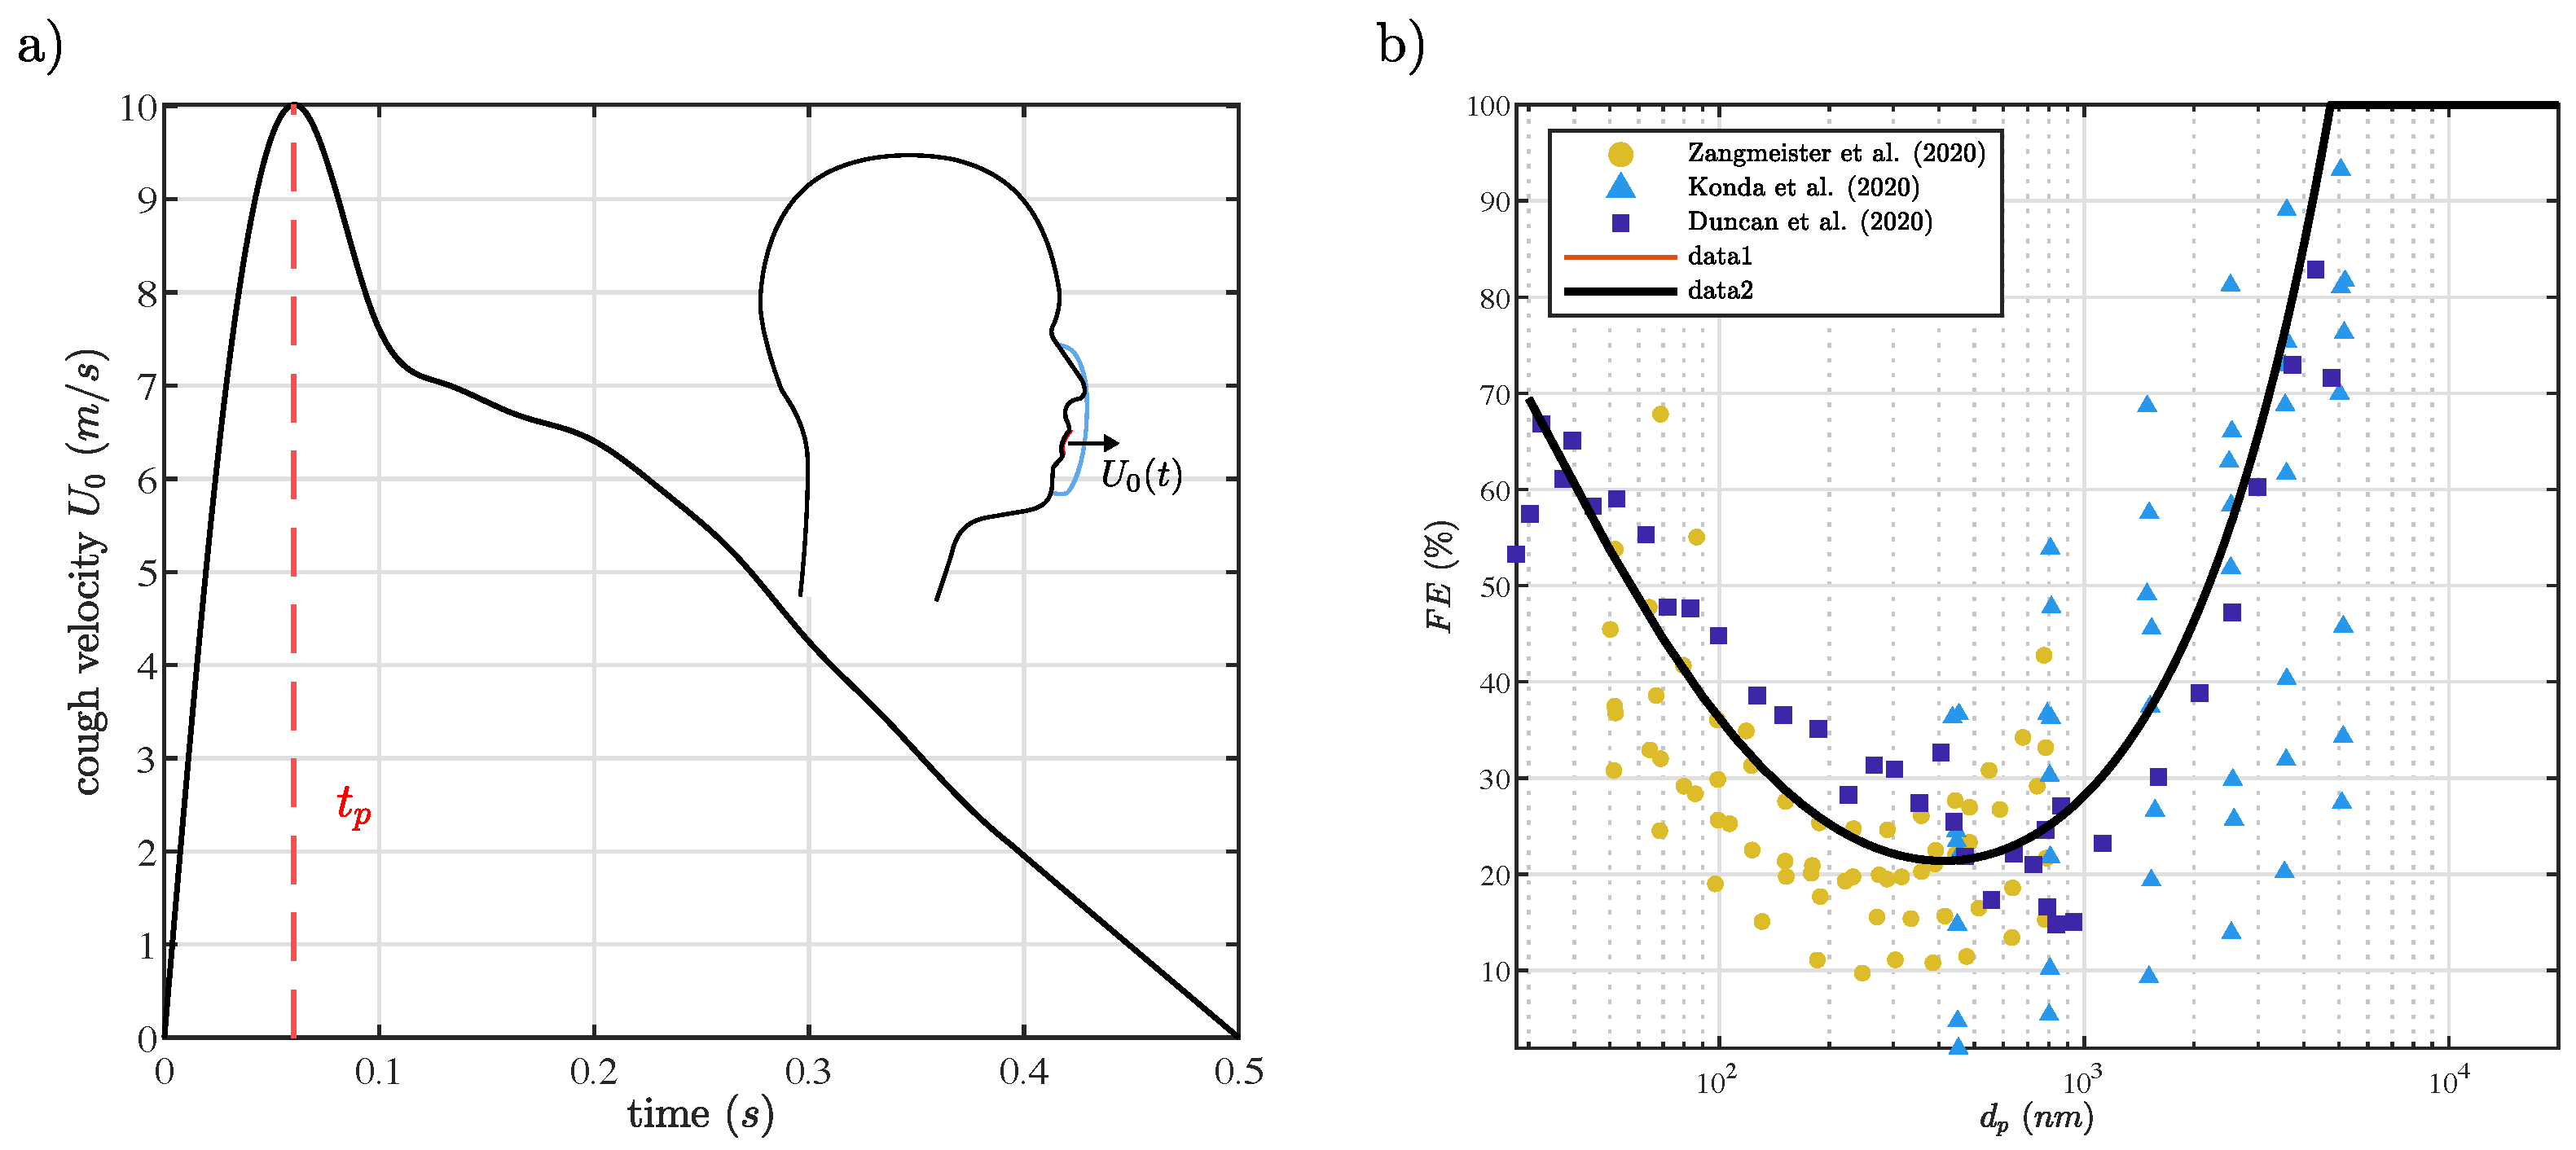
A subject coughing while wearing a simple face mask is considered here as shown in Figure 2a inset. The cough is a uniform, impulsively started jet with a horizontal velocity generated at the mouth with diameter cm (see inset in Figure 2a). The velocity of the cough over time is shown in Figure 2a. Cough profiles have been studied and reported in literature [41,42,43,44], and the peak velocity has been reported to range from 5 m/s to over 20 m/s with an average of around 10 m/s. The particular profile used here follows from the data collected by Gupta et al. [41].
3.2. Numerical Formulation
The flow is governed by the equations of continuity and momentum conservation:
where is the flow velocity, is the pressure, and is a forcing term added to enforce the effect of the immersed boundary (i.e., the mask and face). The Cartesian coordinate vector is denoted by . The face is represented using a sharp-interface immersed boundary condition [48]. The fluid forcing function is treated as a diffuse interface force:
where the position of the membrane i.e., the face mask, is denoted by = is the immersed boundary position and denotes the Lagrangian reference frame coordinate. The function denotes the force imposed by the immersed boundary on the fluid, and is the delta function.
The face mask is treated as a permeable thin and rigid membrane that exerts a resistive force against the cough jet. Since the mask is an inherently thin structure, it can be considered as a membrane with no transverse porosity. The Darcy law for porous media is used to model the porous membrane (i.e., mask) [49]. The Darcy relation, integrated through the thickness of the mask, can be written as
where is the slip or through-mask velocity, and is the pressure jump across the mask. The normal to the mask surface is denoted by , and k is the mask’s permeability coefficient. However, the parameter is used here for simplicity. Note that is inversely proportional to mask porosity, such that less porous masks have a higher value of .
Using Goldstein’s feedback law [50], the interaction force at time t can be calculated as:
where the constants and are chosen such that the immersed-boundary condition is enforced. The fluid velocity is interpolated to the mask mesh (), using a smoothed delta function,
where is chosen to be a four-point smoothed delta function,
and
Using the interaction force in the Darcy law Equation (4) yields
Only the normal component of the interaction force contributes to the porosity effects. Therefore, after separating the interaction force into the normal and tangential components, , and some algebraic manipulation of the discretized form of Equation (5), the normal component of the force at time step i can be written as
where is the time step, and the variables and are defined as:
The coefficients and are tested to be sufficiently large such that the results obtained do not change.
The governing Equations (1) and (2) are discretized on a Cartesian grid using a finite volume approach [48,51,52]. A 2nd-order Crank–Nicolson scheme is used for implicitly advancing the diffusion and advection terms. A fractional-step method proposed by Choi and Moin [53] is used to advance the momentum equation. The domain’s boundary conditions are set as Neumman conditions for the pressure and velocities.
3.3. Computational Setup
The grid refinement is based on the space between the mask and the face and chosen such that the flow in this small region is sufficiently refined. The mesh resolution here, is cm which corresponds to of the cough jet diameter. The size of the computational domain is 25 cm × 30 cm × 30 cm in the , and z directions. The time step must satisfy the CFL condition and also be small enough to ensure the stability of the solver. This is highly dependent on the porosity . For lower values of , the interaction force is smaller and the time step constraint can be relaxed. The smallest time step used was s for Pa·s/m, and a time step of s is used for the less porous cases of Pa·s/m. The maximum Reynolds number of the simulation based on the peak cough jet velocity and mouth opening diameter is , in the same range as some experimental studies of similar problems [54,55]. In this work, we do not use any explicit model for the subgird-scale fluctuations and instead Implicit Large Eddy Simulations are employed [56].
3.4. Data Post-Processing
The effectiveness of a face mask is measured by the filtration efficiency . However, is a nominal value given to the material of the mask. This nominal/average for common fabric face mask is reported in literature to be less than [45,46,57,58]. To accurately define the effectiveness of a mask in terms of protection for a wearer, the fit of the mask must be taken into account as different faces will lead to differences in gap sites and magnitudes and, therefore, differences in filtered and unfiltered flow leakage. As a result, we define the fitted filtration efficiency () as:
where is the through-mask flow rate, is the total flow leakage through the peripheral gaps, and is the total flow rate. The fitted filtration efficiency evaluates the real effectiveness of the mask while it is being worn on the face. As an example, N95 respirators have a nominal ; however, an incorrectly fitted N95 respirator can have a reduced or less [59].
The filtration efficiency is a function of particle size and mask material. Here, the only mask material parameter of interest is the porosity. However, the relation of and , if any exists, is not clear. What is known is the relation of and particle size . This is important because smaller particles, i.e., m, are more likely to leak out of the mask unfiltered, and can reach deep into the alveolar region of the lungs, increasing the likelihood of transmission [60]. Larger droplets, m, are more likely to get stuck to the inside of the mask [61] and also settle quickly to the ground due to gravity [1,62]. The different behavior based on particle size prompts us to study the effectiveness of masks on a particle size basis. The for various fabric face masks as a function of particle diameter , as reported in literature [45,46,58] is shown in Figure 2b. A general trend can be observed from the data of these various studies. For clarity, we will use a second-order rational polynomial curve, fitted to this data, to represent the relation of and of fabric masks. In Figure 2b, we see that all particles larger than m can be filtered by most common fabric face masks.
4. Results and Discussion
4.1. Temporal Evolution of Cough and Peripheral Leaks
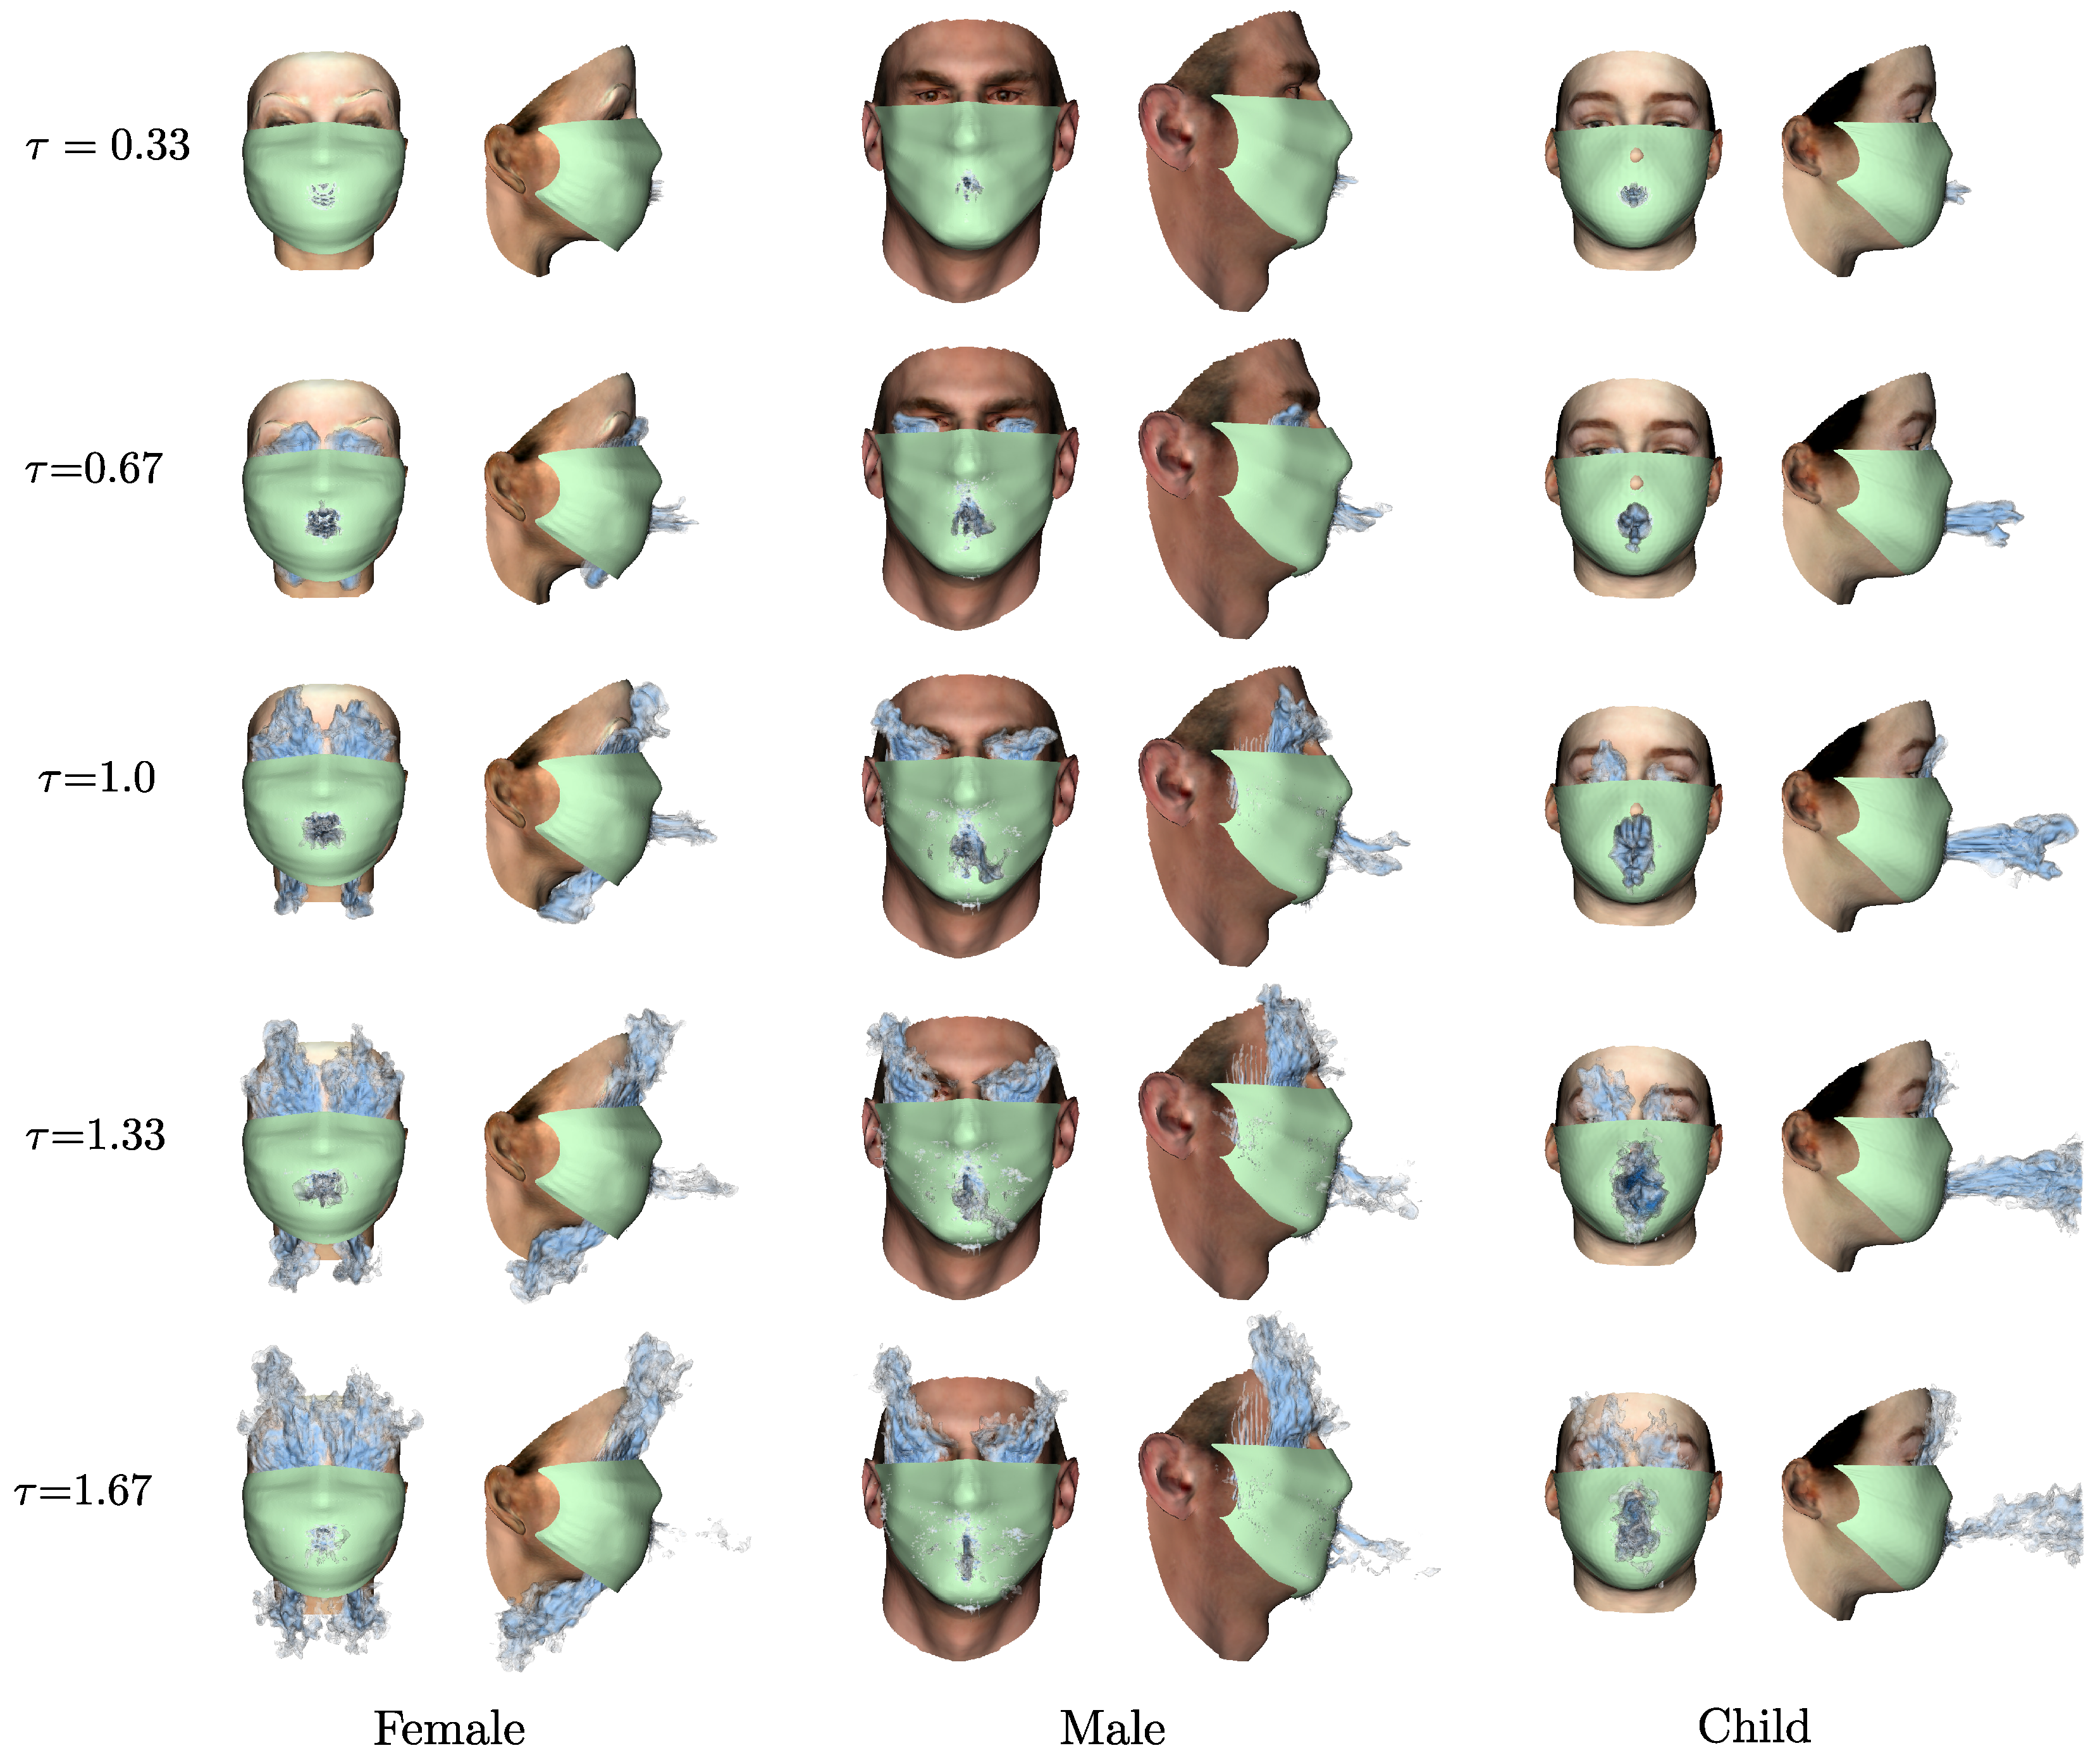
Figure 3 shows the iso-surface contours of the velocity magnitude of the cough through a mask with a porosity coefficient of Pa·s/m for the three faces, as it evolves over time. The time evolution is shown with respect to the non-dimensional time , where is the time of maximum velocity of the cough jet ( s). Initially (), flow is observed coming through the mask at the jet impingement location. As time progresses, the through-mask flow increases and peripheral leakage jets begin to form. The peripheral leakage for all faces is different. In the case of the female face, significant leakage is observed at the top of the mask near the nose and at the bottom of the mask around the chin. The male face shows leakage predominantly at the top of the mask around the nose, and at later times a small amount of leakage is observed at the right edge of the mask. The child face shows the least amount of leakage through the peripheral gaps; however, some leakage is observed at the top of the mask around the nose. In all three faces, the plumes on either side of the nose are not symmetrical. This asymmetry arises from slight facial structure asymmetries which are amplified by the mask fit after mask deployment.
The through-mask flow is also different between the three faces. The through-mask flow for the female and child faces is different in magnitude, but, for both, the through-mask jet is uniform and contained to the near-mouth region. Unlike these two faces, in the male case, the through-mask leakage is more dispersed through the entire surface of the mask. A similar near-mouth leakage jet is apparent; however, there is flow observed through the mask at various other locations. The through-mask flow is directly dependent on the pressure drop across the mask. The cough jet initially impinges directly in front of the mouth on the mask creating a region of high pressure inside the mask, which leads to the main through-mask jet seen in all faces. The flow is directed away from the mouth in all directions after the initial impingement. The redirected flow, in the case of the female face, is hardly restricted. This leads to a lower pressure inside the mask and therefore less through-mask flow. In the case of the male and child face, the redirected flow is restricted by the tighter fit of the mask. For example, the mask is in contact with the chin and the nose in both cases, making a seal that causes high pressure at the impingement location. The pressure inside the mask, therefore, remains high and more through-mask flow is observed compared to the female face case. The difference between male and child faces are associated with the placement of the mask on the nose. In particular, the highly stretched mask in the male face creates narrow but deep channels on both sides of the nose. These channels extend from the mid location of the mask to the top edge of mask. In the child face, while these channels still exist, they flatten out toward the mouth region and induce more resistance to the flow.
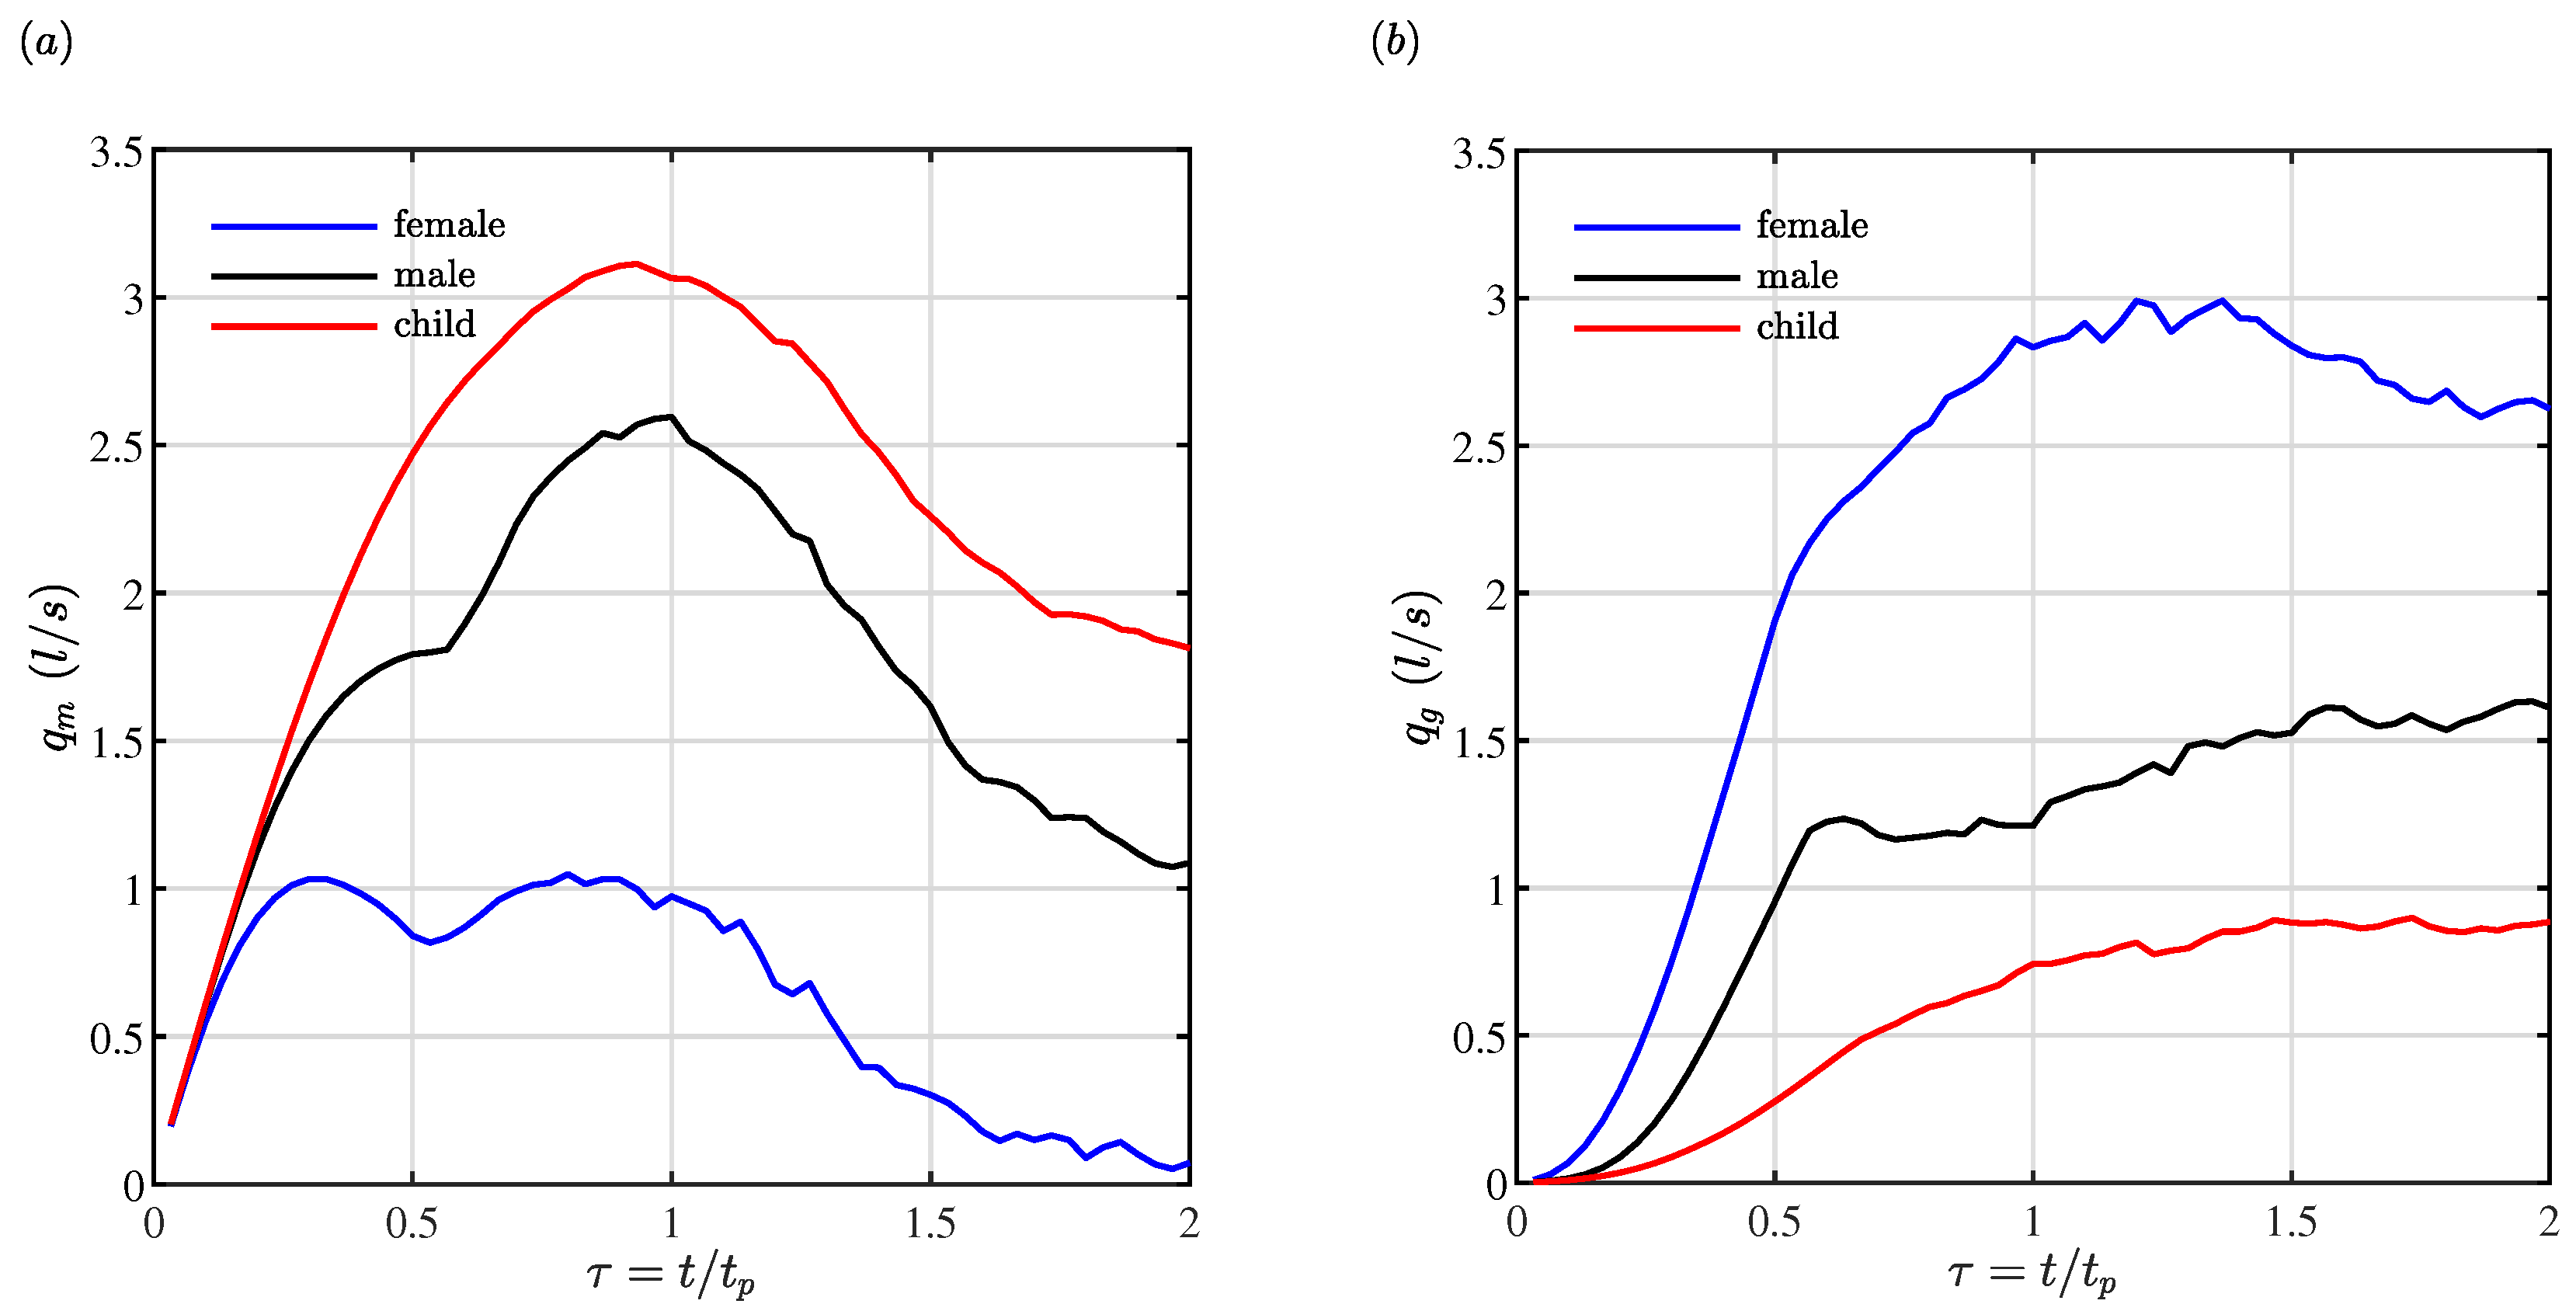
To better understand the distribution of the flow, the time history of the volume flow rates is illustrated in Figure 4. The through-mask flow rate () is highest in the child case followed by the male case, and the female case with a significantly lower flow as shown in Figure 4a. Although the through-mask flow structures of the male and female cases are observed to be similar in Figure 3, the through-mask flow rates are significantly different. The male case shows close to three times the flow rate during the peak cough velocity (). The evolution of through-mask flow of these two cases shows a similar trend albeit not similar in magnitude. The through-mask flow is observed to initially peak at . The end of the peak coincides with the emergence of the gap leakage flow as shown in Figure 3 for the female and male cases. The gap flow rate () lags in comparison, and does not reach its maximum value until . This effect captures the capacitance phenomena of the space between the mask and face, which the flow must “fill” at the beginning of the cough before leaking through the perimeter of the mask. For all cases, the through-mask flow rate increases to its maximum at , which coincides with the maximum cough velocity and then decreases. It comes as no surprise that the female case has the most flow leakage since it also had the largest gaps between the mask and face. It is clear that the highest risk for dispersion of virus-laden aerosols occurs for in all cases, which is characterized by the peak in the cough jet evolution. For the remaining discussion, we will focus on the worst-case scenario of maximum viral dispersion, which occurs during the time range mentioned above.
4.2. Effect of Porosity on Flow Distribution
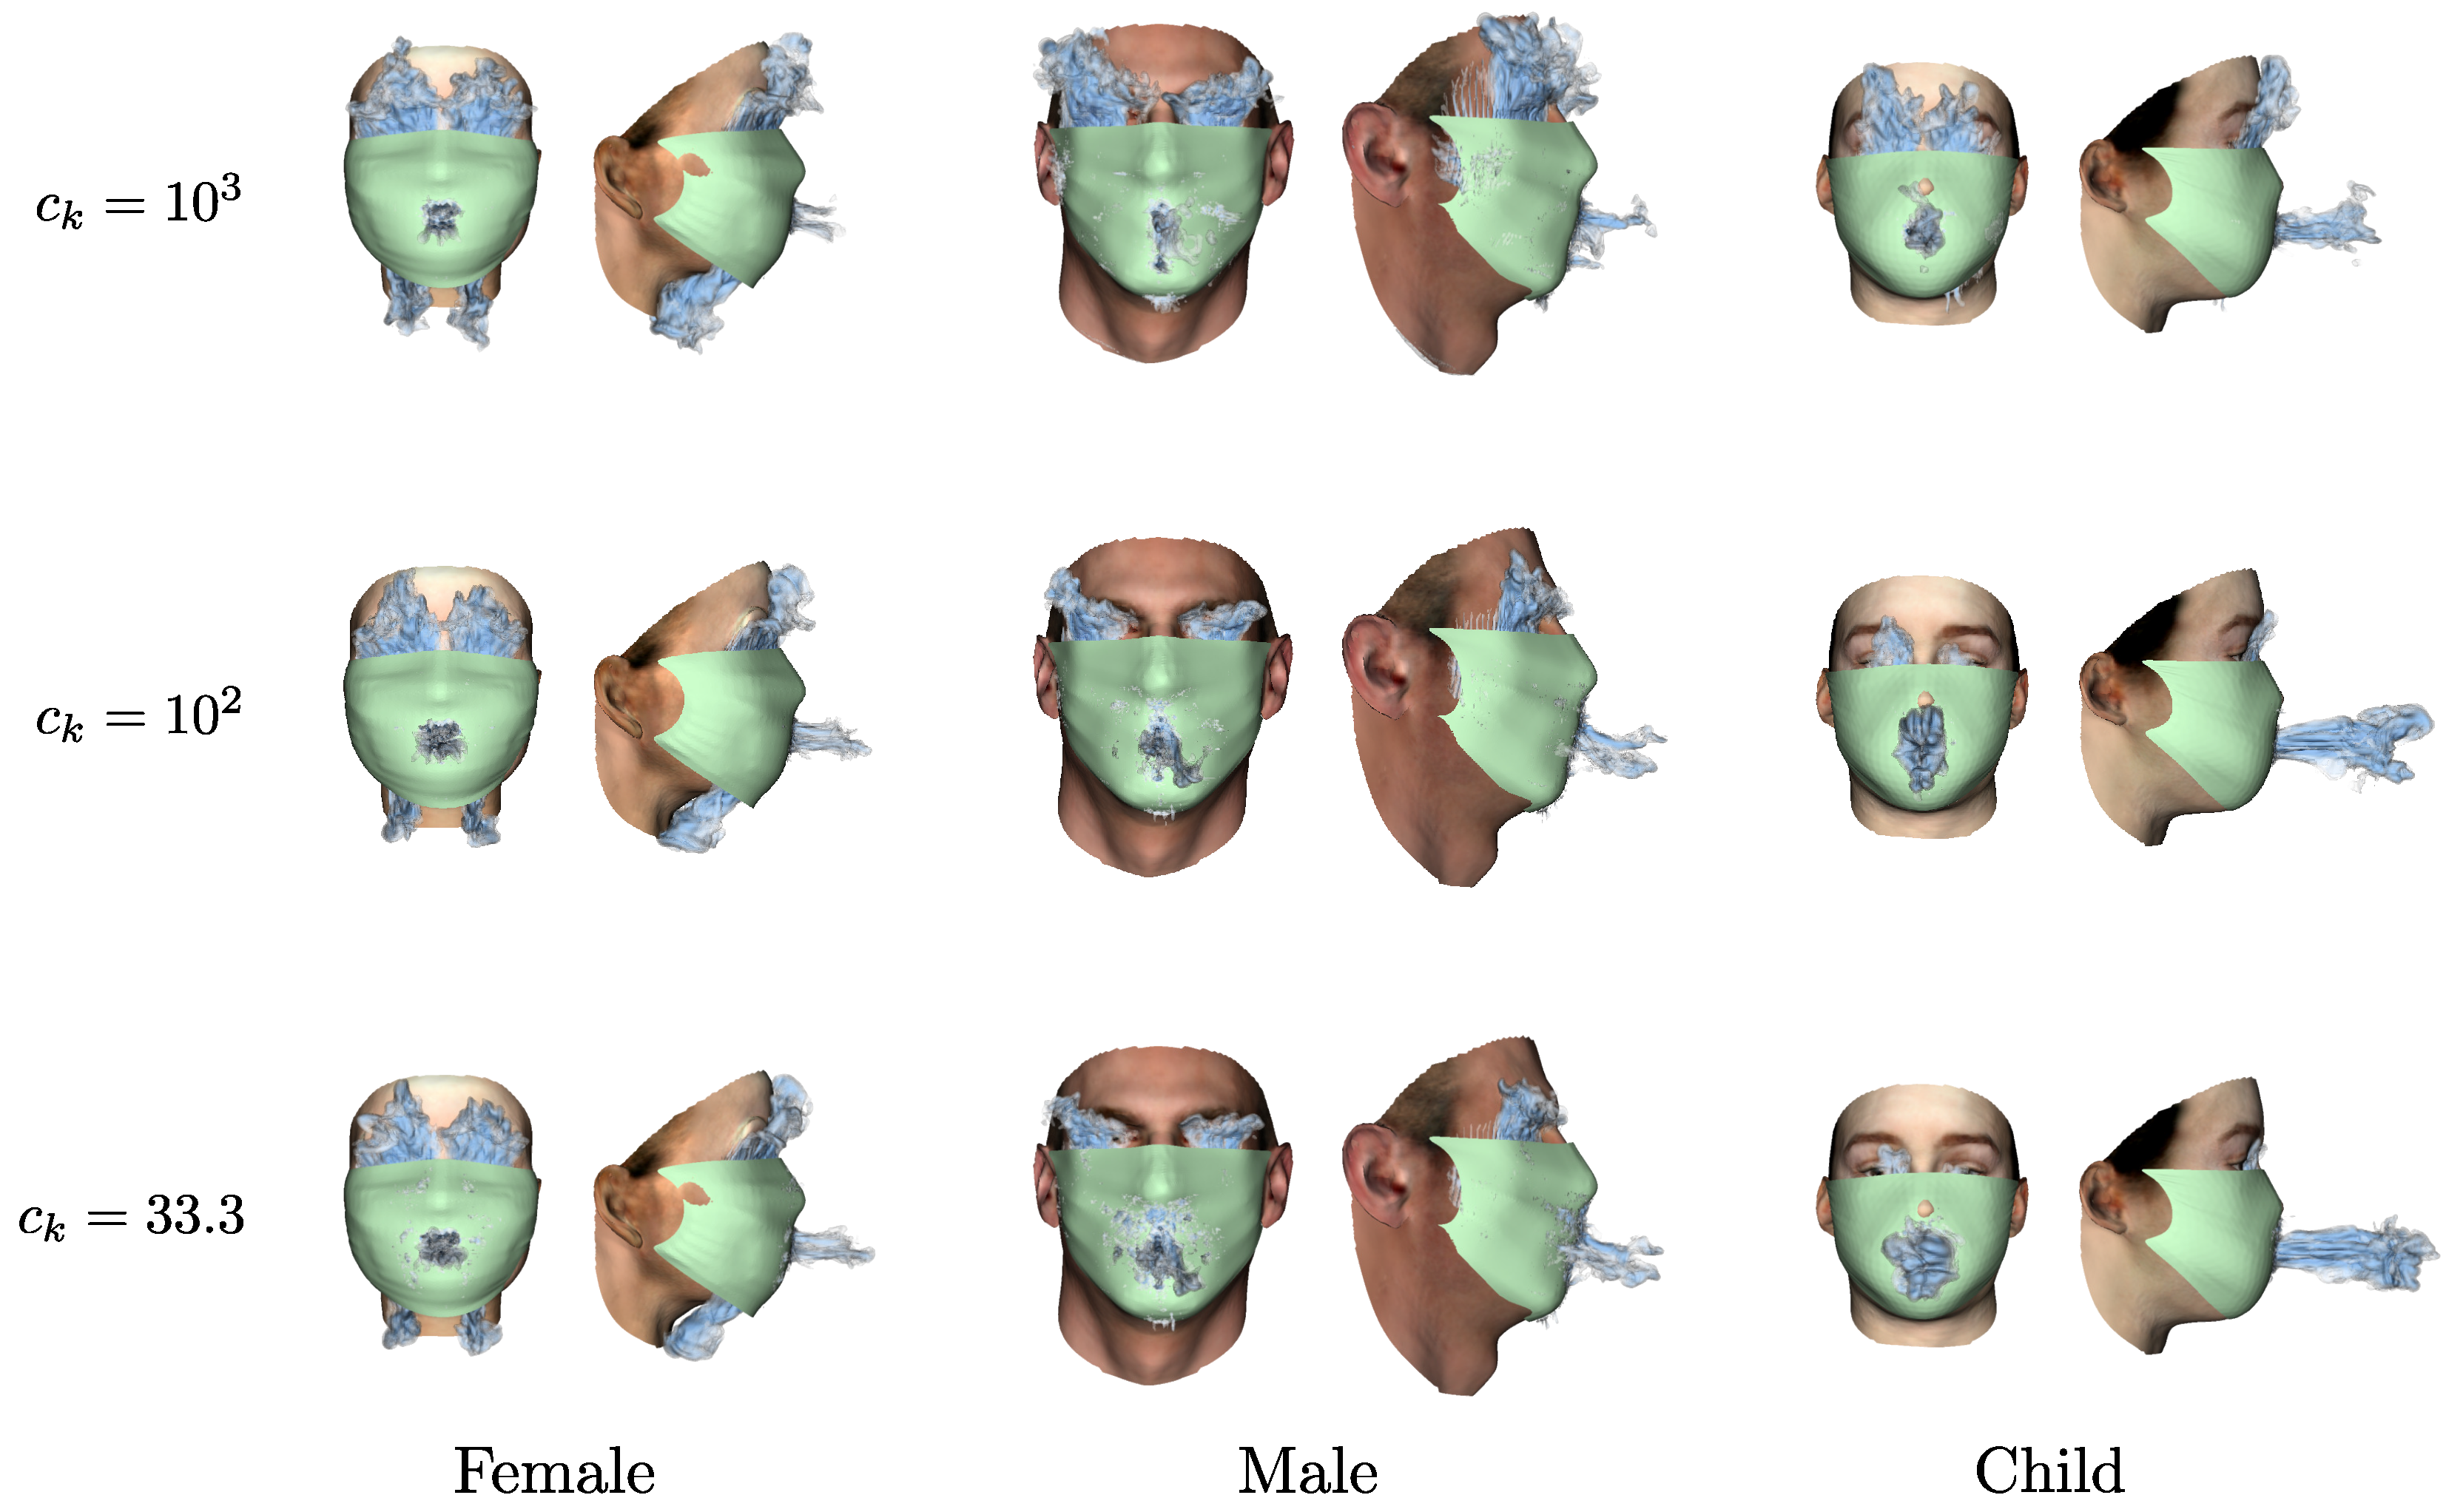
Figure 5 shows the flow at , for different mask porosities as iso-surface contours of the velocity magnitude. The mask porosity increases as decreases (top to bottom in Figure 5). It is immediately evident that more gap leakage results from less porous masks for all faces (compare Pa·s/m with Pa·s/m). For the first case shown Pa·s/m (top row in Figure 5), the flow leaking through the peripheral gaps is significant for all faces while the through-mask flow is relatively low. Although the mask may create very small gaps, the high pressure caused by the impingement of the cough jet on an effectively rigid wall in lower porosity masks leads to leakage through all the gaps around the mask perimeter. In Figure 5, this effect is seen in the male and child faces and the lowest mask porosity (top row in the figure), where the flow can be observed leaking through the bottom edge of the mask. On the other hand, for higher porosity masks (bottom row in the figure), no bottom edge leakage occurs. Similar trends have been reported in literature [49,63,64]. Schlieren and PIV visualization studies of a fitted N95 have shown that, although the through-mask flow is significantly reduced by the respirator, peripheral gap leakage still occurs, particularly through the top edge of the mask [63,64]. This is especially true for looser-fitting masks such as surgical masks.
The change of porosity of the mask does not affect all faces the same. The female face, due to the large gaps, does not show a significant effect on the flow structure with the different porosity masks. Here, the flow is dominated by the gaps. For the male face, we can observe significant changes in both the gap leakage flow and the through-mask flow. The gap leakage flow is significantly greater for the less porous case compared to the most porous case. As previously noted, there is also leakage at more locations for the least porous case. The through-mask flow for the male face at higher mask porosity is more dispersed throughout the mask, while, in the most porous case, the through-mask flow is more localized to the near-mouth region. An interesting secondary jet is also apparent for the least porous case in the male face. This secondary through-mask jet appears below the main through-mask jet, near the chin. This jet is a product of the high-pressure region generated by the impingement at the chin of the flow that is redirected away from the mouth after the initial impingement with the mask. For the child face, the effect of different porosity masks is limited to the magnitude of the through-mask and gap leakage flows, and the previously noted bottom edge leakage for the least porous mask.
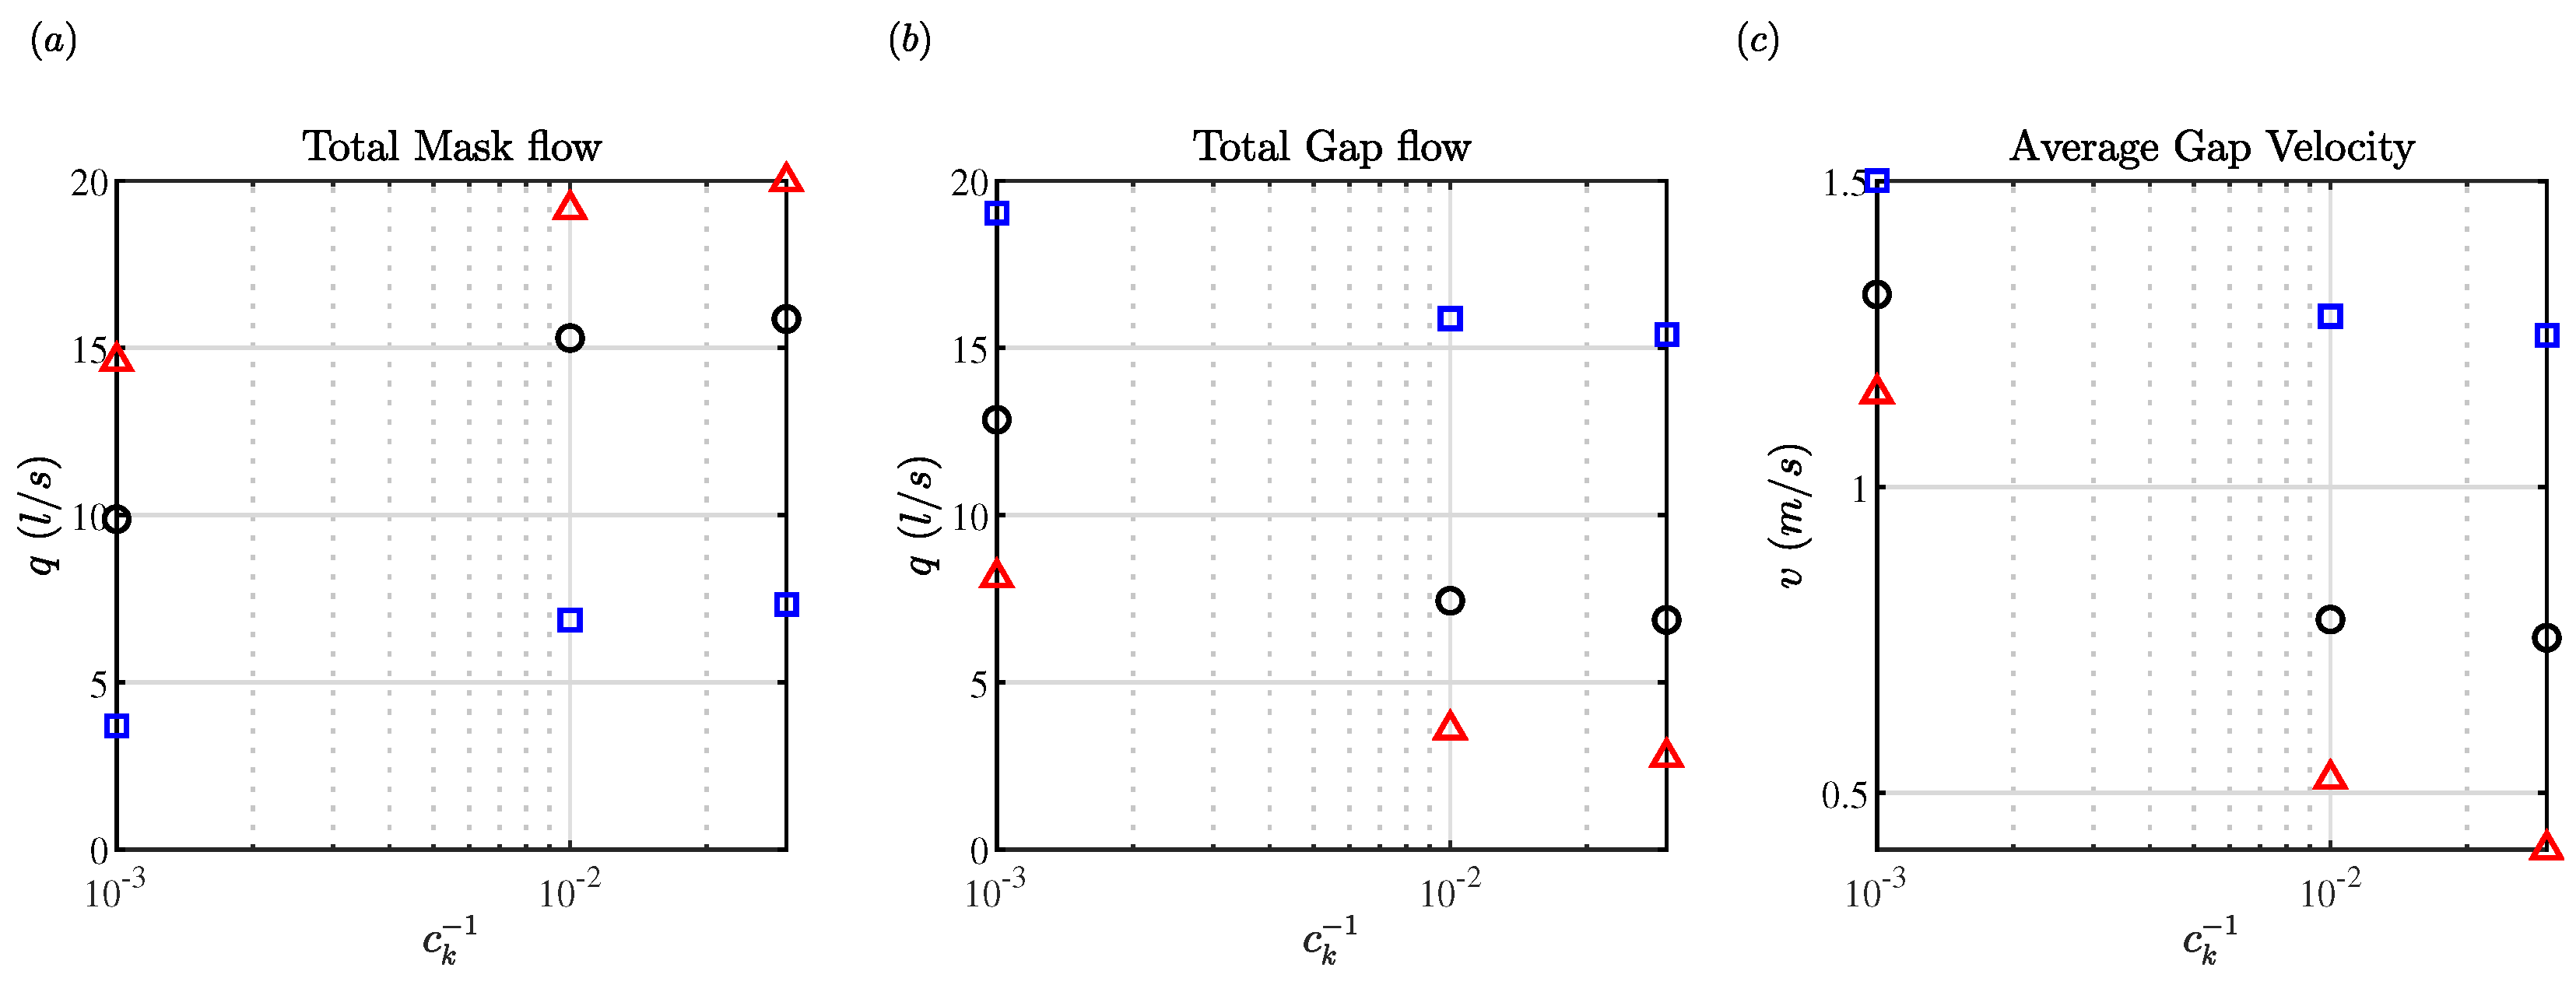
The through-mask and peripheral gap volume flow rates are shown in Figure 6 for all the mask porosities tested (33.3 Pa·s/m < < 2 Pa·s/m). As expected, we see in Figure 6a,b, as the mask’s porosity increases (decreasing ), increases while decreases. The distribution of the flow, i.e., amount of through-mask flow compared to the gap leakage flow, shows a more dramatic change between mask porosities m/Pa·s to m/Pa·s than at higher porosities m/Pa·s. This is observed for all face types. It is interesting to note that the distribution of the flows for the male case inverts in the range of porosities studied here. For lower porosities, the gap leakage flow dominates the male case, while, for higher porosities, the through-mask flow is greater. This was previously observed by Solano et al. [49]. Based on Figure 6a,b, we can speculate that the same inversion can occur for the other two face types. The curves for the female face trend towards inversion at lower porosities ( m/Pa·s), and in the child case the curves trend towards inversion at higher porosities ( m/Pa·s).
The time-averaged velocity of the gap leakage flow is shown in Figure 6c for the three faces and different porosities. The time-averaged velocity is the time-average of the top-gap-averaged velocity over the peak time range . The female case is observed to have the highest gap leakage velocity of the three face types. The trends observed for are similar to the trends in . A significant difference observed in is the rate of change of with respect to . For the female case, the decrease in with increasing porosity is moderate, and similar to the decrease in . However, in the male case and more significantly in the child case, the decrease in is proportionally much greater than the decrease in over the same range of porosities. This drastic change is due to the smaller gaps present in the child and male faces. With higher mask porosities, more flow is allowed to pass through the mask, therefore decreasing the pressure inside the mask, which produces lower velocity plumes.
4.3. Fitted Filtration Efficiency
The relation between and is not clear due to the complex nature of , which depends on porosity, weave pattern, thread/fiber size, electro-static properties of the material, and particle size, amongst other things. Multiple researchers have experimentally measured the nominal for different fabric face masks, surgical masks, and half-mask respirators [45,47,65]. Based on the data collected by these authors, it is unclear whether there is a relationship between porosity and filtration efficiency, except for a slight inverse relation for fabric masks. In general, it has been observed that the porosity of cloth masks can range widely from m/Pa·s < < m/Pa·s. Surgical masks and N95 respirators do not have such a wide range of porosities, each with m/Pa·s and m/Pa·s, respectively.
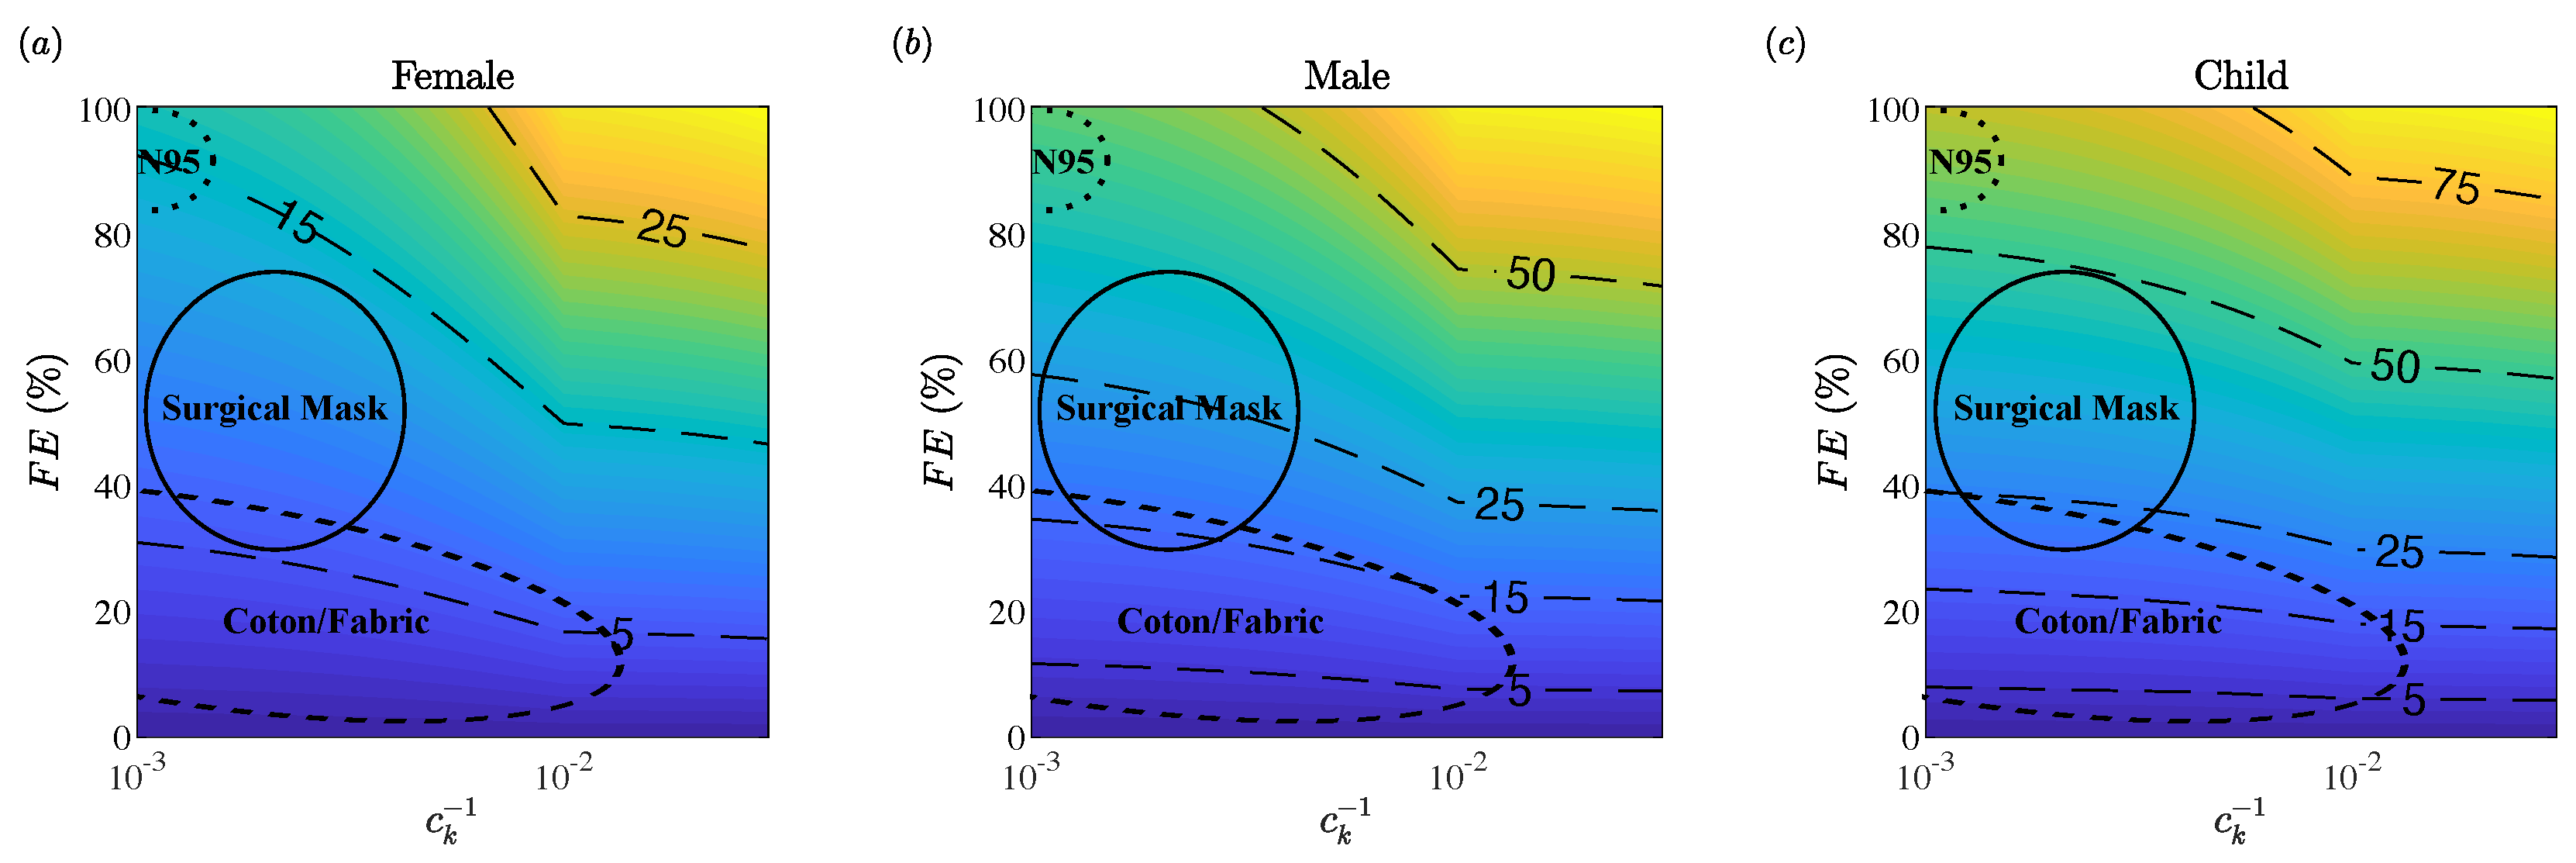
The nominal effectiveness of masks is usually reported by the filtration efficiency (Equation (12)), which corresponds to the percentage of filtered particles for that mask’s particular material. However, this does not account for the flow that leaks through the gaps when the mask is on a face. The fitted filtration efficiency is the fraction of filtered particles accounting for the gap leakage, and is therefore a more realistic measure of a mask’s effectiveness. Figure 7 shows the for each face type for different porosities and nominal filtration efficiencies. The regions corresponding to fabric masks, surgical masks, and N95 respirators on the contour map in Figure 7 are encircled based on the data collected by Zangmeister et al. [45], Duncan et al. [47], and Konda et al. [65]. It is important to note that the encircled regions correspond to the mask material and not the mask itself since the mask design simulated here is not the same as a surgical mask and much less an N95 respirator. The purpose of overlaying the different mask material regions in Figure 7 is to illustrate the overall effectiveness of the generic face mask design modeled here if it were to be made of these different materials.
The is highest for the most porous mask and highest . The more porous masks allow more flow to be filtered through the mask, which also results in less gap leakage flow attributing to the higher . This trend was also observed in a previous study by the authors [49] for a wider range of porosities. It is clear that the is directly related to the gap sizes. The female face had the largest gaps and presented the lowest for all and . The child face had the smallest gaps and also showed the highest , up to three times higher than the female face. The child case shows an interesting trend compared to the other faces, and the is not significantly affected by the until very high values of . For all types of mask materials outlined in Figure 7, the is less than of the nominal . The for surgical masks shown in Figure 7 is comparable to the experimental results in literature [59,66] (FFE = 12–36%).
4.4. Particle Size
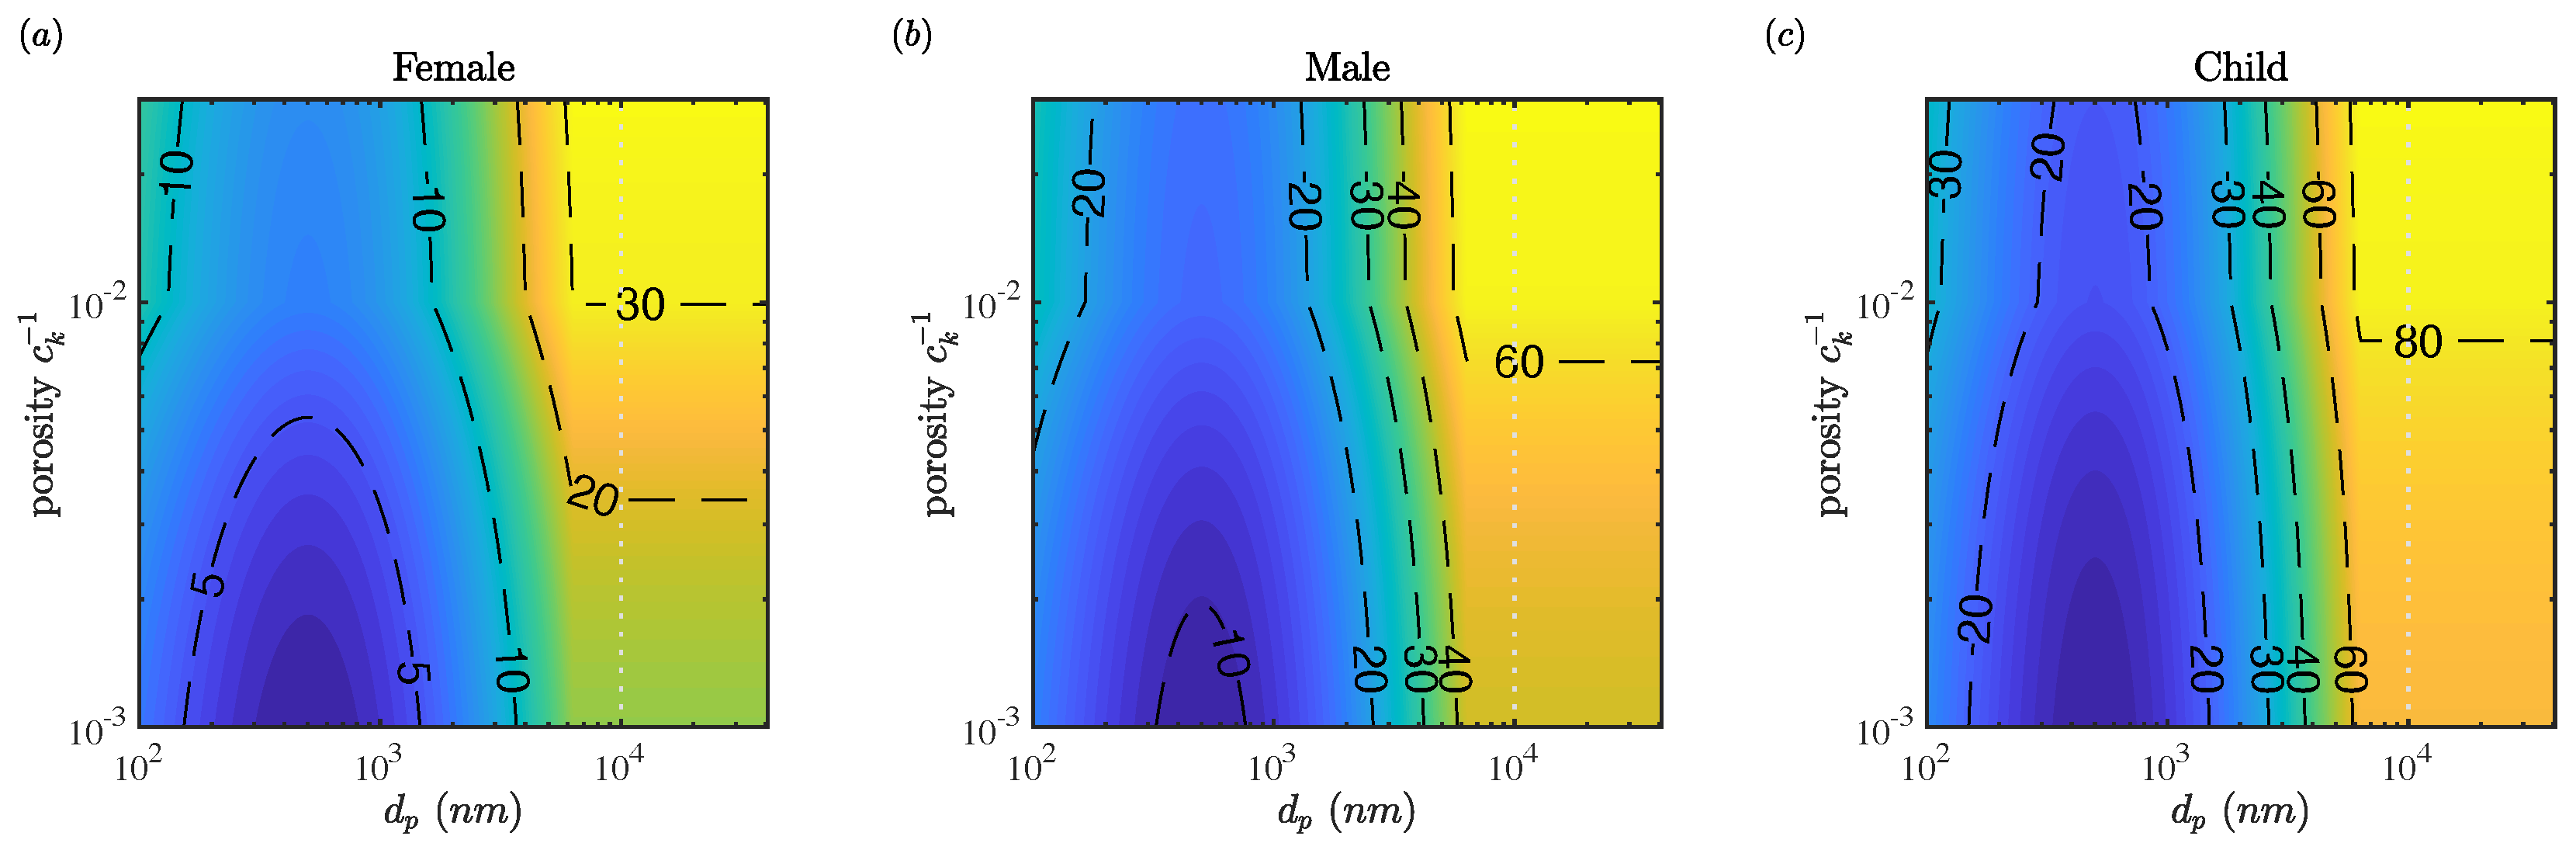
As discussed in Section 3.4, the face mask depends on particle size (). Therefore, can be calculated for each particle size instead of the nominal average we have discussed so far. Figure 8 shows the contour map of for different and . As seen in Figure 2b, is concave with a minimum observed around m m. This effect appears clearly in Figure 8, where is lowest for the same range of in all face types. For the female face, less than of particles, regardless of size, are filtered. The male and child face seem to have better throughout. However, recall that the typical porosities for fabric masks, surgical masks, and especially N95 respirators is . This means that, even in the best case scenario here, the child face with a mask made from the same material as N95 respirators, less than of aerosols (m) would be filtered out. The majority of the larger droplets (m) are leaking through peripheral gap openings. It is important to note that previous studies have found that a significant number of droplets actually stick to the mask [61]. Therefore, the shown in Figure 8 could be taken as a lower limit or underestimation assuming that some of the particles stick to the inside of the mask and are not carried out the peripheral gaps by the flow. Scientists have shown that aerosols (m) are a significant transmission source, and arguably more dangerous since they linger in the air longer, can be transmitted in the flow over larger distances, and are more easily inhaled by susceptible people. Without knowledge of the distribution of the virus with respect to particle size, it is difficult to estimate the protection offered by masks accurately. The best we can do is calculate the fraction of particles (saliva) blocked by the masks and assume the viral load is constant. While it is unclear how much of the virus is contained in the small aerosol particles versus the larger droplets, from Figure 8, we see that most aerosols will go unfiltered by fabric face masks.
5. Discussion and Conclusions
A novel porous membrane model was implemented to simulate a coughing event of a subject wearing a face mask. Three different faces (female, male, and child) highlighted in a previous study [6] by the authors were examined. The face mask consisted of a simple fabric mask design and was deployed on the face using a minimum energy method model for an accurate and realistic fit, developed in the same study previously mentioned. The faces are generated systematically using a PCA method of a 3D headform model that used facial scans of 100 male and 100 female subjects [38]. A cough jet generated at the mouth has a peak velocity of 10 m/s, and the flow distribution for the different faces and mask porosities was studied.
The through-mask flow increases as mask porosity increases. Conversely, the flow leakage through the peripheral gaps increases when the porosity of the mask decreases. The female face had large gaps both at the top and bottom edges of the mask, and the leakage for this face, regardless of porosity, was significant. The male and child faces had similar gaps in the mask fit. However, the leakage for the child face was observed to be significantly less than that of the male face due to minor facial differences. Large gaps around the nose in all faces resulted in an avenue for unfiltered flow leakage. This unfiltered flow leakage significantly reduces the mask’s filtration efficiency when on the face. The fitted filtration efficiency of the masks on the different faces shows this effect, and highlights the importance of a properly fitted mask.
Author Contributions
Conceptualization, T.S. and K.S.; methodology, T.S. and K.S.; software, T.S. and K.S.; formal analysis, T.S.; investigation, T.S. and K.S.; data curation, T.S.; writing—original draft preparation, T.S.; writing—review and editing, T.S. and K.S.; visualization, T.S.; supervision, K.S.; project administration, K.S.; funding acquisition, K.S.; All authors have read and agreed to the published version of the manuscript.
Funding
This work is supported by the National Science Foundation Grant No. CBET-2034992.
Data Availability Statement
The data that support the findings of this study are available from the corresponding author upon reasonable request.
Acknowledgments
We would like to acknowledge our collaborators Kenneth Breuer and his group, for providing the initial range of Darcy coefficients which resulted from their experiments with different mask materials. We also acknowledge Rajat Mittal and Chuanxin Ni from Johns Hopkins University for the discussions we had that resulted in the representation of our results in terms of filtration efficiency. This study was made possible due to the computational resources provided by NSF’s XSEDE system.
Conflicts of Interest
The authors declare no conflict of interest.
References
- Morawska, L.; Milton, D.K. It is time to address airborne transmission of coronavirus disease 2019 (COVID-19). Clin. Infect. Dis. 2020, 71, 2311–2313. [Google Scholar] [CrossRef] [PubMed]
- Morawska, L.; Cao, J. Airborne transmission of SARS-CoV-2: The world should face the reality. Environ. Int. 2020, 139, 105730. [Google Scholar] [CrossRef] [PubMed]
- Mittal, R.; Ni, R.; Seo, J.H. The flow physics of COVID-19. J. Fluid Mech. 2020, 894, F2. [Google Scholar] [CrossRef]
- Essa, W.K.; Yasin, S.A.; Saeed, I.A.; Ali, G.A. Nanofiber-based face masks and respirators as COVID-19 protection: A review. Membranes 2021, 11, 250. [Google Scholar] [CrossRef]
- Hao, J.; Passos de Oliveira Santos, R.; Rutledge, G.C. Examination of nanoparticle filtration by filtering Facepiece respirators during the COVID-19 pandemic. ACS Appl. Nano Mater. 2021, 4, 3675–3685. [Google Scholar] [CrossRef]
- Solano, T.; Mittal, R.; Shoele, K. One size fits all?: A simulation framework for face-mask fit on population-based faces. PLoS ONE 2021, 16, e0252143. [Google Scholar] [CrossRef]
- Xi, J.; Barari, K.; Si, X.A.; Abdollahzadeh Jamalabadi, M.Y.; Park, J.H.; Rein, M. Inspiratory Leakage Flow Fraction for Surgical Masks with Varying Gaps and Filter Materials. Phys. Fluids 2022, 34, 041908. [Google Scholar] [CrossRef]
- Smith, P.B.; Agostini, G.; Mitchell, J.C. A scoping review of surgical masks and N95 filtering facepiece respirators: Learning from the past to guide the future of dentistry. Saf. Sci. 2020, 131, 104920. [Google Scholar] [CrossRef]
- Wang, T.K.; Solano, T.; Shoele, K. Bridge the gap: Correlate face mask leakage and facial features with 3D morphable face models. J. Expo. Sci. Environ. Epidemiol. 2021. [Google Scholar] [CrossRef]
- Cappa, C.D.; Asadi, S.; Barreda, S.; Wexler, A.S.; Bouvier, N.M.; Ristenpart, W.D. Expiratory aerosol particle escape from surgical masks due to imperfect sealing. Sci. Rep. 2021, 11, 12110. [Google Scholar] [CrossRef]
- Lee, L.Y.k.; Lam, E.P.w.; Chan, C.k.; Chan, S.y.; Chiu, M.k.; Chong, W.h.; Chu, K.w.; Hon, M.s.; Kwan, L.k.; Tsang, K.l.; et al. Practice and technique of using face mask amongst adults in the community: A cross-sectional descriptive study. BMC Public Health 2020, 20, 948. [Google Scholar] [CrossRef] [PubMed]
- Cook, T.M. Personal protective equipment during the coronavirus disease (COVID) 2019 pandemic—A narrative review. Anaesthesia 2020, 75, 920–927. [Google Scholar] [CrossRef] [PubMed] [Green Version]
- Eikenberry, S.E.; Mancuso, M.; Iboi, E.; Phan, T.; Eikenberry, K.; Kuang, Y.; Kostelich, E.; Gumel, A.B. To mask or not to mask: Modeling the potential for face mask use by the general public to curtail the COVID-19 pandemic. Infect. Dis. Model. 2020, 5, 293–308. [Google Scholar] [CrossRef] [PubMed]
- Leung, N.H.L.; Chu, D.K.W.; Shiu, E.Y.C.; Chan, K.H.; McDevitt, J.J.; Hau, B.J.P.; Yen, H.L.; Li, Y.; Ip, D.K.M.; Peiris, J.S.M.; et al. Respiratory virus shedding in exhaled breath and efficacy of face masks. Nat. Med. 2020, 26, 676–680. [Google Scholar] [CrossRef] [Green Version]
- MacIntyre, C.R.; Cauchemez, S.; Dwyer, D.E.; Seale, H.; Cheung, P.; Browne, G.; Fasher, M.; Wood, J.; Gao, Z.; Booy, R.; et al. Face Mask Use and Control of Respiratory Virus Transmission in Households. Emerg. Infect. Dis. 2009, 15, 233–241. [Google Scholar] [CrossRef]
- Tracht, S.M.; Del Valle, S.Y.; Hyman, J.M. Mathematical Modeling of the Effectiveness of Facemasks in Reducing the Spread of Novel Influenza A (H1N1). PLoS ONE 2010, 5, e9018. [Google Scholar] [CrossRef]
- Davies, A.; Thompson, K.A.; Giri, K.; Kafatos, G.; Walker, J.; Bennett, A. Testing the Efficacy of Homemade Masks: Would They Protect in an Influenza Pandemic? Disaster Med. Public Health Prep. 2013, 7, 413–418. [Google Scholar] [CrossRef]
- Driessche, K.V.; Hens, N.; Tilley, P.; Quon, B.S.; Chilvers, M.A.; de Groot, R.; Cotton, M.F.; Marais, B.J.; Speert, D.P.; Zlosnik, J.E.A. Surgical Masks Reduce Airborne Spread of Pseudomonas aeruginosa in Colonized Patients with Cystic Fibrosis. Am. J. Respir. Crit. Care Med. 2015, 192, 897–899. [Google Scholar] [CrossRef]
- Stockwell, R.E.; Wood, M.E.; He, C.; Sherrard, L.J.; Ballard, E.L.; Kidd, T.J.; Johnson, G.R.; Knibbs, L.D.; Morawska, L.; Bell, S.C.; et al. Face Masks Reduce the Release of Pseudomonas aeruginosa Cough Aerosols When Worn for Clinically Relevant Periods. Am. J. Respir. Crit. Care Med. 2018, 198, 1339–1342. [Google Scholar] [CrossRef] [Green Version]
- van der Sande, M.; Teunis, P.; Sabel, R. Professional and Home-Made Face Masks Reduce Exposure to Respiratory Infections among the General Population. PLoS ONE 2008, 3, e2618. [Google Scholar] [CrossRef] [Green Version]
- Viola, I.M.; Peterson, B.; Pisetta, G.; Pavar, G.; Akhtar, H.; Menoloascina, F.; Mangano, E.; Dunn, K.E.; Gabl, R.; Nila, A.; et al. Face Coverings, Aerosol Dispersion and Mitigation of Virus Transmission Risk. IEEE Open J. Eng. Med. Biol. 2021, 2, 26–35. [Google Scholar] [CrossRef] [PubMed]
- Oestenstad, R.K.; Dillion, H.K.; Perkins, L.L. Distribution of Faceseal Leak Sites on a Half-Mask Respirator and Their Association with Facial Dimensions. Am. Ind. Hyg. Assoc. J. 1990, 51, 285–290. [Google Scholar] [CrossRef] [PubMed]
- Oestenstad, R.K.; Bartolucci, A.A. Factors Affecting the Location and Shape of Face Seal Leak Sites on Half-Mask Respirators. J. Occup. Environ. Hyg. 2010, 7, 332–341. [Google Scholar] [CrossRef] [PubMed]
- Zhuang, Z.; Landsittel, D.; Benson, S.; Roberge, R.; Shaffer, R. Facial anthropometric differences among gender, ethnicity, and age groups. Ann. Occup. Hyg. 2010, 54, 391–402. [Google Scholar] [PubMed] [Green Version]
- O’Kelly, E.; Arora, A.; Pirog, S.; Ward, J.; Clarkson, P.J. Comparing the fit of N95, KN95, surgical, and cloth face masks and assessing the accuracy of fit checking. PLoS ONE 2021, 16, e0245688. [Google Scholar] [CrossRef] [PubMed]
- Hariharan, P.; Sharma, N.; Guha, S.; Banerjee, R.K.; D’Souza, G.; Myers, M.R. A computational model for predicting changes in infection dynamics due to leakage through N95 respirators. Sci. Rep. 2021, 11, 10690. [Google Scholar] [CrossRef] [PubMed]
- Chopra, J.; Abiakam, N.; Kim, H.; Metcalf, C.; Worsley, P.; Cheong, Y. The influence of gender and ethnicity on facemasks and respiratory protective equipment fit: A systematic review and meta-analysis. BMJ Glob. Health 2021, 6, e005537. [Google Scholar] [CrossRef]
- Nold, J.; Metzger, M.C.; Schwarz, S.; Wesemann, C.; Wemken, G.; Pieralli, S.; Kernen, F.; Weingart, J.; Schirmeister, C.G.; Schumann, S.; et al. Air seal performance of personalized and statistically shaped 3D-printed face masks compared with market-available surgical and FFP2 masks. Sci. Rep. 2021, 11, 19347. [Google Scholar] [CrossRef]
- Riutord-Sbert, P.; Pereira, T.C.; de Pedro-Gómez, J.E.; González-Carrasco, D.; López-Gónzalez, A.A.; Barkvoll, P. Study of the use of a personalized peripheral sealing device on surgical face masks in high-risk situations against COVID-19. PLoS ONE 2021, 16, e0253382. [Google Scholar] [CrossRef]
- Hyun, C.; Jensen, M.M.; Yang, K.; Weaver, J.C.; Wang, X.; Kudo, Y.; Gordon, S.J.; Karp, J.M.; Samir, A.E. The Ultra Fit Community Mask-Toward Maximal Respiratory Protection via Personalized Face Fit. medRxiv 2021. [Google Scholar] [CrossRef]
- Swennen, G.R.; Pottel, L.; Haers, P.E. Custom-made 3D-printed face masks in case of pandemic crisis situations with a lack of commercially available FFP2/3 masks. Int. J. Oral Maxillofac. Surg. 2020, 49, 673–677. [Google Scholar] [CrossRef] [PubMed]
- Chen, X.; Xi, Q.; Lu, W.; Sun, F.; Wang, L.; Zhang, L.; Wu, G. A Customized Mask Retainer and Its Effects on Improving the Fit Performance of Surgical Masks. 2021. Available online: https://pesquisa.bvsalud.org/global-literature-on-novel-coronavirus-2019-ncov/resource/pt/ppcovidwho-308282 (accessed on 10 May 2022).
- Chiera, S.; Cristoforetti, A.; Benedetti, L.; Nollo, G.; Borro, L.; Mazzei, L.; Tessarolo, F. A Simple Method to Quantify Outward Leakage of Medical Face Masks and Barrier Face Coverings: Implication for the Overall Filtration Efficiency. Int. J. Environ. Res. Public Health 2022, 19, 3548. [Google Scholar] [CrossRef] [PubMed]
- Schmitt, J.; Wang, J. Quantitative modeling of the impact of facemasks and associated leakage on the airborne transmission of SARS-CoV-2. Sci. Rep. 2021, 11, 19403. [Google Scholar] [CrossRef] [PubMed]
- Ni, C.; Solano, T.; Wang, T.K.; Seo, J.H.; Shoele, K.; Breuer, K.; Mittal, R. Simple Models of Face Mask Aerodynamics to Quantify Effects of Peripheral Leaks on Mask Effectiveness. Bull. Am. Phys. Soc. 2021, A01, 006. [Google Scholar]
- Boraey, M.A. An analytical model for the effective filtration efficiency of single and multiple face masks considering leakage. Chaos Solitons Fractals 2021, 152, 111466. [Google Scholar] [CrossRef]
- Freitag, S.; Howell, S.G.; Jim, K.T. Estimating the reduction in SARS-CoV-2 viral load by common face masks with a simple leak model. Aerosol Sci. Technol. 2022, 573–591. [Google Scholar] [CrossRef]
- Paysan, P.; Knothe, R.; Amberg, B.; Romdhani, S.; Vetter, T. A 3D Face Model for Pose and Illumination Invariant Face Recognition. In Proceedings of the 2009 Sixth IEEE International Conference on Advanced Video and Signal Based Surveillance, Genova, Italy, 2–4 September 2009; IEEE: Genova, Italy, 2009; pp. 296–301. [Google Scholar] [CrossRef]
- Lei, Z.; Yang, J. Effects of head movement on contact pressure between a N95 respirator and headform. In Advances in Affective and Pleasurable Design; CRC Press: Boca Raton, FL, USA, 2012; p. 10. [Google Scholar]
- Mittal, R.; Meneveau, C.; Wu, W. A mathematical framework for estimating risk of airborne transmission of COVID-19 with application to face mask use and social distancing. Phys. Fluids 2020, 32, 101903. [Google Scholar] [CrossRef]
- Gupta, J.K.; Lin, C.H.; Chen, Q. Flow dynamics and characterization of a cough. Indoor Air 2009, 19, 517–525. [Google Scholar] [CrossRef]
- Tang, J.W.; Settles, G.S. Coughing and aerosols. N. Engl. J. Med. 2008, 359, e19. [Google Scholar] [CrossRef]
- Piirila, P.; Sovijarvi, A. Objective assessment of cough. Eur. Respir. J. 1995, 8, 1949–1956. [Google Scholar] [CrossRef]
- McCool, F.D. Global physiology and pathophysiology of cough: ACCP evidence-based clinical practice guidelines. Chest 2006, 129, 48S–53S. [Google Scholar] [CrossRef] [PubMed]
- Zangmeister, C.D.; Radney, J.G.; Vicenzi, E.P.; Weaver, J.L. Filtration Efficiencies of Nanoscale Aerosol by Cloth Mask Materials Used to Slow the Spread of SARS-CoV-2. ACS Nano 2020, 14, 9188–9200. [Google Scholar] [CrossRef] [PubMed]
- Konda, A.; Prakash, A.; Moss, G.A.; Schmoldt, M.; Grant, G.D.; Guha, S. Response to Letters to the Editor on Aerosol Filtration Efficiency of Common Fabrics Used in Respiratory Cloth Masks: Revised and Expanded Results. ACS Nano 2020, 14, 10764–10770. [Google Scholar] [CrossRef] [PubMed]
- Duncan, S.; Bodurtha, P.; Naqvi, S. The protective performance of reusable cloth face masks, disposable procedure masks, KN95 masks and N95 respirators: Filtration and total inward leakage. PLoS ONE 2021, 16, e0258191. [Google Scholar] [CrossRef] [PubMed]
- Mittal, R.; Dong, H.; Bozkurttas, M.; Najjar, F.; Vargas, A.; Von Loebbecke, A. A versatile sharp interface immersed boundary method for incompressible flows with complex boundaries. J. Comput. Phys. 2008, 227, 4825–4852. [Google Scholar] [CrossRef] [PubMed] [Green Version]
- Solano, T.; Ni, C.; Mittal, R.; Shoele, K. Perimeter leakage of face masks and its effect on the mask’s efficacy. Phys. Fluids 2022, 34, 051902. [Google Scholar] [CrossRef]
- Goldstein, D.; Handler, R.; Sirovich, L. Modeling a no-slip flow boundary with an external force field. J. Comput. Phys. 1993, 105, 354–366. [Google Scholar] [CrossRef] [Green Version]
- Seo, J.H.; Mittal, R. A sharp-interface immersed boundary method with improved mass conservation and reduced spurious pressure oscillations. J. Comput. Phys. 2011, 230, 7347–7363. [Google Scholar] [CrossRef] [Green Version]
- Shoele, K.; Mittal, R. Computational study of flow-induced vibration of a reed in a channel and effect on convective heat transfer. Phys. Fluids 2014, 26, 127103. [Google Scholar] [CrossRef]
- Choi, H.; Moin, P. Effects of the computational time step on numerical solutions of turbulent flow. J. Comput. Phys. 1994, 113, 1–4. [Google Scholar] [CrossRef]
- Arumuru, V.; Pasa, J.; Samantaray, S.S. Experimental visualization of sneezing and efficacy of face masks and shields. Phys. Fluids 2020, 32, 115129. [Google Scholar] [CrossRef] [PubMed]
- Staymates, M. Flow visualization of an N95 respirator with and without an exhalation valve using schlieren imaging and light scattering. Phys. Fluids 2020, 32, 111703. [Google Scholar] [CrossRef] [PubMed]
- Margolin, L.G.; Rider, W.J.; Grinstein, F.F. Modeling turbulent flow with implicit LES. J. Turbul. 2006, N15. [Google Scholar] [CrossRef]
- Morais, F.G.; Sakano, V.K.; de Lima, L.N.; Franco, M.A.; Reis, D.C.; Zanchetta, L.M.; Jorge, F.; Landulfo, E.; Catalani, L.H.; Barbosa, H.M.J.; et al. Filtration efficiency of a large set of COVID-19 face masks commonly used in Brazil. Aerosol Sci. Technol. 2021, 55, 1028–1041. [Google Scholar] [CrossRef]
- Hancock, J.N.; Plumley, M.J.; Schilling, K.; Sheets, D.; Wilen, L. Comment on “Aerosol Filtration Efficiency of Common Fabrics Used in Respiratory Cloth Masks”. ACS Nano 2020, 14, 10758–10763. [Google Scholar] [CrossRef] [PubMed]
- Sickbert-Bennett, E.E.; Samet, J.M.; Clapp, P.W.; Chen, H.; Berntsen, J.; Zeman, K.L.; Tong, H.; Weber, D.J.; Bennett, W.D. Filtration efficiency of hospital face mask alternatives available for use during the COVID-19 pandemic. JAMA Intern. Med. 2020, 180, 1607–1612. [Google Scholar] [CrossRef]
- Buonanno, G.; Stabile, L.; Morawska, L. Estimation of airborne viral emission: Quanta emission rate of SARS-CoV-2 for infection risk assessment. Environ. Int. 2020, 141, 105794. [Google Scholar] [CrossRef]
- Dbouk, T.; Drikakis, D. On respiratory droplets and face masks. Phys. Fluids 2020, 32, 063303. [Google Scholar] [CrossRef]
- Duguid, J.P. The size and the duration of air-carriage of respiratory droplets and droplet-nuclei. Epidemiol. Infect. 1946, 44, 471–479. [Google Scholar] [CrossRef] [Green Version]
- Verma, S.; Dhanak, M.; Frankenfield, J. Visualizing the effectiveness of face masks in obstructing respiratory jets. Phys. Fluids 2020, 32, 061708. [Google Scholar] [CrossRef]
- Hui, D.S.; Chow, B.K.; Chu, L.; Ng, S.S.; Lee, N.; Gin, T.; Chan, M.T.V. Exhaled Air Dispersion during Coughing with and without Wearing a Surgical or N95 Mask. PLoS ONE 2012, 7, e50845. [Google Scholar] [CrossRef] [PubMed]
- Konda, A.; Prakash, A.; Moss, G.A.; Schmoldt, M.; Grant, G.D.; Guha, S. Aerosol Filtration Efficiency of Common Fabrics Used in Respiratory Cloth Masks. ACS Nano 2020, 14, 6339–6347. [Google Scholar] [CrossRef] [PubMed]
- Shah, Y.; Kurelek, J.W.; Peterson, S.D.; Yarusevych, S. Experimental investigation of indoor aerosol dispersion and accumulation in the context of COVID-19: Effects of masks and ventilation. Phys. Fluids 2021, 33, 073315. [Google Scholar] [CrossRef] [PubMed]
Figure 1.
(a) Female (b) male, and (c) child faces considered in this study.

Figure 2.
(a) Cough jet velocity evolution. Inset shows the location of the impulsively started cough-jet condition. (b) filtration efficiency of different fabric masks as a function of particle size. A second-order rational polynomial is fitted to represent the mean of the data from literature [45,46,47] for each particle size.

Figure 3.
Time evolution of the flow during a coughing episode for a female (left), male (center) and child (right) face with a porous masks ( Pa·s/m). Front and side views of the iso-surface contours of velocity magnitude over time.
Figure 3.
Time evolution of the flow during a coughing episode for a female (left), male (center) and child (right) face with a porous masks ( Pa·s/m). Front and side views of the iso-surface contours of velocity magnitude over time.

Figure 4.
Time evolution of (a) through-mask flow and (b) gap leakage flow during a coughing episode for mask with porosity Pa·s/m.
Figure 4.
Time evolution of (a) through-mask flow and (b) gap leakage flow during a coughing episode for mask with porosity Pa·s/m.

Figure 5.
Iso-surface contours of velocity magnitude at the time of peak cough velocity for the three faces and three mask porosities considered.
Figure 5.
Iso-surface contours of velocity magnitude at the time of peak cough velocity for the three faces and three mask porosities considered.

Figure 6.
Volume flow rates for different mask porosities. (a) through the mask, (b) through the peripheral gaps, and (c) the average velocity through the top gap for female (☐), male (◯), and child (△) faces.
Figure 6.
Volume flow rates for different mask porosities. (a) through the mask, (b) through the peripheral gaps, and (c) the average velocity through the top gap for female (☐), male (◯), and child (△) faces.

Figure 7.
The fitted filtration efficiency as a function of porosity and mask filtration efficiency for (a) female face, (b) male face, and (c) child face.
Figure 7.
The fitted filtration efficiency as a function of porosity and mask filtration efficiency for (a) female face, (b) male face, and (c) child face.

Figure 8.
The fitted filtration efficiency as a function of porosity and particle size for (a) female face, (b) male face, and (c) child face.
Figure 8.
The fitted filtration efficiency as a function of porosity and particle size for (a) female face, (b) male face, and (c) child face.

Publisher’s Note: MDPI stays neutral with regard to jurisdictional claims in published maps and institutional affiliations. |
© 2022 by the authors. Licensee MDPI, Basel, Switzerland. This article is an open access article distributed under the terms and conditions of the Creative Commons Attribution (CC BY) license (https://creativecommons.org/licenses/by/4.0/).
Share and Cite
MDPI and ACS Style
Solano, T.; Shoele, K. Investigation of the Role of Face Shape on the Flow Dynamics and Effectiveness of Face Masks. Fluids 2022, 7, 209. https://0-doi-org.brum.beds.ac.uk/10.3390/fluids7060209
AMA Style
Solano T, Shoele K. Investigation of the Role of Face Shape on the Flow Dynamics and Effectiveness of Face Masks. Fluids. 2022; 7(6):209. https://0-doi-org.brum.beds.ac.uk/10.3390/fluids7060209
Chicago/Turabian StyleSolano, Tomas, and Kourosh Shoele. 2022. "Investigation of the Role of Face Shape on the Flow Dynamics and Effectiveness of Face Masks" Fluids 7, no. 6: 209. https://0-doi-org.brum.beds.ac.uk/10.3390/fluids7060209