
Incorporation of Modeling, Simulation, and Game-Based Learning in Engineering Dynamics Education towards Improving Vehicle Design and Driver Safety


Abstract
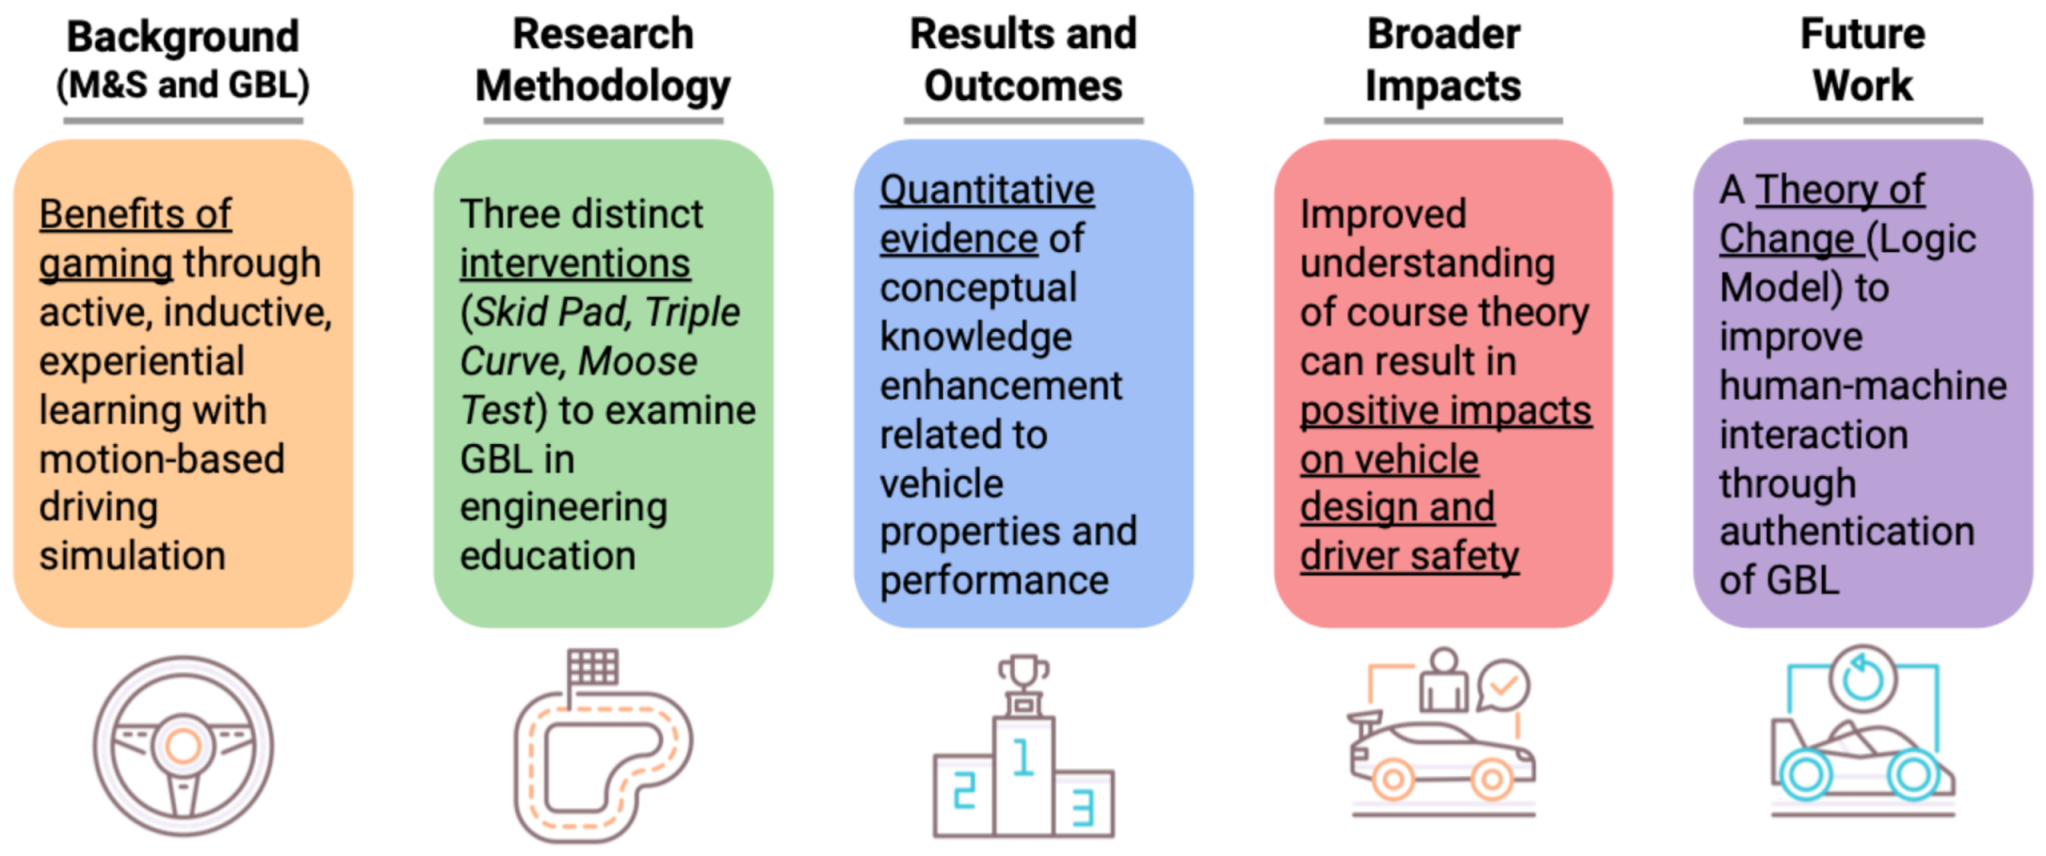
:1. Background
2. Research Methodology
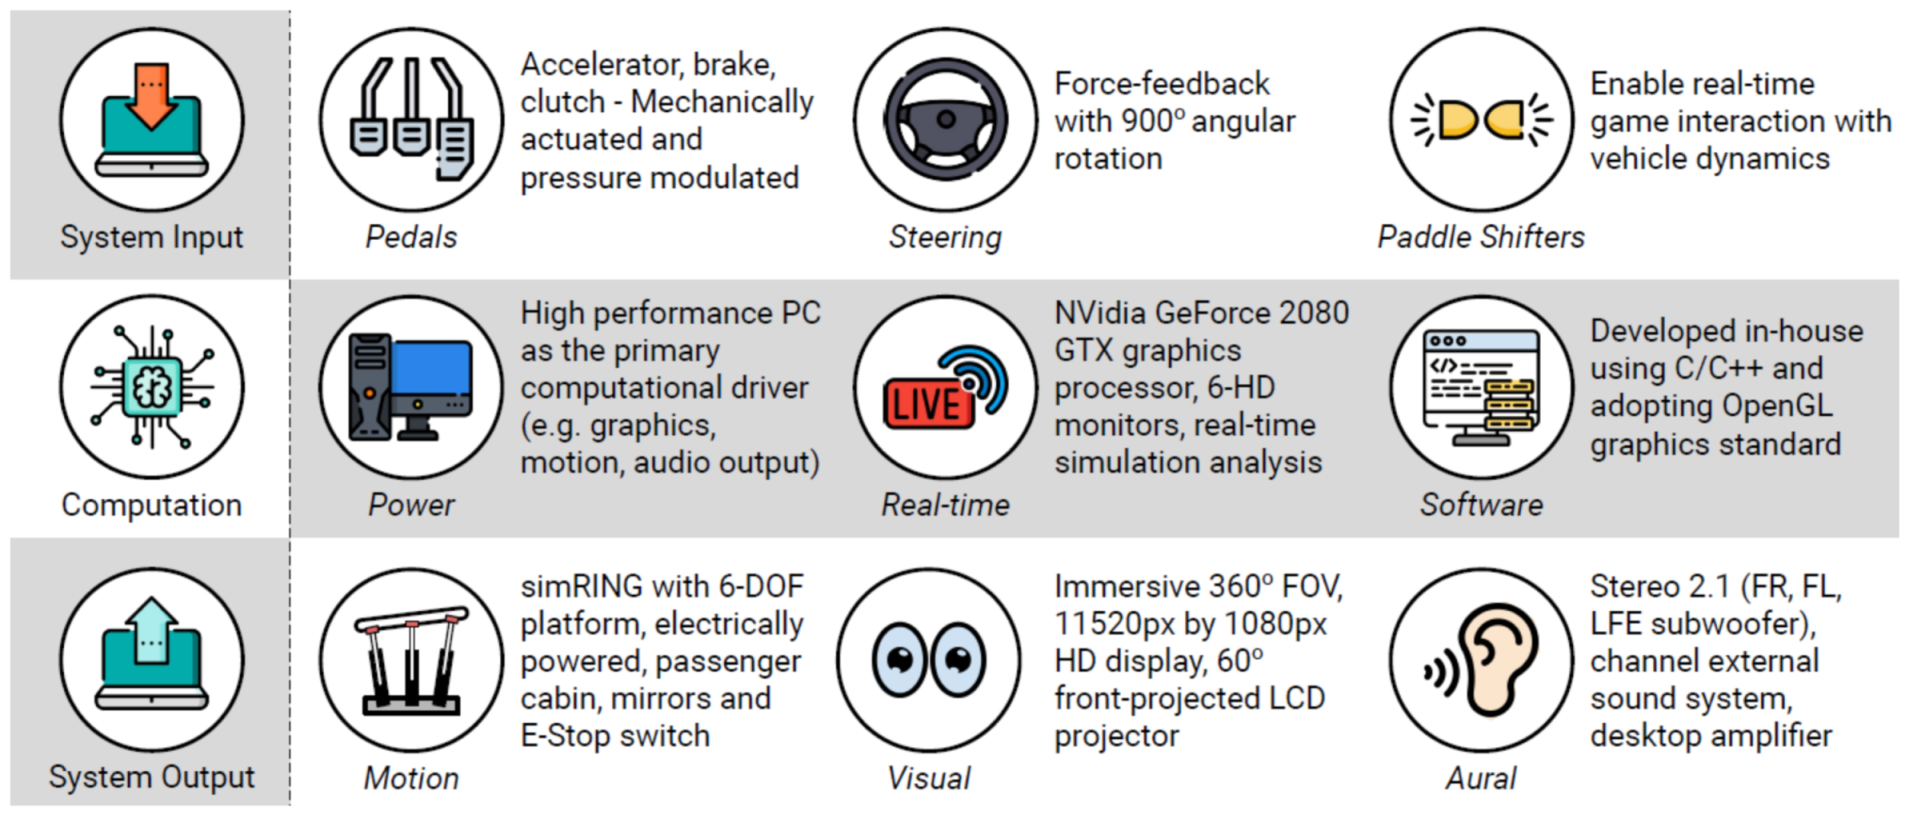
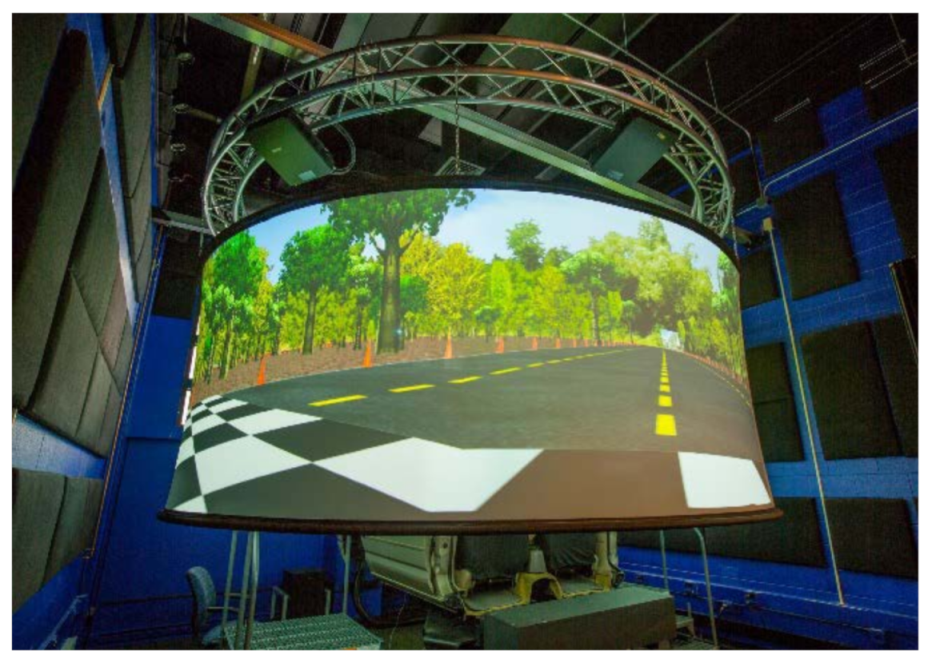
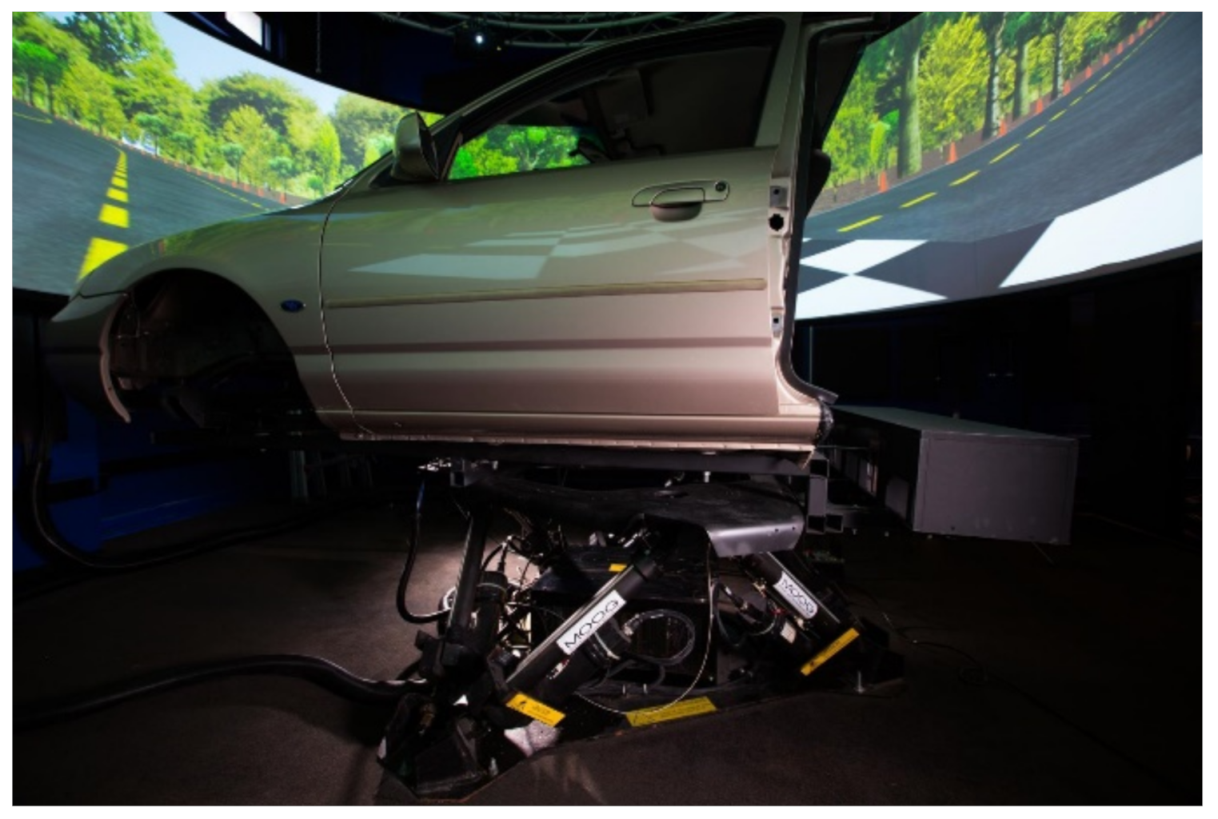
2.1. Experimental Facilities and Design
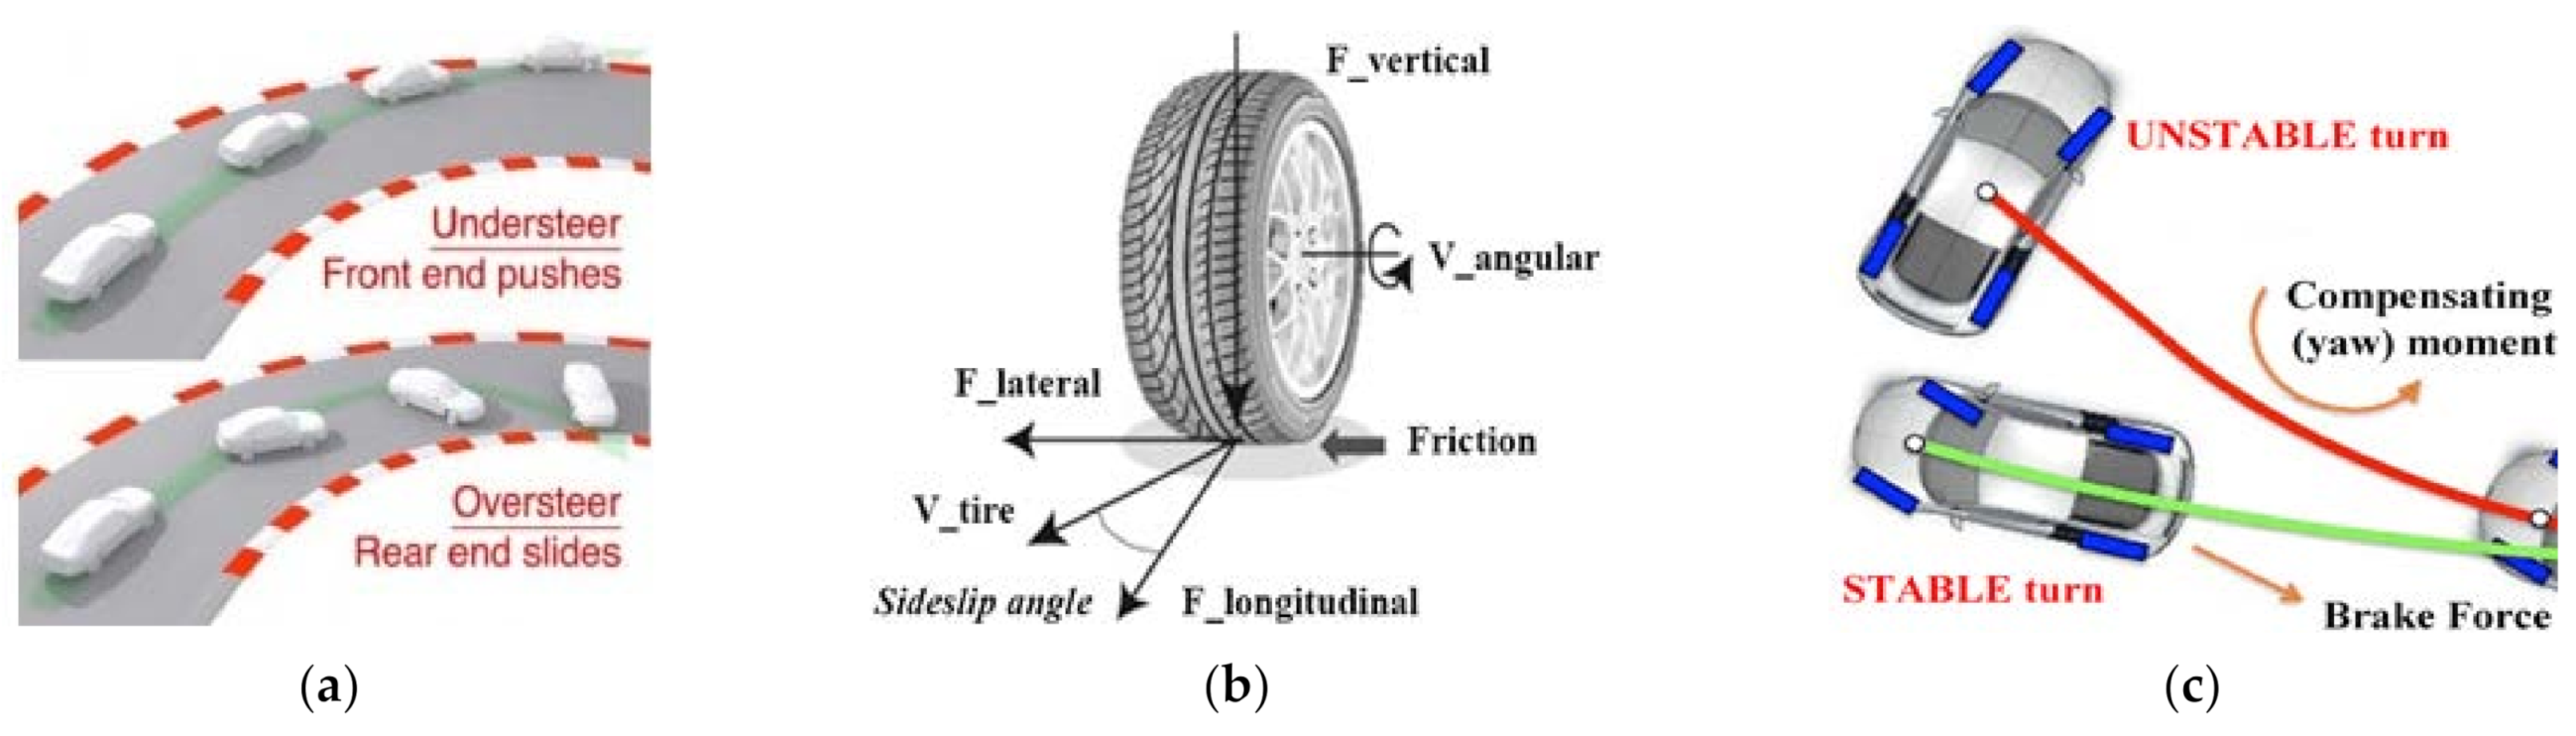
2.2. Skid Pad Intervention
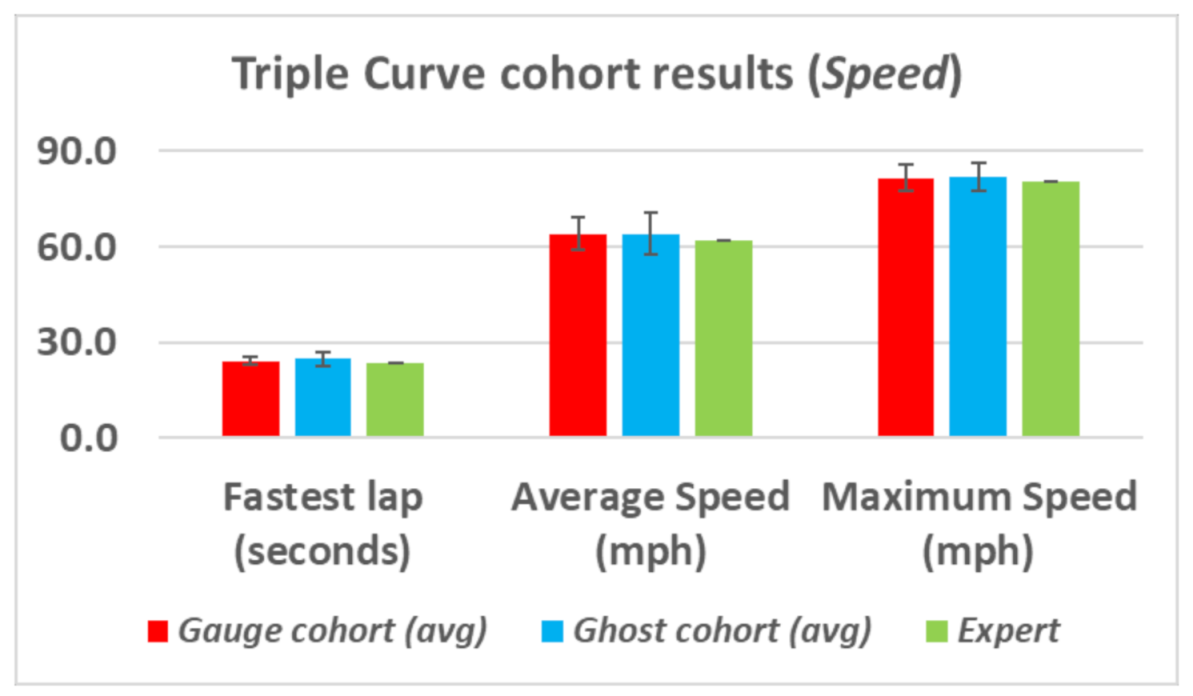
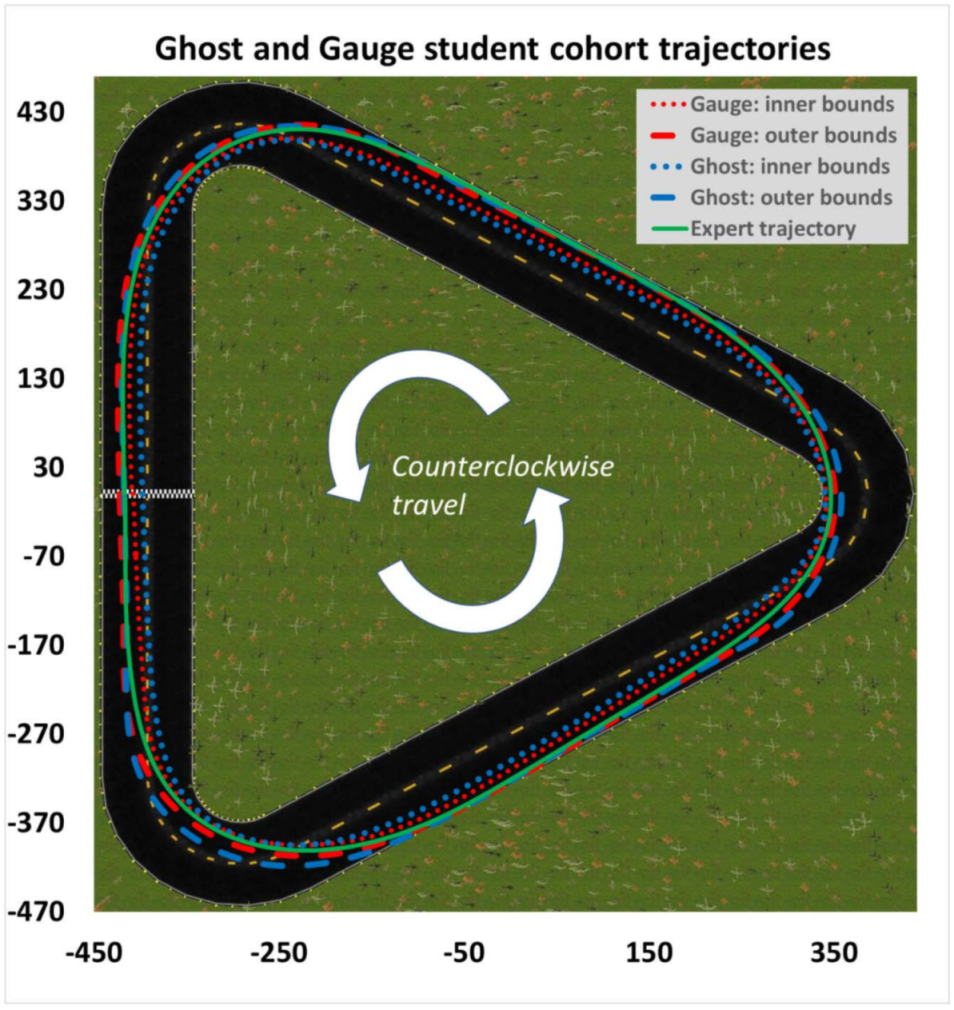
2.3. Triple Curve Intervention
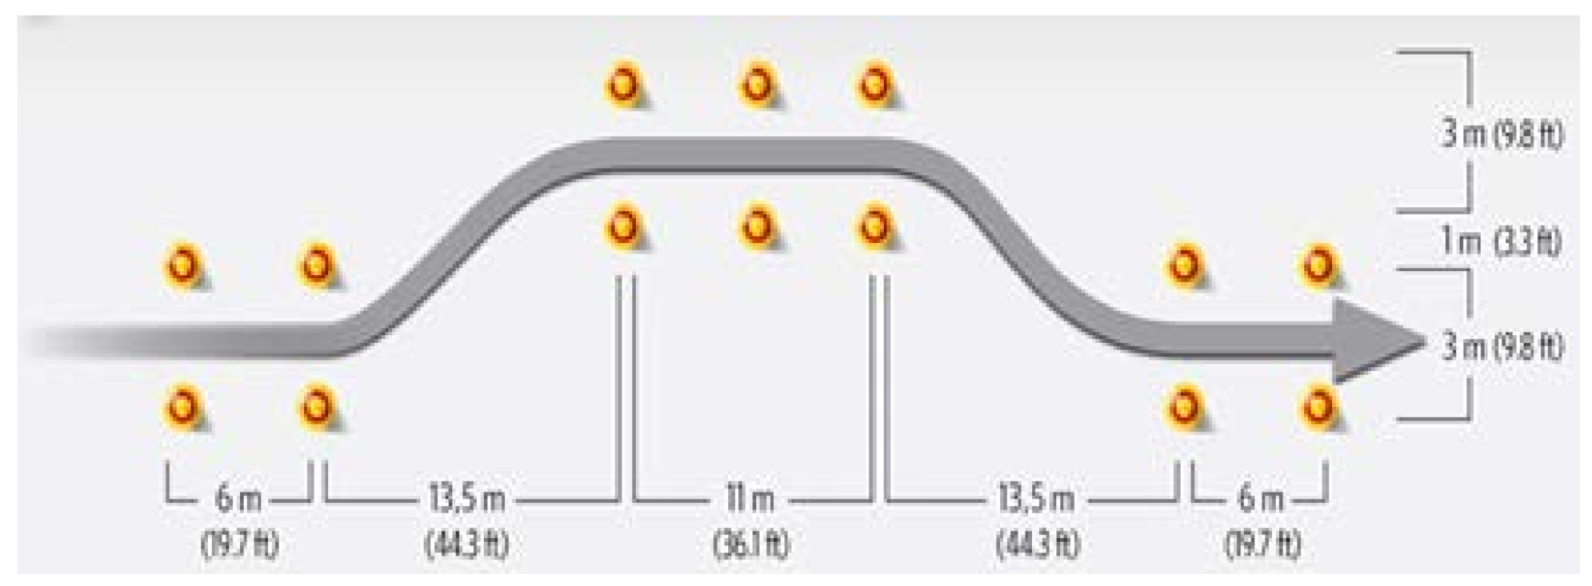
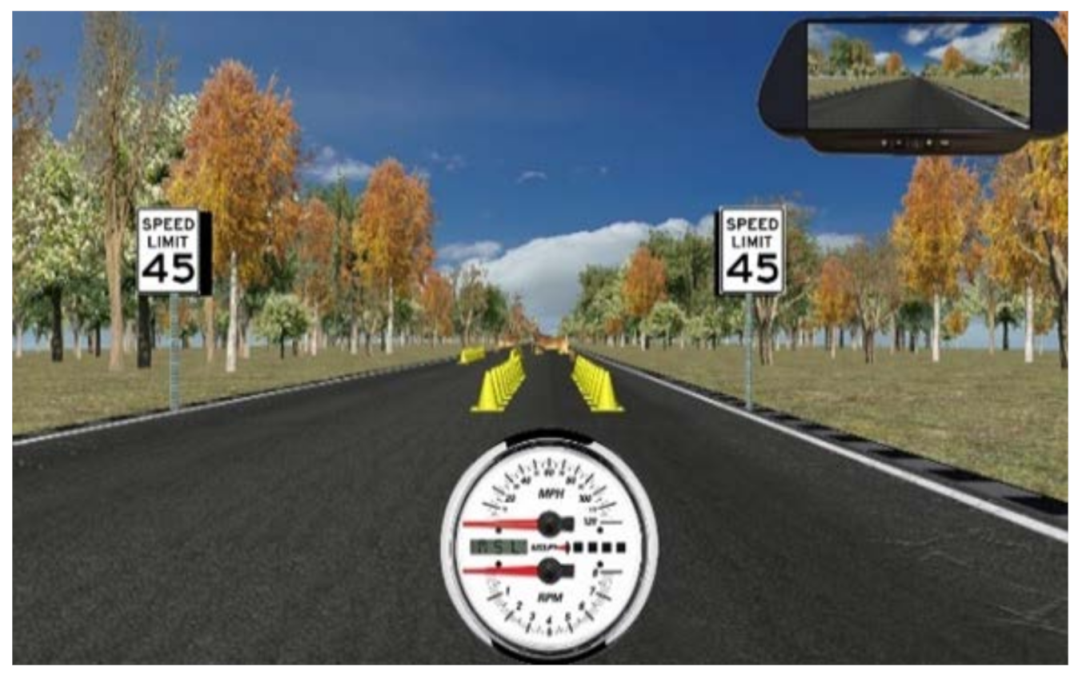
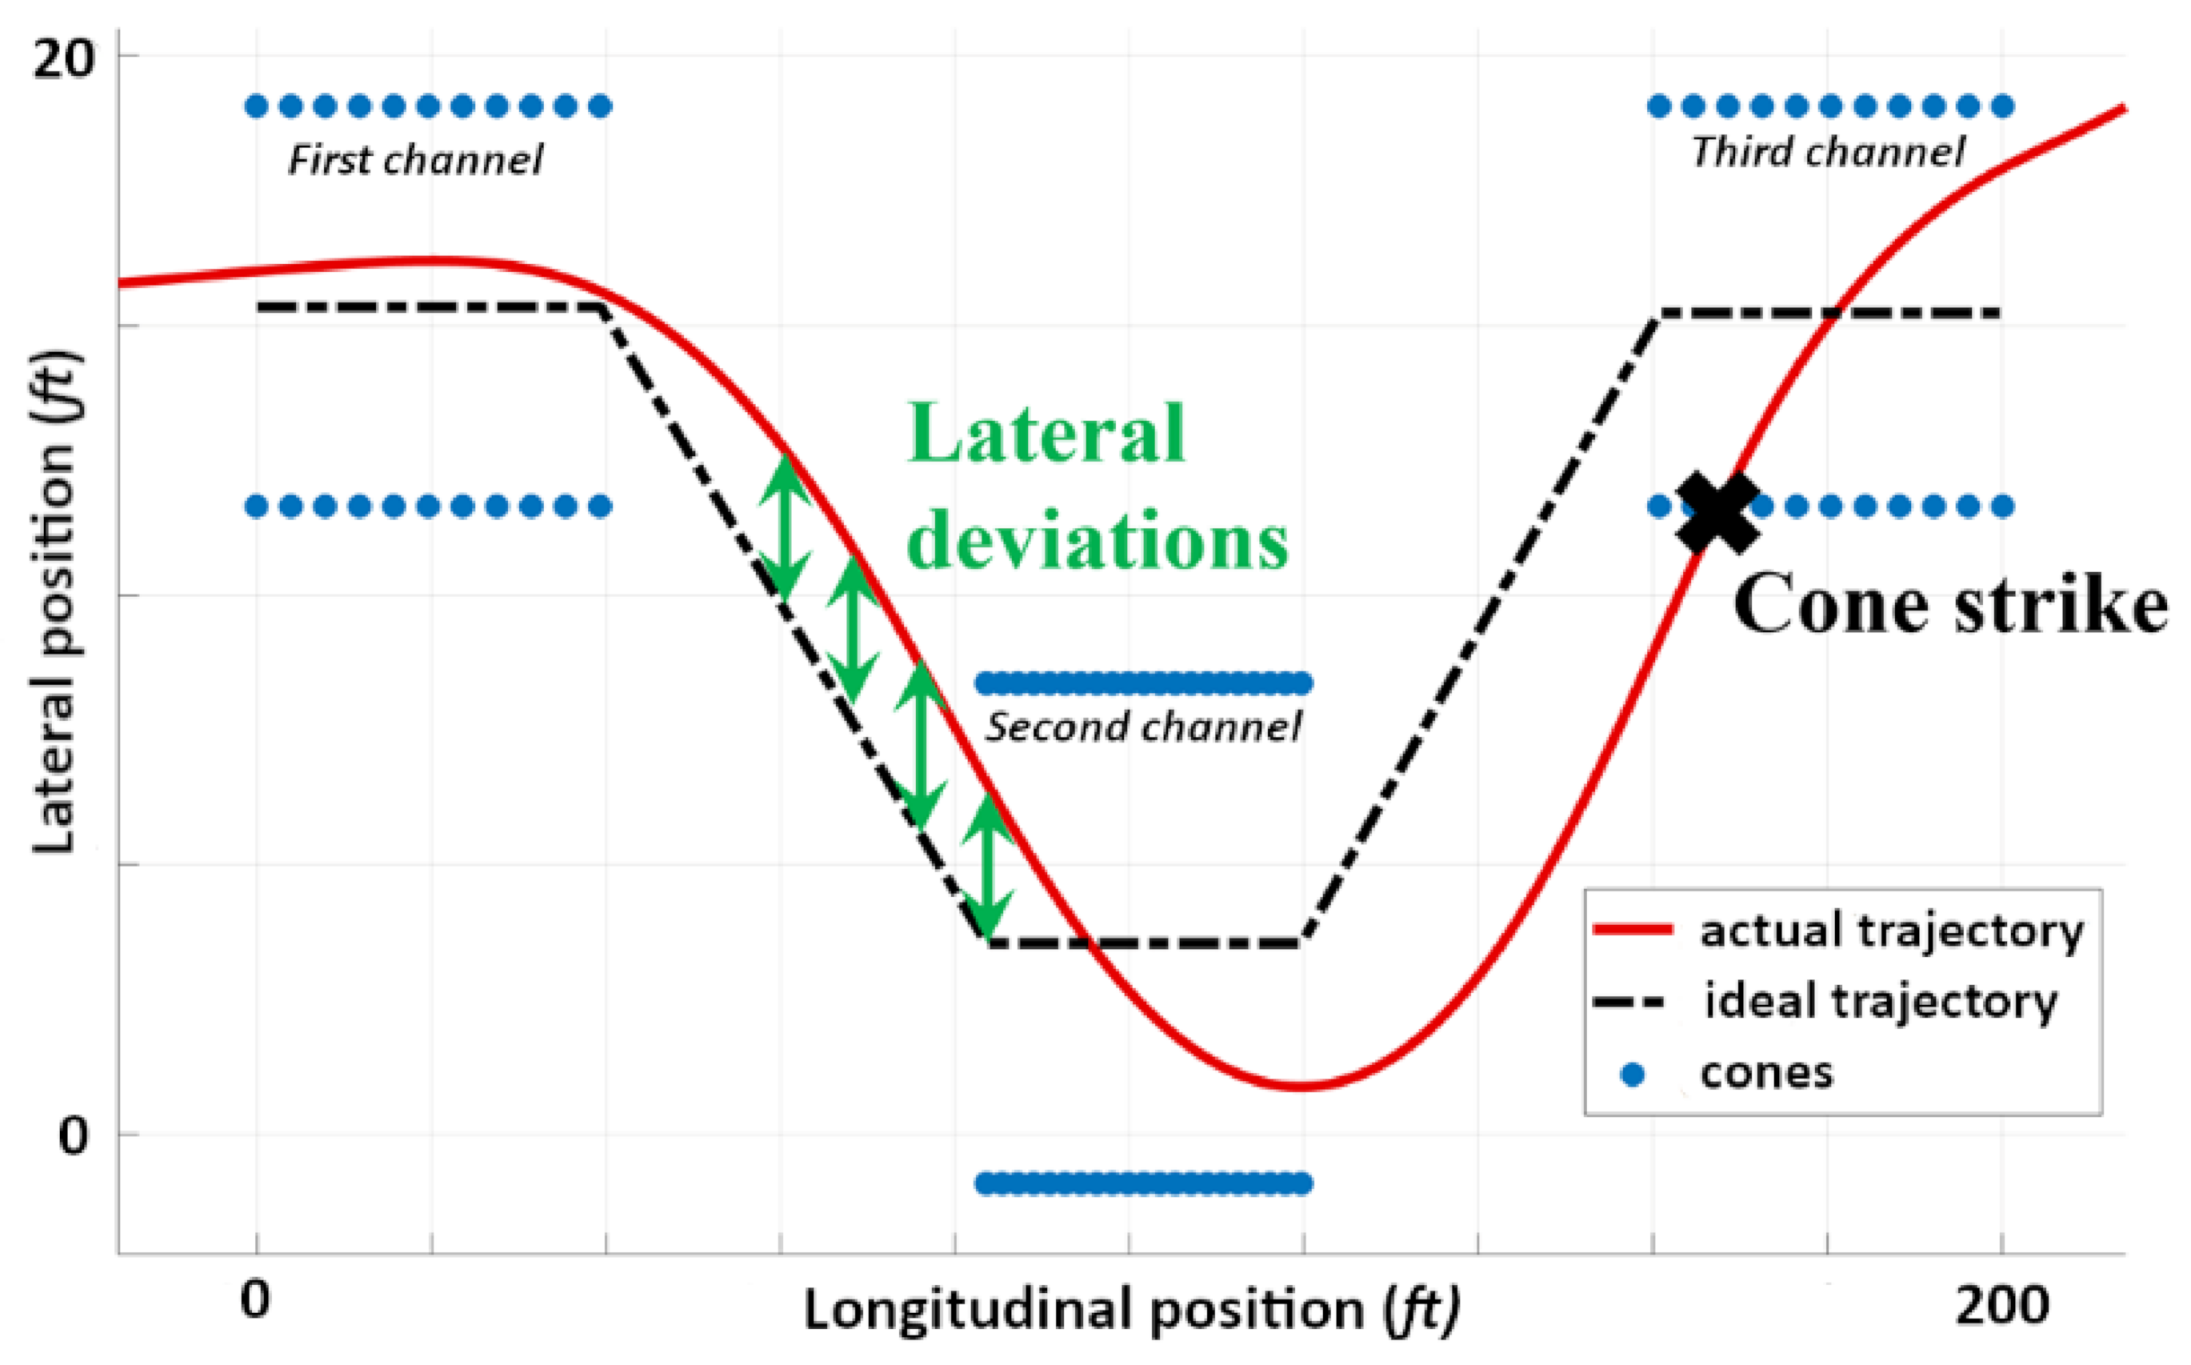
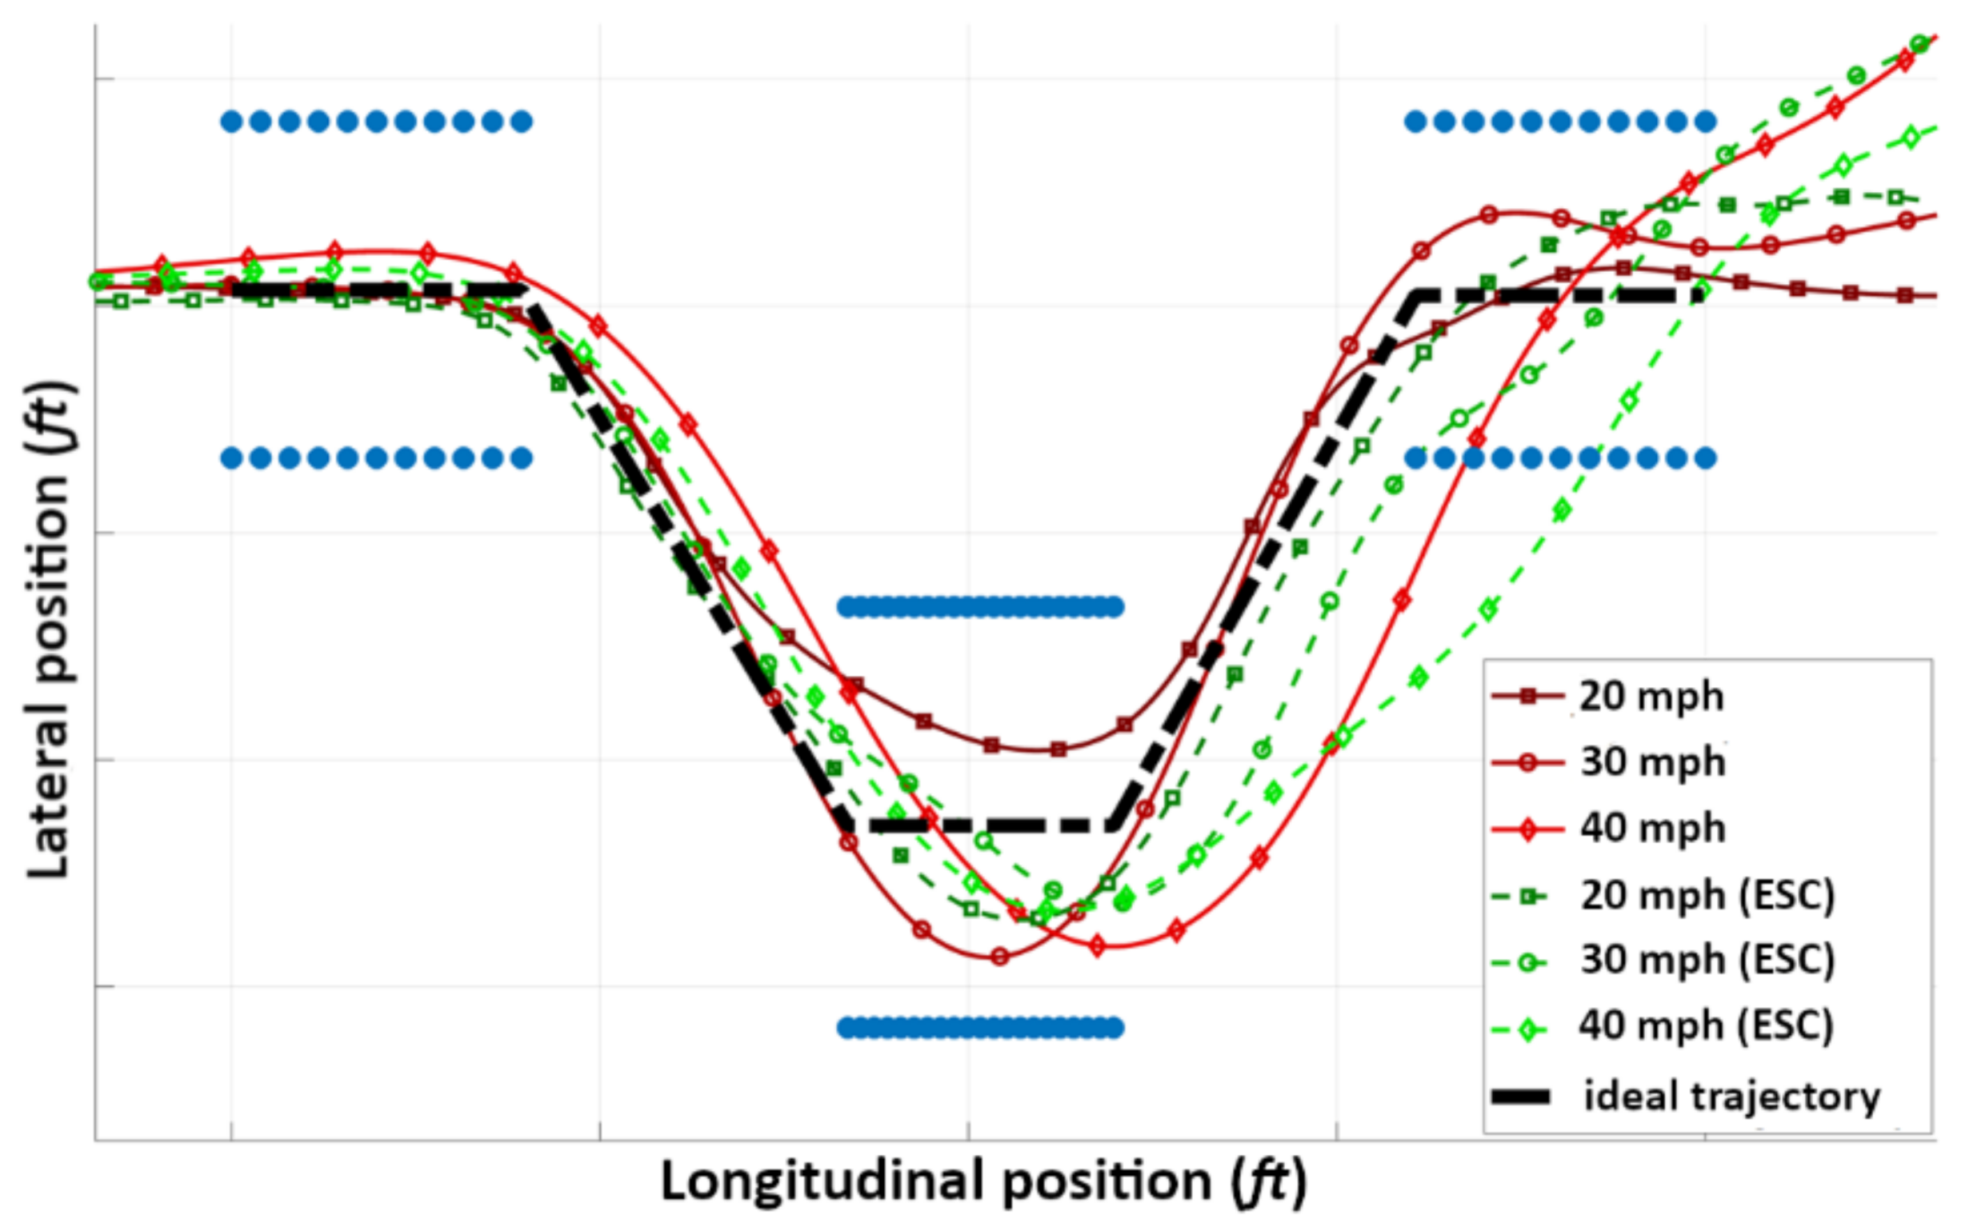
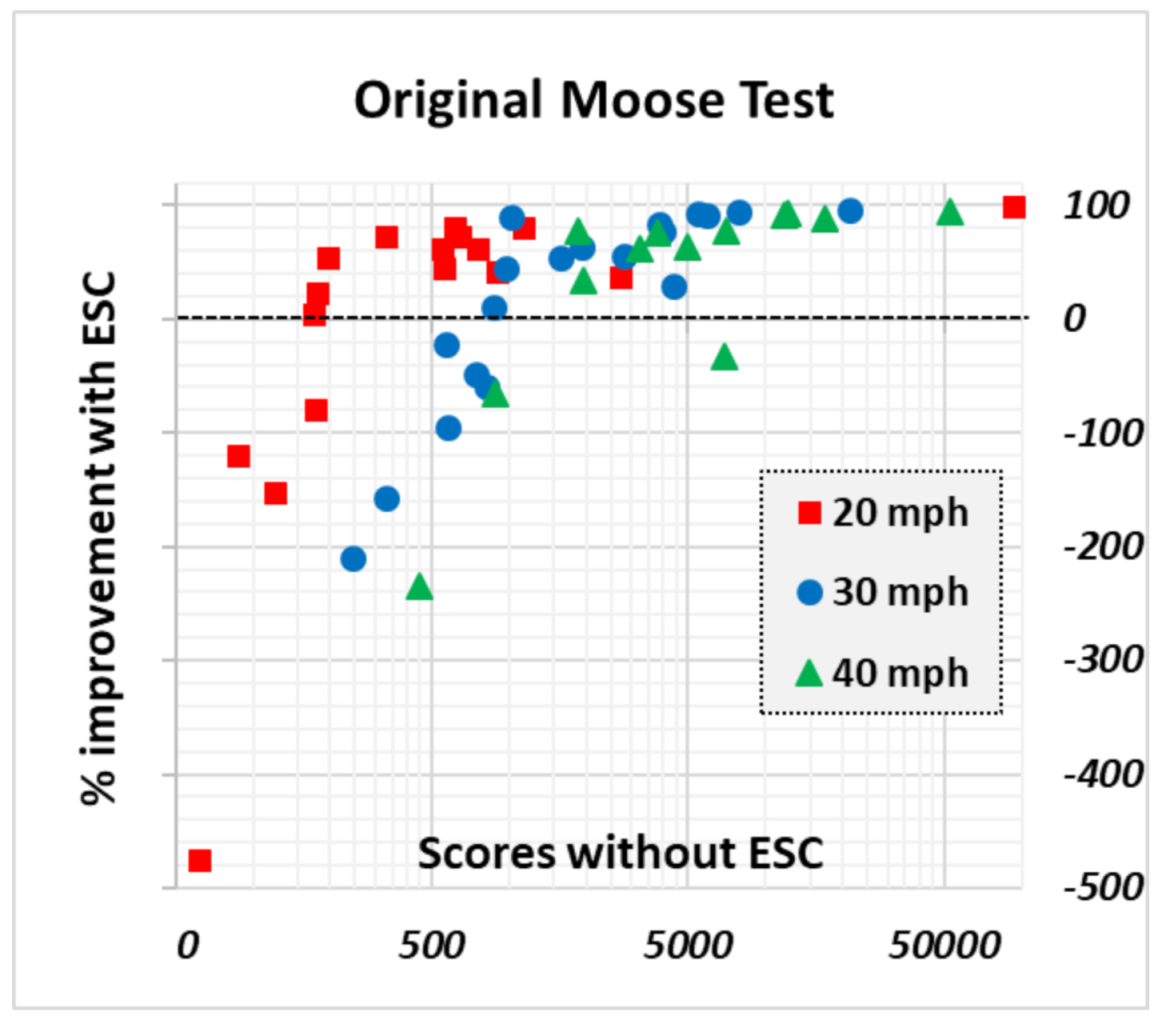
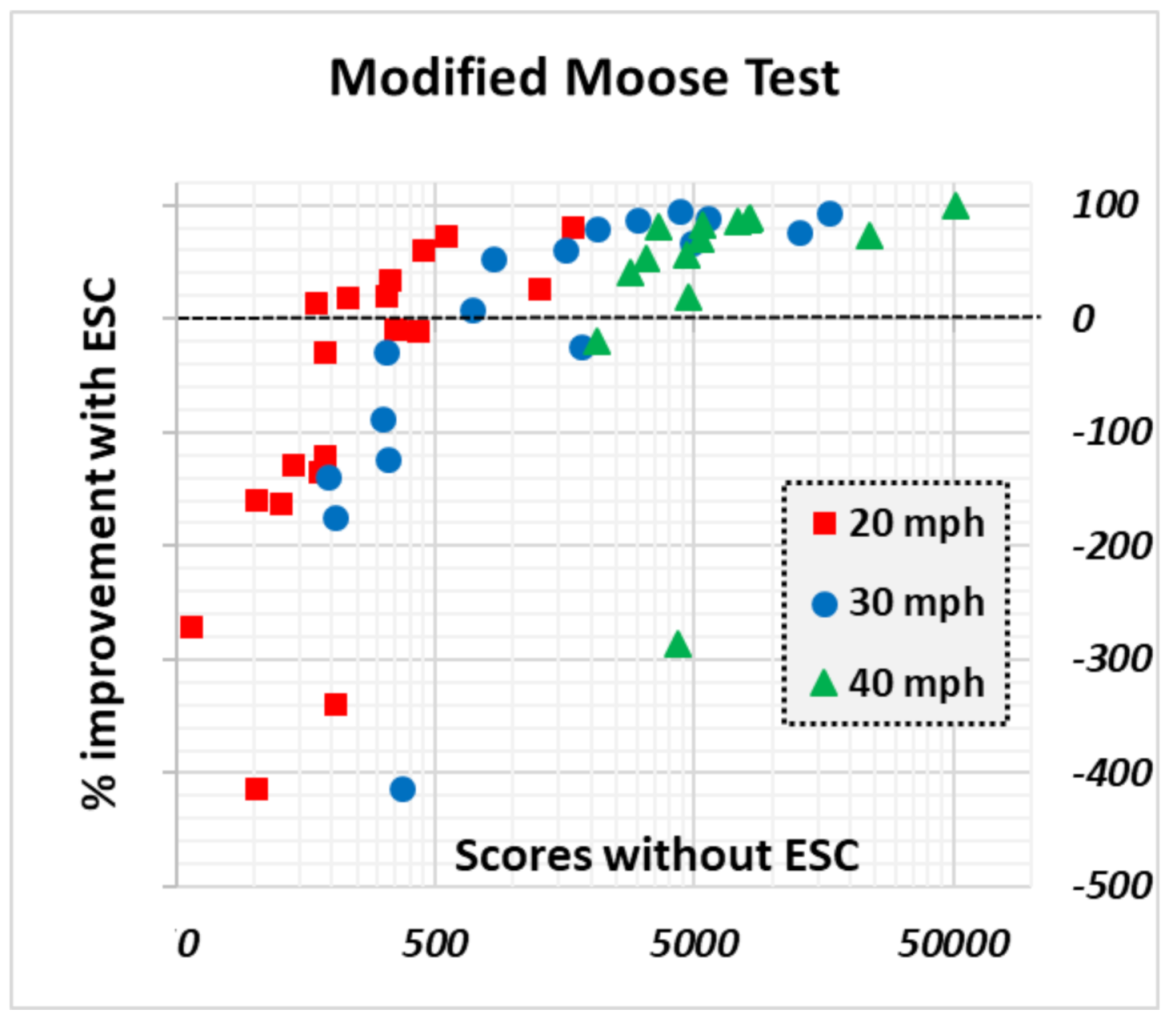
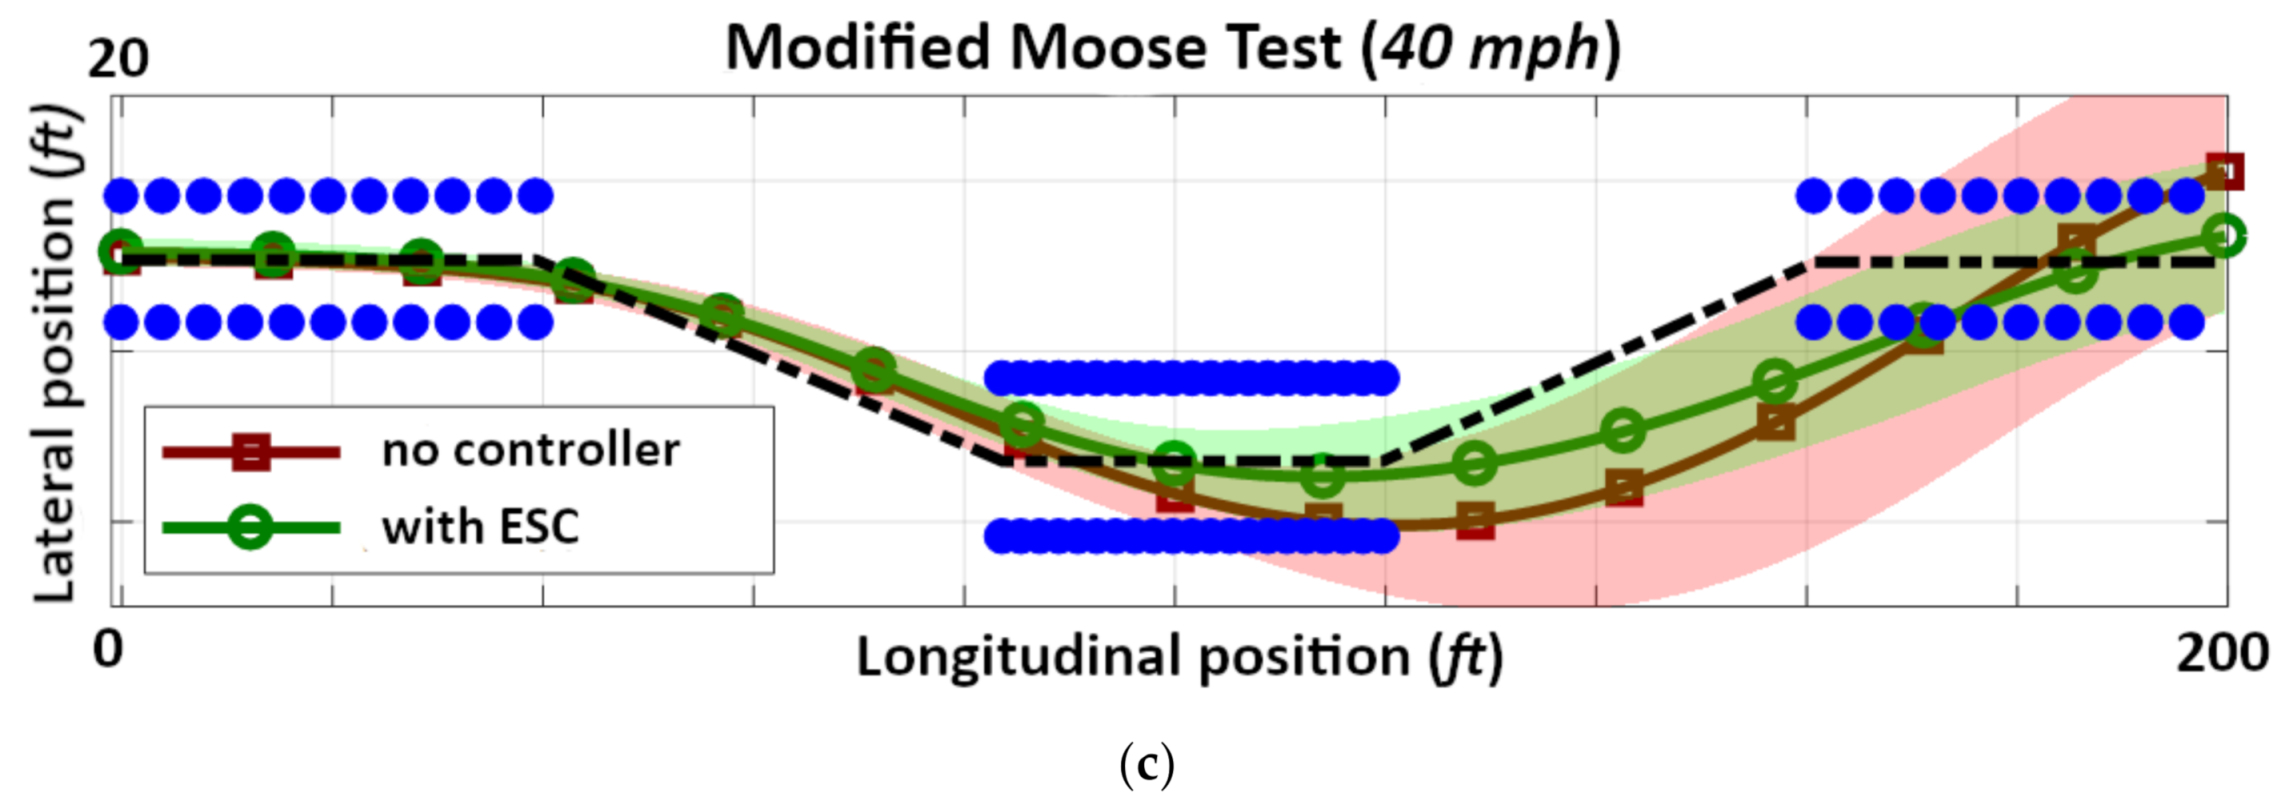
2.4. Moose Test Intervention
3. Results and Discussion
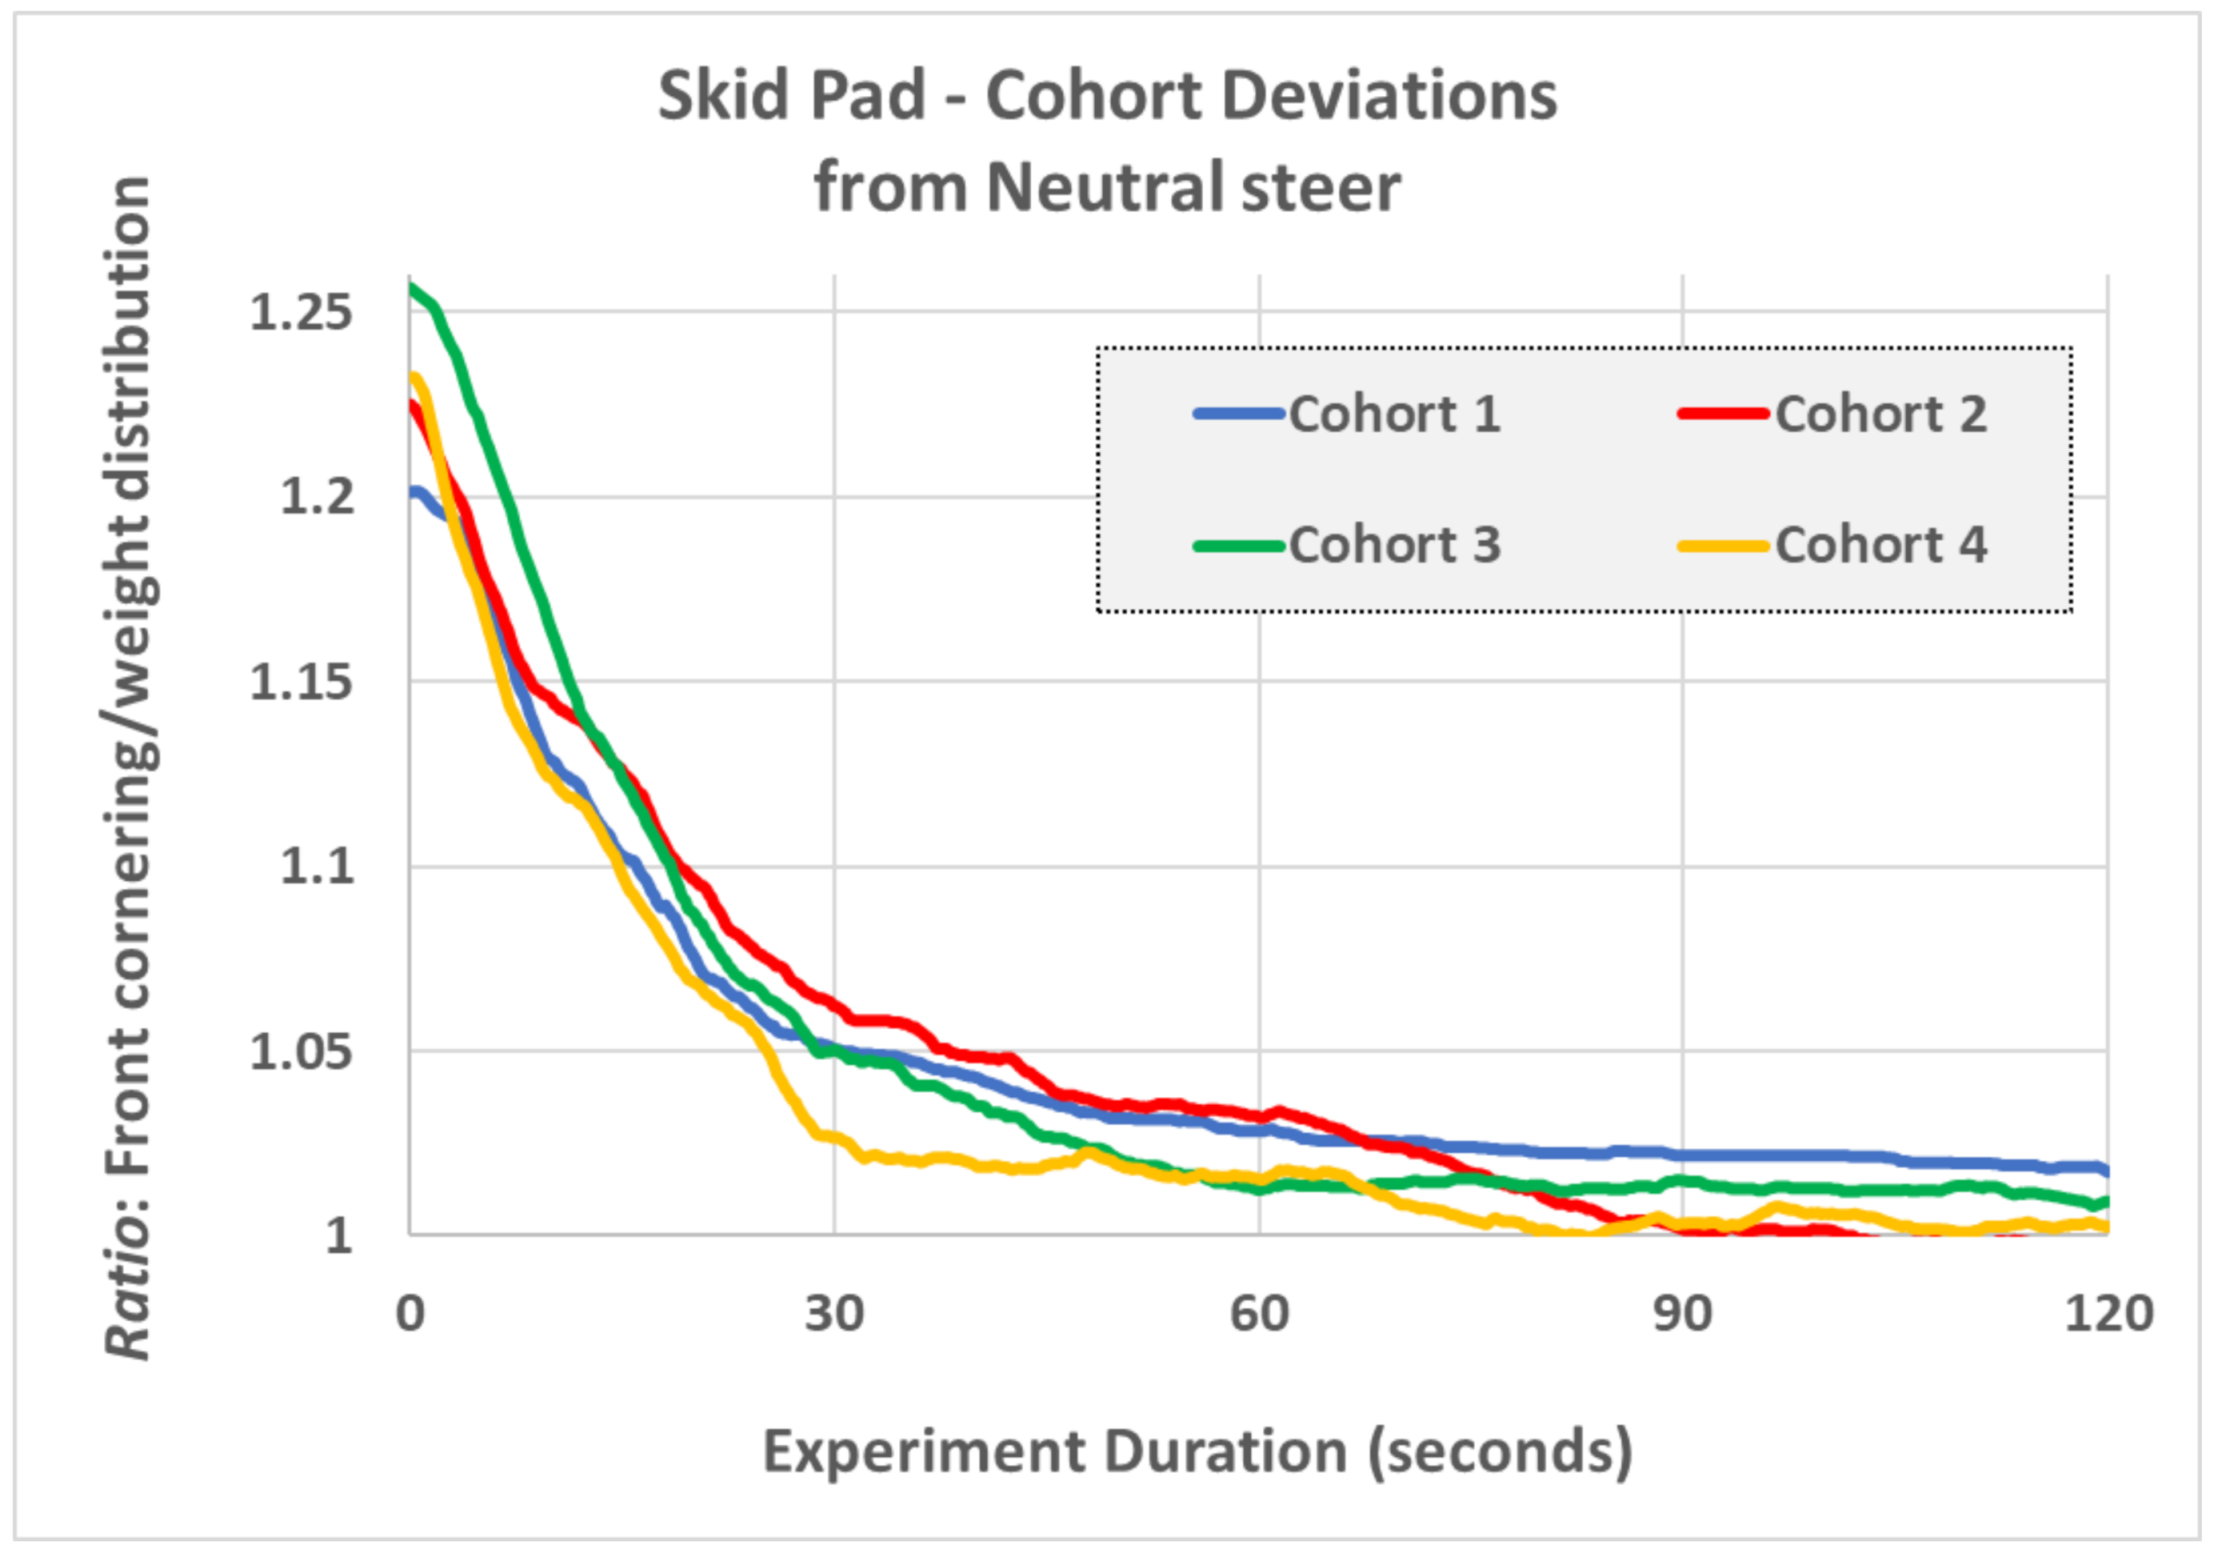
3.1. Skid Pad Intervention
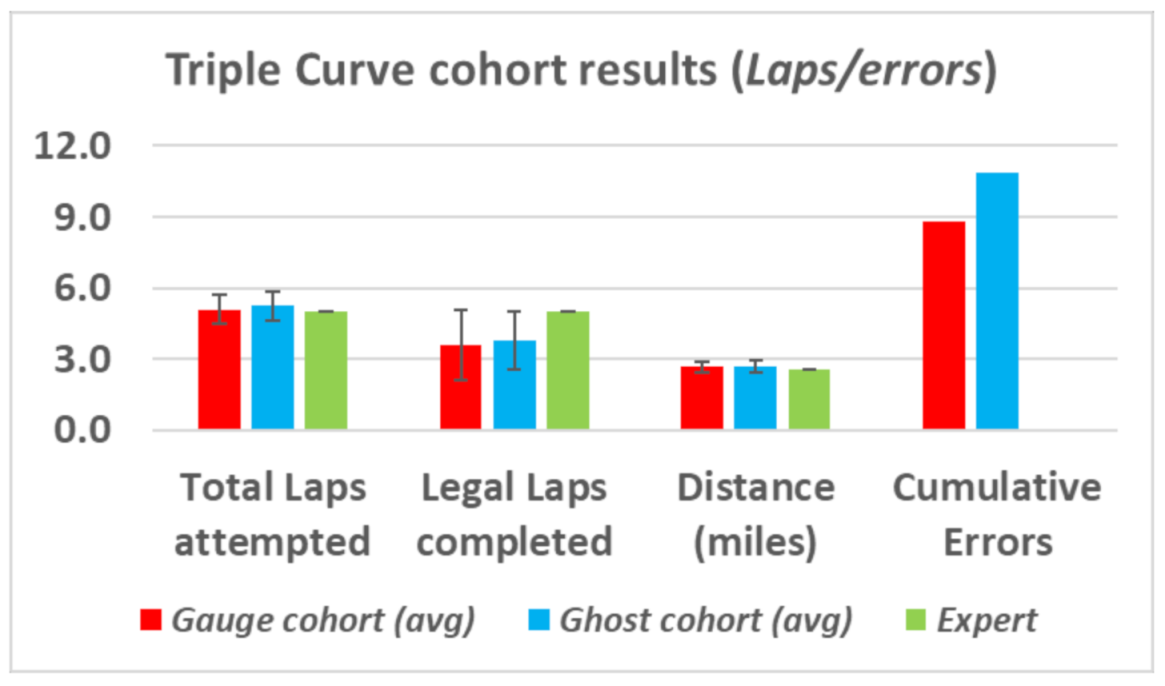
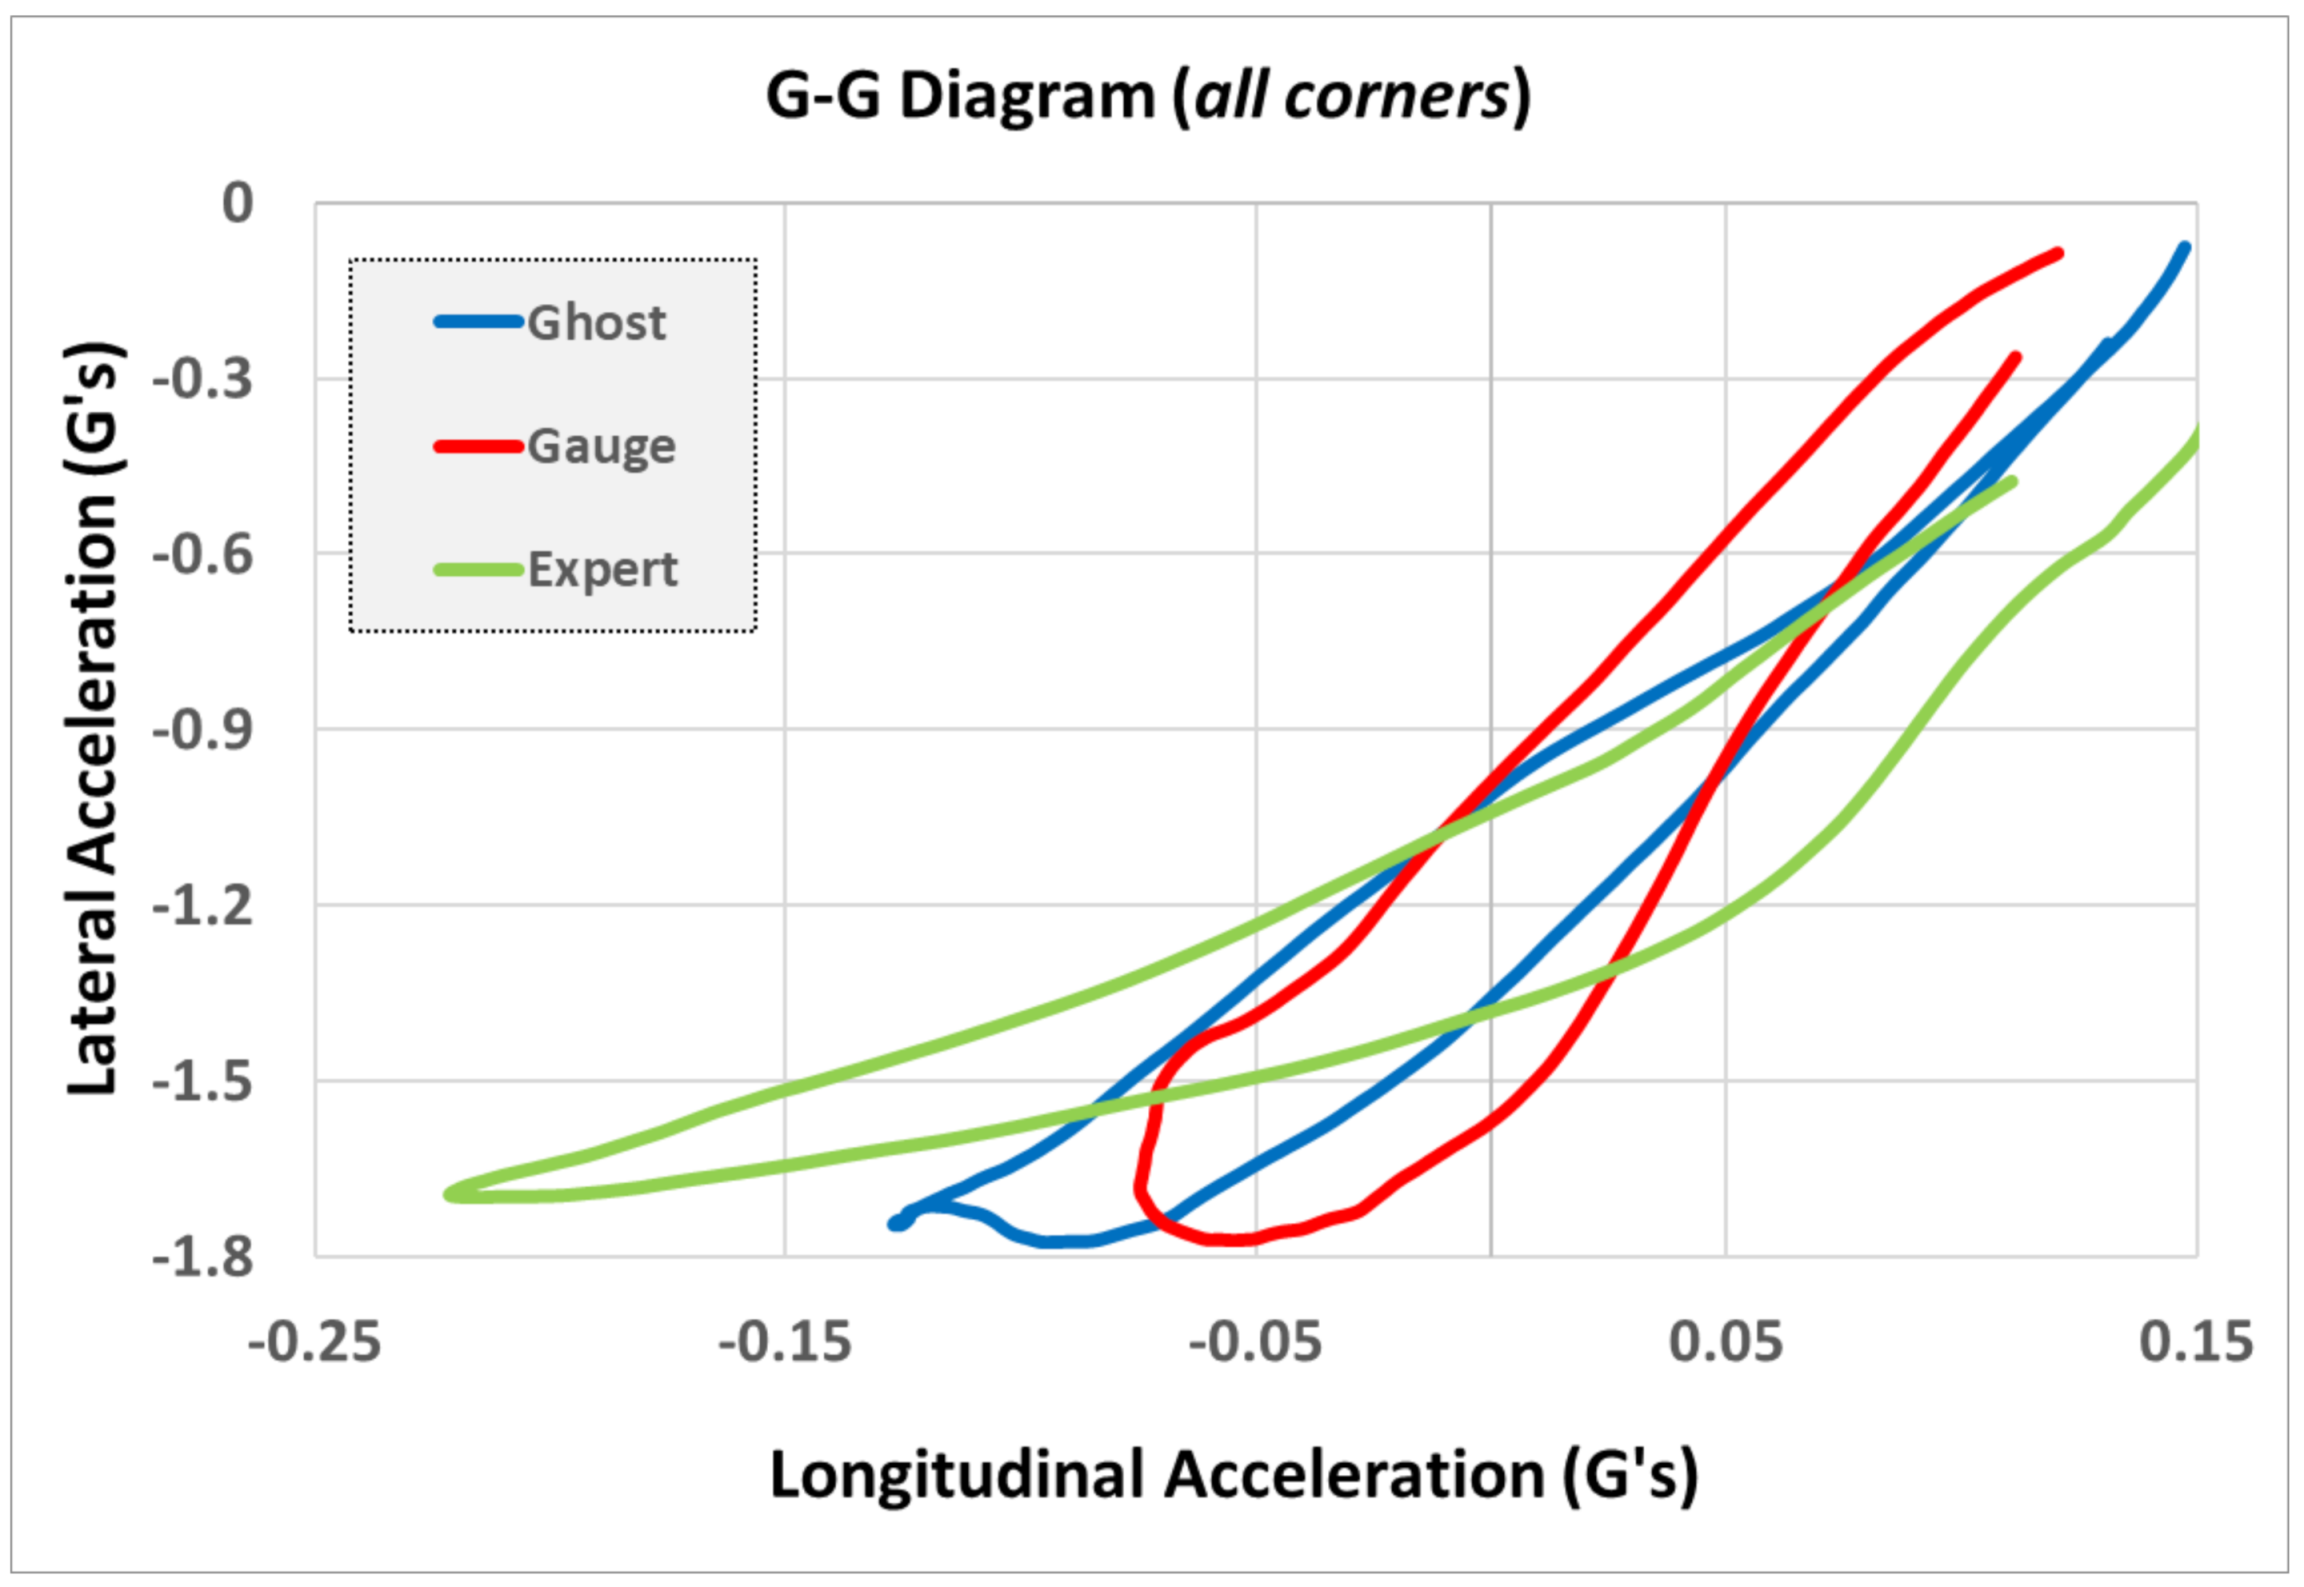
3.2. Triple Curve Intervention
3.3. Moose Test Intervention
4. Conclusions and Future Work
4.1. Constraints and Limitations of Current Implementation
4.2. Future Pathways
Author Contributions
Funding
Institutional Review Board Statement
Informed Consent Statement
Data Availability Statement
Acknowledgments
Conflicts of Interest
References
- National Highway Transportation Safety Association (NHTSA). Traffic Safety Facts—2013 Data; National Highway Traffic Safety Administration: Washington, DC, USA, 2015.
- Centers for Disease Control and Prevention (CDC); National Center for Injury Prevention and Control. Web-Based Injury Statistics Query and Reporting System (WISQARS) Fatal Injury Data; CDC: Atlanta, GA, USA, 2017.
- National Highway Transportation Safety Association (NHTSA). National Motor Vehicle Crash Causation Survey—Report to Congress; National Technical Information Service: Springfield, VA, USA, 2008.
- Smith, B.W. Human Error as a Cause of Vehicle Crashes, the Center for Internet and Society (CIS). 2013. Available online: http://cyberlaw.stanford.edu/blog/2013/12/human-error-cause-vehicle-crashes (accessed on 14 November 2020).
- Sokolowski, J.A.; Banks, C.M. (Eds.) Principles of Modeling and Simulation: A Multidisciplinary Approach. 2009. Available online: https://digitalcommons.odu.edu/vmasc_books/2 (accessed on 14 November 2020).
- National Research Council (NRC). 9. Using Modeling and Simulation in Test Design and Evaluation. In Statistics, Testing, and Defense Acquisition: New Approaches and Methodological Improvements; The National Academies Press: Washington, DC, USA, 1998. [Google Scholar]
- Feisel, L.D.; Rosa, A.J. The Role of the Laboratory in Undergraduate Engineering Education. J. Eng. Educ. 2005, 94, 121–130. [Google Scholar] [CrossRef]
- Potkonjak, V.; Gardner, M.; Callaghan, V.; Mattila, P.; Guetl, C.; Petrović, V.M.; Jovanović, K. Virtual laboratories for education in science, technology, and engineering: A review. Comput. Educ. 2016, 95, 309–327. [Google Scholar] [CrossRef] [Green Version]
- Amirkhani, S.; Nahvi, A. Design and implementation of an interactive virtual control laboratory using haptic interface for undergraduate engineering students. Comput. Appl. Eng. Educ. 2016, 24, 508–518. [Google Scholar] [CrossRef]
- Jeronymo, D.C.; de Barros Araújo, R.; Coelho, A.A.; Normey-Rico, J.E. An approach for improving student performance in a feedback systems course for process control education. IFAC Proc. Vol. 2014, 47, 10574–10579. [Google Scholar] [CrossRef]
- Jara, C.A.; Candelas, F.A.; Puente, S.T.; Torres, F. Hands-on experiences of undergraduate students in Automatics and Robotics using a virtual and remote laboratory. Comput. Educ. 2011, 57, 2451–2461. [Google Scholar] [CrossRef]
- Razali, Z.B.; Trevelyan, J.P. An Evaluation of Students’ Practical Intelligence and Ability to Diagnose Equipment Faults. Procedia Soc. Behav. Sci. 2012, 56, 42–51. [Google Scholar] [CrossRef] [Green Version]
- Nagai, K. Learning while doing: Practical robotics education. IEEE Robot. Autom. Mag. 2001, 8, 39–43. [Google Scholar] [CrossRef]
- Bauer, M.; Brooks, K.S.; Sandrock, C. Industry Expectations and Academic Practice in Control Engineering Education—A South African Survey. IFAC Proc. Vol. 2014, 47, 12226–12231. [Google Scholar] [CrossRef] [Green Version]
- Prince, M.J.; Felder, R.M. Inductive Teaching and Learning Methods: Definitions, Comparisons, and Research Bases. J. Eng. Educ. 2006, 95, 123–138. [Google Scholar] [CrossRef]
- Bencomo, S.D. Control learning: Present and future. Annu. Rev. Control 2004, 28, 115–136. [Google Scholar] [CrossRef]
- Choi, B.; Baek, Y. Exploring factors of media characteristic influencing flow in learning through virtual worlds. Comput. Educ. 2011, 57, 2382–2394. [Google Scholar] [CrossRef] [Green Version]
- Soo, M.T.; Aris, H. Game-Based Learning in Requirements Engineering: An Overview. In Proceedings of the 2018 IEEE Conference on e-Learning, e-Management and e-Services (IC3e), Langkawi, Malaysia, 21–22 November 2018; pp. 46–51. [Google Scholar]
- Turner, P.E.; Johnston, E.; Kebritchi, M.; Evans, S.; Heflich, D.A. Influence of online computer games on the academic achievement of nontraditional undergraduate students. Cogent Educ. 2018, 5. [Google Scholar] [CrossRef]
- Hughes, A. Gamification Versus Serious Games. 2017. Available online: https://trainingindustry.com/articles/learning-technologies/gamification-versus-serious-games/ (accessed on 26 November 2020).
- Rieber, L.P.; Smith, L.; Noah, D. The Value of Serious Play. Educ. Technol. 1998, 38, 29–37. [Google Scholar]
- Aldrich, C. Learning by Doing: A Comprehensive Guide to Simulations, Computer Games and Pedagogy in E-learning and Other Educational Experiences; John Wiley & Sons: San Diego, CA, USA, 2005; ISBN 978-0-7879-7735-1. [Google Scholar]
- Meuleners, L.; Fraser, M. A validation study of driving errors using a driving simulator. Transp. Res. Part F Traffic Psychol. Behav. 2015, 29, 14–21. [Google Scholar] [CrossRef]
- Mayhew, D.R.; Simpson, H.M.; Wood, K.M.; Lonero, L.; Clinton, K.M.; Johnson, A.G. On-road and simulated driving: Concurrent and discriminant validation. J. Saf. Res. 2011, 42, 267–275. [Google Scholar] [CrossRef] [PubMed]
- Underwood, G.; Crundall, D.; Chapman, P. Driving simulator validation with hazard perception. Transp. Res. Part F Traffic Psychol. Behav. 2011, 14, 435–446. [Google Scholar] [CrossRef]
- Chan, E.; Pradhan, A.K.; Pollatsek, A.; Knodler, M.A.; Fisher, D.L. Are driving simulators effective tools for evaluating novice drivers’ hazard anticipation, speed management, and attention maintenance skills? Transp. Res. Part F Traffic Psychol. Behav. 2010, 13, 343–353. [Google Scholar] [CrossRef] [PubMed] [Green Version]
- Casutt, G.; Martin, M.; Keller, M.; Jäncke, L. The relation between performance in on-road driving, cognitive screening and driving simulator in older healthy drivers. Transp. Res. Part F Traffic Psychol. Behav. 2014, 22, 232–244. [Google Scholar] [CrossRef]
- Lee, H.C.; Cameron, D.; Lee, A.H. Assessing the driving performance of older adult drivers: On-road versus simulated driving. Accid. Anal. Prev. 2003, 35, 797–803. [Google Scholar] [CrossRef]
- Roenker, D.L.; Cissell, G.M.; Ball, K.K.; Wadley, V.G.; Edwards, J.D. Speed-of-Processing and Driving Simulator Training Result in Improved Driving Performance. Hum. Factors J. Hum. Factors Ergon. Soc. 2003, 45, 218–233. [Google Scholar] [CrossRef]
- Saleh, L.; Chevrel, P.; Mars, F.; Lafay, J.-F.; Claveau, F. Human-like cybernetic driver model for lane keeping. IFAC Proc. Vol. 2011, 44, 4368–4373. [Google Scholar] [CrossRef] [Green Version]
- Sentouh, C.; Chevrel, P.; Mars, F.; Claveau, F. A sensorimotor driver model for steering control. In Proceedings of the 2009 IEEE International Conference on Systems, Man and Cybernetics, San Antonio, TX, USA, 11–14 October 2009; pp. 2462–2467. [Google Scholar]
- Horak, D.T. Experimental Derivation of Models of Human Drivers Executing Emergency Steering Maneuvers. In Proceedings of the ASME 2017 Dynamic Systems and Control Conference, Tysons, VA, USA, 11–13 October 2017; p. V003T33A001. [Google Scholar]
- Sarwar, T.; Anastasopoulos, P.C.; Golshani, N.; Hulme, K.F. Grouped random parameters bivariate probit analysis of perceived and observed aggressive driving behavior: A driving simulation study. Anal. Methods Accid. Res. 2017, 13, 52–64. [Google Scholar] [CrossRef]
- Hulme, K.F.; Kasprzak, E.M.; Morris, K.L. Correlation of Game-based Experiential Education to Self-reported Driving and Learning Styles. In Proceedings of the MODSIM World Conference, Virginia Beach, VA, USA, 25–27 April 2017. [Google Scholar]
- Hulme, K.F.; Androutselis, T.; Eker, U.; Anastasopoulos, P. A Game-based Modeling and Simulation Environment to Examine the Dangers of Task-Unrelated Thought While Driving. In Proceedings of the MODSIM World Conference, Virginia Beach, VA, USA, 26–28 April 2016. [Google Scholar]
- Akutagawa, K.; Wakao, Y. Stabilization of Vehicle Dynamics by Tire Digital Control—Tire Disturbance Control Algorithm for an Electric Motor Drive System. World Electr. Veh. J. 2019, 10, 25. [Google Scholar] [CrossRef] [Green Version]
- Gillespie, T.D. Fundamentals of Vehicle Dynamics; SAE International: New York, NY, USA, 1992. [Google Scholar]
- Milliken, W.F.; Milliken, D.L. Race Car Vehicle Dynamics; SAE: Warrendale, PA, USA, 1995. [Google Scholar]
- Hulme, K.F.; Estes, E.; Schiferle, M.; Lim, R. Game-based Learning to Enhance Post-secondary Engineering Training Effectiveness. In Proceedings of the Interservice/Industry Training, Simulation and Education Conference (I/ITSEC), Orlando, FL, USA, 2–6 December 2019. [Google Scholar]
- Lampton, C. How Automotive Proving Grounds Work. 2020. Available online: https://auto.howstuffworks.com/automotive-proving-ground.htm (accessed on 14 December 2020).
- Schmitt, B. Chrysler Fails Moose Test and Breaks First Commandment. The Truth about Cars (Online News Blog). 2012. Available online: http://www.thetruthaboutcars.com/2012/07/chrysler-fails-moose-test-and-breaks-first-commandment/ (accessed on 28 November 2020).
- ISO. ISO 3888-2:2011—Passenger Cars—Test Track for a Severe Lane-Change Maneuver—Part 2: Obstacle Avoidance. 2011. Available online: https://www.iso.org/obp/ui/#iso:std:iso:3888:-2:ed-2:v1:en (accessed on 28 November 2020).
- Hulme, K.F.; Estes, A.; Schmid, M.; Torres, E.; Hendrick, C.; Sivashangaran, S. Game-based Proving-grounds Simulation to assess Driving & Learning Preferences. In Proceedings of the Interservice/Industry Training, Simulation and Education Conference (I/ITSEC), Orlando, FL, USA, 2 December 2018. [Google Scholar]
- Ackermann, J. Robust decoupling, ideal steering dynamics and yaw stabilization of 4WS cars. Automatics 1994, 30, 1761–1768. [Google Scholar] [CrossRef]
- Ackermann, J. Robust Control Prevents Car Skidding. IEEE Control Syst. Mag. 1997, 17, 23–31. [Google Scholar]
- Rajamani, R. Vehicle Dynamics and Control; Springer: New York, NY, USA, 2006; ISBN 0-387-26396-9. [Google Scholar]
- Hou, Y.; Wan, J.; Zhao, Y.; Hulme, K.F.; Wu, C.; Sadek, A.W.; Qiao, C. The Effect of Intelligent Speed Control System: An Investigation on Driver’s Acceptance and Minimum Headway. In Proceedings of the ITS World Congress, Detroit, MI, USA, 7–11 September 2014. [Google Scholar]
- Hou, Y.; Zhao, Y.; Hulme, K.F.; Sadek, A. A Validated and Integrated Simulation Framework for Human Factors Analyses. In Proceedings of the Interservice/Industry Training, Simulation and Education Conference (I/ITSEC), Orlando, FL, USA, 1–5 December 2014. [Google Scholar]
- Fountas, G.; Pantangi, S.S.; Hulme, K.F.; Anastasopoulos, P.C. The effects of driver fatigue, gender, and distracted driving on perceived and observed aggressive driving behavior: A correlated grouped random parameters bivariate probit approach. Anal. Methods Accid. Res. 2019, 22, 100091. [Google Scholar] [CrossRef]
- Baffet, G.; Charara, A.; Lechner, D. Estimation of vehicle sideslip, tire force and wheel cornering stiffness. Control. Eng. Pract. 2009, 17, 1255–1264. [Google Scholar] [CrossRef] [Green Version]
- The Review Stories—Understeer vs. Oversteer. Available online: https://thereviewstories.medium.com/understeer-vs-oversteer-90124db12e9b (accessed on 20 November 2020).
- The Clemson University Vehicle Electronics Laboratory—Electronic Stability Control. Available online: https://cecas.clemson.edu/cvel/auto/systems/stability_control.html (accessed on 20 November 2020).
- Sell, R.; Rüütmann, T.; Seiler, S. Inductive Teaching and Learning in Engineering Pedagogy on the Example of Remote Labs. Int. J. Eng. Pedagog. 2014, 4, 12. [Google Scholar] [CrossRef] [Green Version]
- Rice, R.S. Measuring car-driver interaction with the g-g DIAGRAM. SAE Tech. Paper Ser. 1973, 730018. [Google Scholar] [CrossRef]
- Deterding, S. Gamification: Designing for motivation. Interactions 2012, 19, 14–17. [Google Scholar] [CrossRef]
- Singh, T.; Singhose, W. Input Shaping/Time Delay Control of Maneuvering Flexible Structures. In Proceedings of the 2002 American Control Conference (IEEE Cat. No.CH37301), Anchorage, AK, USA, 8–10 May 2002; pp. 1717–1731. [Google Scholar]
- Stott, A.; Neustaedter, C. Analysis of Gamification in Education; Simon Fraser University: Surrey, BC, Canada, 2013. [Google Scholar]
- Groeger, J.A.; Banks, A.P. Anticipating the content and circumstances of skill transfer: Unrealistic expectations of driver training and graduated licensing? Ergonomics 2007, 50, 1250–1263. [Google Scholar] [CrossRef] [Green Version]
- Stoner, H.A.; Fisher, D.L.; Mollenhauer, M. Simulator and scenario factors influencing simulator sickness. In Handbook of Driving Simulation for Engineering, Medicine, and Psychology; CRC Press: Boca Raton, FL, USA, 2011. [Google Scholar]
- Keshavarz, B.; Ramkhalawansingh, R.; Haycock, B.; Shahab, S.; Campos, J. Comparing simulator sickness in younger and older adults during simulated driving under different multisensory conditions. Transp. Res. Part F Traffic Psychol. Behav. 2018, 54, 47–62. [Google Scholar] [CrossRef]


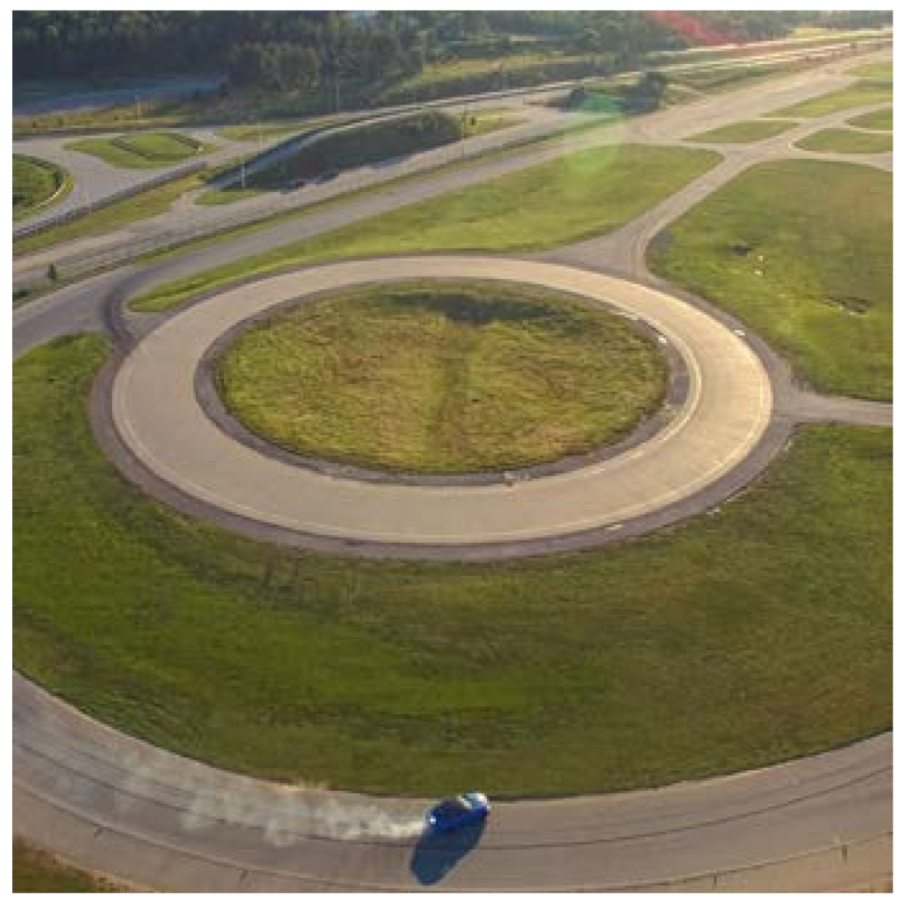
| Track | Circular proving grounds. |
| Training goal | Vary the CG to optimize understeer characteristics of vehicle. |
| Theoretical underpinning | “Natural steer” provides balance of stability/maneuverability. |
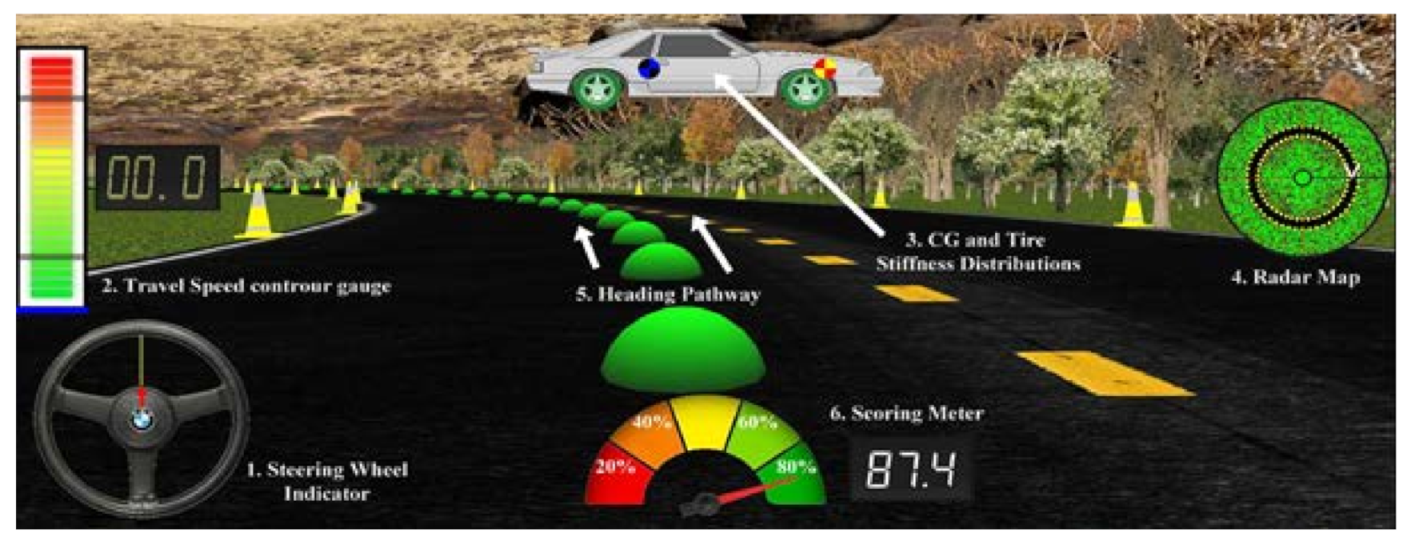
| Trainer | Six GBL elements navigate the trainee towards concept comprehension. |
| Broader Impacts on Safety | Students gain an improved understanding of the complex balance between a vehicle’s (fore-aft) weight distribution, front/rear tire stiffness, oversteer/understeer characteristics, and how this combination of factors affect a vehicle’s dynamics when its cornering limits are approached. |
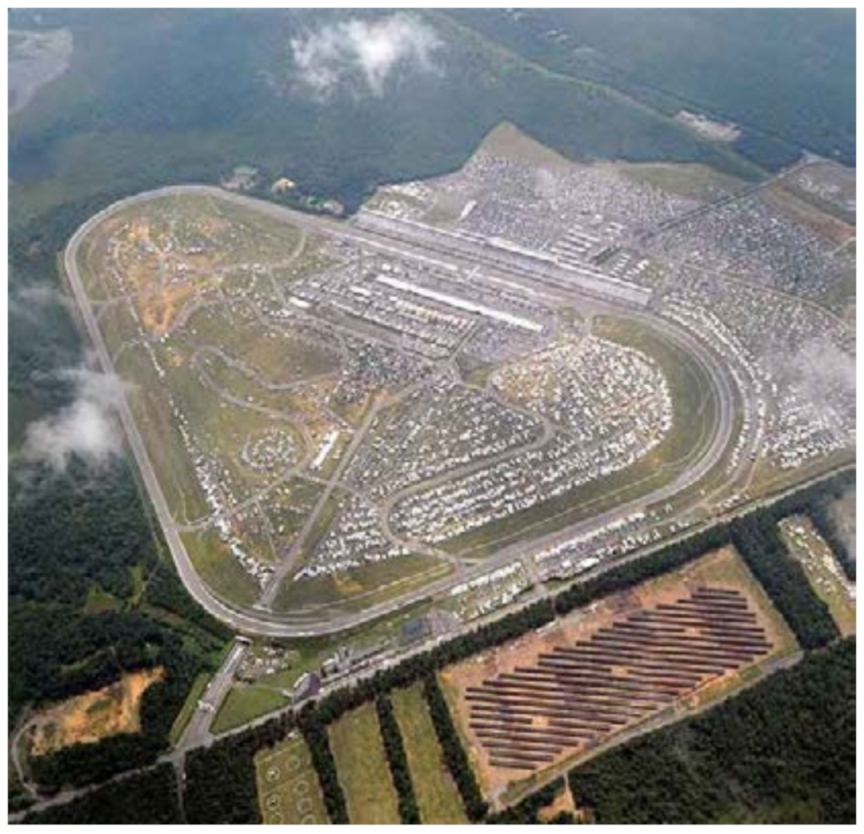
| Track | Triangular/axisymmetric; three straights joined by three tight 120° corners. |
| Training goal | Maximize legal laps (i.e., no barrier cones struck) within a two-minute window. |
| Theoretical underpinning | Maximize acceleration within tire limitations; cornering is key. |
| Trainer #1 (Gauge) | Visual guidance to navigate trainees towards ideal course compliance. |
| Trainer #2 (Ghost) | Trainees “follow the leader” to observe/replicate an optimal racing line. |
| Broader Impacts on Safety | Students engage with the delicate balance of throttling, braking, and steering during the transition from a straight to a corner. Each of these driver “inputs” creates tractional demands for the tires, which, if applied simultaneously, can push a tire to its limits; combining braking and steering can easily saturate a tire’s lateral force capabilities at higher speeds (or even at lower speeds on a wet or icy road). The simulator exercise affords students the opportunity to encounter this tractional limitation of vehicles in a safe setting. |
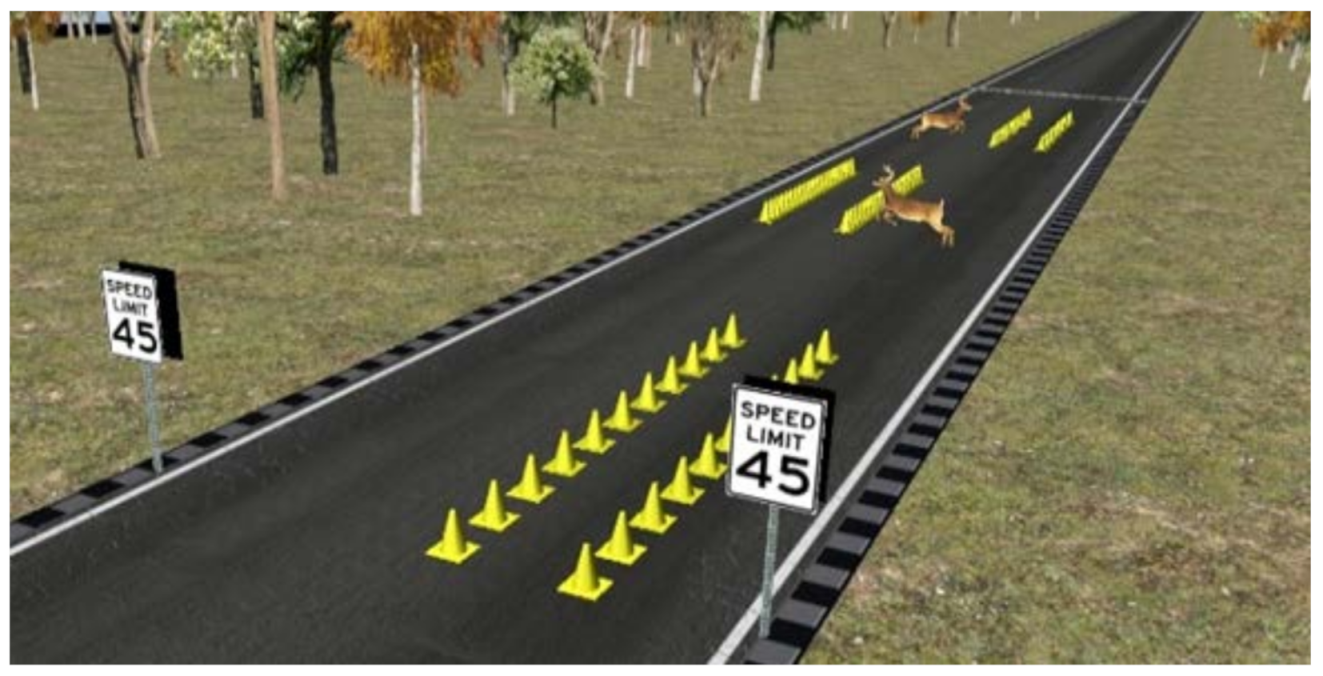
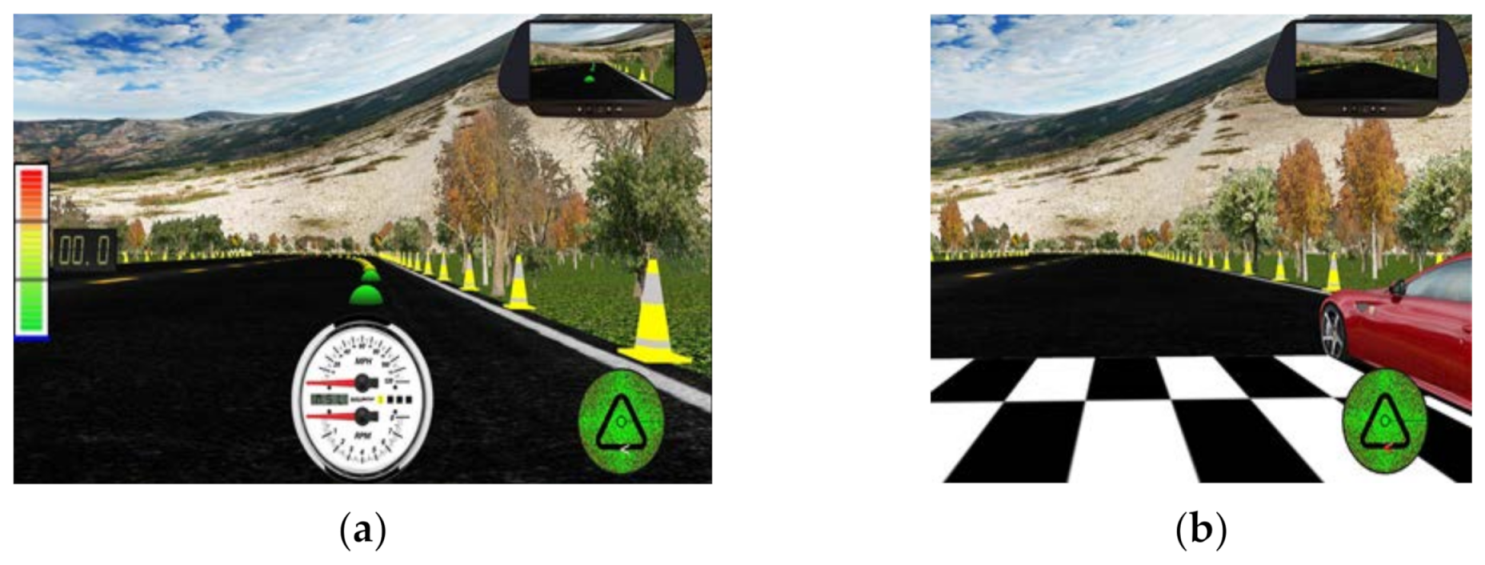
| Track | Straight—with a geometrically-specified double-lane-change maneuver (ISO 3888-2). |
| Training goal | Experience the Moose Test amidst 12 varying experimental conditions. |
| Theoretical underpinning | Observe impact of yaw stabilization with three influential parameters. |
| Trainer | Physically accurate GBL “original” and “modified” road course implementations. |
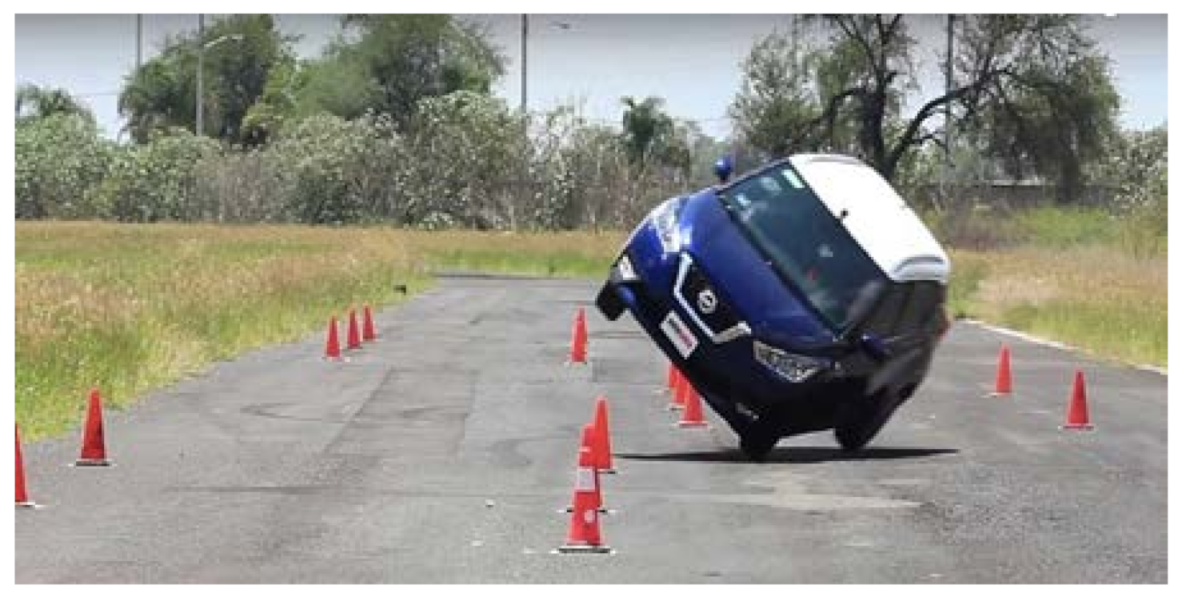
| Broader Impacts on Safety | Students experience the performance of a vehicle during a harsh evasive maneuver with and without the aid of electronic stability control. This comparison helps young engineers develop an understanding of how (and to what extent) such an assistive controller can help or harm drivers in extreme situations. |
| 20 mph | 30 mph | 40 mph | |
|---|---|---|---|
| Original (no ESC) | 4364 | 2899 | 8037 |
| Original (with ESC) | 1627 | 886 | 2046 |
| Modified (no ESC) | 671 | 2607 | 8016 |
| Modified (with ESC) | 367 | 1403 | 2982 |
| Original (no ESC) | 4364 | 2899 | 8037 |
| Original (with ESC) | 1627 | 886 | 2046 |
| Modified (no ESC) | 671 | 2607 | 8016 |
| Modified (with ESC) | 367 | 1403 | 2982 |
Publisher’s Note: MDPI stays neutral with regard to jurisdictional claims in published maps and institutional affiliations. |
© 2021 by the authors. Licensee MDPI, Basel, Switzerland. This article is an open access article distributed under the terms and conditions of the Creative Commons Attribution (CC BY) license (https://creativecommons.org/licenses/by/4.0/).
Share and Cite
Hulme, K.F.; Schiferle, M.; Lim, R.S.A.; Estes, A.; Schmid, M. Incorporation of Modeling, Simulation, and Game-Based Learning in Engineering Dynamics Education towards Improving Vehicle Design and Driver Safety. Safety 2021, 7, 30. https://0-doi-org.brum.beds.ac.uk/10.3390/safety7020030
Hulme KF, Schiferle M, Lim RSA, Estes A, Schmid M. Incorporation of Modeling, Simulation, and Game-Based Learning in Engineering Dynamics Education towards Improving Vehicle Design and Driver Safety. Safety. 2021; 7(2):30. https://0-doi-org.brum.beds.ac.uk/10.3390/safety7020030
Chicago/Turabian StyleHulme, Kevin F., Mark Schiferle, Rachel Su Ann Lim, Aaron Estes, and Matthias Schmid. 2021. "Incorporation of Modeling, Simulation, and Game-Based Learning in Engineering Dynamics Education towards Improving Vehicle Design and Driver Safety" Safety 7, no. 2: 30. https://0-doi-org.brum.beds.ac.uk/10.3390/safety7020030