Simheuristics Approaches for Efficient Decision-Making Support in Materials Trading Networks


IT in Production and Logistics, Faculty of Mechanical Engineering, TU Dortmund, 44227 Dortmund, Germany
*
Author to whom correspondence should be addressed.
Algorithms 2021, 14(1), 23; https://0-doi-org.brum.beds.ac.uk/10.3390/a14010023
Submission received: 14 December 2020
/
Revised: 8 January 2021
/
Accepted: 8 January 2021
/
Published: 14 January 2021
(This article belongs to the Special Issue Simulation-Optimization in Logistics, Transportation, and SCM)
Abstract
:The distribution process in business-to-business materials trading is among the most complex and in transparent ones within logistics. The highly volatile environment requires continuous adaptations by the responsible decision-makers, who face a substantial number of potential improvement actions with conflicting goals, such as simultaneously maintaining a high service level and low costs. Simulation-optimisation approaches have been proposed in this context, for example based on evolutionary algorithms. But, on real-world system dimensions, they face impractically long computation times. This paper addresses this challenge in two principal streams. On the one hand, reinforcement learning is investigated to reduce the response time of the system in a concrete decision situation. On the other hand, domain-specific information and defining equivalent solutions are exploited to support a metaheuristic algorithm. For these approaches, we have developed suitable implementations and evaluated them with subsets of real-world data. The results demonstrate that reinforcement learning exploits the idle time between decision situations to learn which decisions might be most promising, thus adding computation time but significantly reducing the response time. Using domain-specific information reduces the number of required simulation runs and guides the search for promising actions. In our experimentation, defining equivalent solutions decreased the number of required simulation runs up to 15%.
1. Introduction
Managing distribution networks is a challenging task for decision-makers. The specific challenge in this field is the complex structure of a typical network, which is a multi-echelon system with horizontal and vertical shortcuts in combination with huge numbers of nodes as well as transported parts, each kind of which is defined as a stock keeping unit (SKU). In addition, this kind of logistics operates in a highly volatile environment, requiring continuous adaptations by the responsible managers who need to conduct frequent maintenance and improvement decisions, especially on tactical horizons. In practice, decision-makers face a substantial number of potential improvement actions, spanned by the huge number of objects that can and have to be combined for suitable maintenance of the network [1,2]. Furthermore, conflicting goals, such as simultaneously maintaining a high service level and low costs, characterized by specifically defined key performance indicators (KPIs) [3], add to the complexity of the problem. Short delivery times versus low costs as well as a large number of delivered SKUs by their due date versus a large number of fully completed orders are other examples of conflicting goals in the network.
The first challenge is the specific shape of the problem. Traditional parameter optimisation tasks—easily found in the broad literature—are described by a given (finite) number of parameters, each with a given number of possible values. The size of the solution space, in this case, is defined as the product of the number of all parameters. However, in the network covered in this paper, there is an (in principle) unlimited number of actions to change the network, each of which could be any of a given limited set of actions, applied to any of the object combinations. Therefore, traditional algorithms are not applicable because of the daunting combinatorics. Just as an example, traditionally a parameter entry of the algorithm stands for a specific characteristic of the underlying system. Here, however, it only stands for any kind of action. Therefore, it is also the case that the sequence of the elements is clearly relevant, in contrast to the cases that are usually found in the state-of-the-art literature.
Due to their complexity, real-world networks cannot obtain a closed mathematical formulation of the goal functions [4]. Therefore, an application might resort to a three-stage solution procedure. In the first stage, changes to the system are defined that are expected to keep or even improve the KPIs. In the second stage, a discrete event simulation (DES) model [5] is run to determine basic logistical data, such as throughput times, in-time delivery, or utilisation of resources. In the last stage, these data are used as in the real world to calculate the KPIs, which then serve to judge the quality of the changes that have been set up in the first stage.
This three-stage process can, of course, be conducted manually by human experts, but there have been a number of trials to automate the optimisation of distribution networks. Unfortunately, due to the huge solution space, there is again no closed mathematical formulation to find a minimum or maximum of the desired KPIs, leading to the necessity of applying heuristic algorithms, which do not deliver the optimum, but—hopefully—a “suitably good” solution in finite time [6,7]. Specific heuristics would raise extremely high development and implementation effort for such complex applications. Therefore, reported implementations exploit metaheuristics, often biology-inspired, such as evolutionary algorithms [8]. Metaheuristics are optimisation algorithms that are—at least up to a point—independent of the specific application problem, with the great advantage that new developments can be exploited for a multitude of applications, and, thus, very sophisticated and efficient algorithms are available.
The scientific solution approach applied in this paper is consequently the method of simheuristics [9], which combines DES used as an evaluation function with metaheuristics for the optimisation. The major drawback of this approach is the time to produce promising action proposals. The tremendous time requirements originate from the huge solution space described before in combination with the significant runtimes of the complex simulation models [10], the latter being in the range of minutes to even hours per single run.
There have been very different approaches proposed to face this problem. Optimisation of the metaheuristics performance itself is hardly promising, as the processing of these algorithms covers only a very minor part of the total run time—by far the major part is covered by the DES. An obvious idea is to develop advanced simulation models that can evaluate the distribution system faster. Alternatives address the effort to obtain statistical relevance, for example, find better controls for the number of required replications or adapt such numbers to the degree that a specific solution seems to be promising [11,12,13]. This article explores two different innovative ways.
Actually, the real performance challenge is not to minimise the effective computation time of the computer resource, but to reduce the time required to present a decision proposal , defined as the time span between the availability of data and the provision of acceptable solution proposals. With metaheuristics, such as an evolutionary algorithm (EA) [7], can only be reduced with respect to when additional resources are applied. For example, using four computer processors instead of one will cut to about 25% of . With ten computers, it will reduce to about 10% (assuming that the distribution overhead is negligible). However, the tactical decisions are performed, for example, once per month with a decision request three days after availability of field data in the data warehouse. Thus, ten computers might idle 27 days waiting for the next decision request. The solution approach is to apply machine learning, where a learning algorithm is operating for 90% of the time, and in the concrete decision situation the acquired knowledge is used to quickly find promising solutions. We consider deep reinforcement learning for this purpose, as it allows us to estimate the impact of specific changes, even if these have never been simulated in the past, by using the “fuzzier” knowledge within the deep learning’s neural network [14,15].
The second innovative idea is to get domain-specific information (DSI) back into our metaheuristic algorithm [16]. We analyse three different approaches to use contextual information for the acceleration of the heuristics machine. One approach exploits experience from previous (actual or simulated) applications of actions, following the idea that actions that have shown to be helpful in the past might lead to good results in the future as well. This method also allows us to exploit the idle time between the decision periods to collect experience about the actions’ success and, thus, to improve the forecast power of the success indicators. A second approach uses the classification of actions that either change the network’s structure or else just its parameters, assuming that structural changes would be more targeted if applied among the first actions of the action plan. The last idea assumes that the actions are not independent, and one action being performed will influence the impact of further actions. In this approach, the correlation among actions is computed for data from the past and projected into future action plans. Again, idle time can be used to calculate and continuously improve the correlation indicators.
Finally, the number of simulation runs could be reduced, and we discuss two ways towards this goal. On the one hand, different action plans are analysed to determine whether they can be predicted to gain identical results without the need to simulate both of them. This would lead to performance improvement without reducing the result quality (or, from a different point of view, to achieve better results within the same time frame). On the other hand, the reduction of the solution space itself by grouping actions into fewer selectable items is considered [17]. It can be assumed that this approach, quite usual in real-world decision making, will lead to a significant reduction of simulation runs. However, the reduction of the research space might exclude some even better solutions, which in fact could be acceptable if the method leads to better solutions within a limited given time frame.
For all these approaches, we have developed suitable implementations and evaluated them with subsets of real-world data. In this paper, we give an overview of the implementation, present exemplary results, and make conclusions about the suitability of the investigated approaches. The paper is organised as follows—Section 2 presents the related work and Section 3 the considered optimisation approaches. Section 4 introduces the general ideas and architecture of the developed logistics assistance system, and it clarifies the relationship to real-world data. Section 5, Section 6 and Section 7 discuss the above-mentioned approaches one by one, followed by an evaluation of the novel concepts in an evaluation based on real-world data in Section 8. The discussion relates the major findings to the previous state of the art and derives future research paths, followed by a summary of the achievements in Section 9.
2. Related Work
2.1. Simulation of Distribution Systems
Management of logistics distribution systems is a complex task; hence, decision-makers use models to represent and study these systems. A model is a “simplified reproduction of a planned or existing system with its processes in a different conceptual or concrete system” [18] (p. 3). In the models, decision variables are under the control of decision-makers and present the input to the models [19]. Decision-makers change the values of decision variables and use the output of models to study the relationships between the variables and the performance of the modelled system.
Distribution systems have a high degree of interaction between their entities and are characterised as having time-dependent variables [18]; thus, mathematical models [5] reach their limits in modelling distribution systems and, instead, simulation is used to model them.
Simulation studies are conducted in several phases that are, for example, illustrated in the procedure model presented by Rabe et al. [20]. This model shows the phases targeted to guarantee the building of a representative model of the system under study. It highlights the importance of verification and validation of the model as well as the data in the simulation study [21].
A variety of model representation techniques using simulation modelling have been developed, such as DES [22]. The discrete event simulation is characterised as modelling a system by focusing on its discrete states. Fanti et al. [23] claimed that DES is the most preferred simulation approach for logistics systems. Pujawan et al. [24] modelled a cement distribution system using DES to estimate costs and service level. In another study, Fang and Li [25] evaluated various inventory scenarios using DES. Ivanov [26] studied the effect of disruption at one point in a network using DES; he used DES to perform a sensitivity analysis.
2.2. Optimisation of Distribution Systems
In optimisation problems, decision variables are optimised. These variables might have continuous values or countable values [7]. Optimisation problems with countable decision variables are integer programming problems, sometimes called combinatorial optimisation problems [27]. Such problems are based on combinatorics [28], in which a solution is formed from a finite space of elements to optimise an objective function [29]. Optimisation of distribution systems could be formulated as a combinatorial optimisation problem [30], such as the travelling salesman problem, in which the task is to arrange a tour through a number of cities to minimise the total travelled distance.
Greedy algorithms have been used to find the approximately optimal solutions of simple combinatorial optimisation problems [31]. Adding constraints to these problems or increasing their size increases the difficulties to solve them, and the problems might become NP-hard [4]. The travelling salesman problem is an example of an NP-hard problem that is solved by approximate methods (such as metaheuristics) to find promising feasible solutions [31]. “A metaheuristic is a high-level problem-independent algorithmic framework that provides a set of guidelines or strategies to develop heuristic optimisation algorithms” [32] (p. 960).
Researchers used metaheuristics to solve a variety of combinatorial optimisation problems, such as Osaba et al. [33]. Cybulski [34] found that evolutionary algorithms exhibited promising performance in different benchmark combinatorial optimisation problems. Other researchers combined metaheuristics and other methods in a hybrid approach [7], such as the simheuristics approach [35].
2.3. Simheuristics
For the optimisation of complex systems, simulation and optimisation methods are combined in simulation-optimisation methods [36], which depend on the optimisation algorithm that is used and the simulation purpose. The VDI-Guideline 3633.12 [37] classifies the relation between simulation and optimisation algorithms into four categories: “Category A” in which simulation follows optimisation, “Category B” with optimisation following the simulation, “Category C” integrating an optimisation algorithm in the simulation, and “Category D” in which simulation is integrated in an optimisation algorithm.
A variety of optimisation algorithms could be combined with simulation, for example, metaheuristics. The integration of simulation in metaheuristics is called simheuristics [35] and is classified as “Category D” by VDI-Guideline 3633.12 [37]. Simheuristics combines the power of metaheuristics and simulation. The metaheuristic algorithm forms solutions that are evaluated by simulation with respect to the objective function in the optimisation problem.
Researchers have used simheuristics to solve a variety of combinatorial optimisation problems. For example, Juan and Rabe [35] proposed an approach that outperformed a traditional method to solve an inventory routing problem. They combined Monte Carlo simulation and the best-known heuristic that solves the problem. Juan et al. [9] proposed a framework to handle a stochastic type of combinatorial optimisation problems with moderate volatility. Jackson et al. [38] combined DES and a genetic algorithm to handle the stochasticity in an inventory management problem. Discrete event simulation and a genetic algorithm were used to design a supply network by Gutenschwager et al. [39]. Pages-Bernaus et al. [40] investigated a facility location problem. They found that a simheuristic approach outperformed other stochastic programming methods to solve the problem.
2.4. Literature Summary and Contributions
Distribution networks are complex networks with a large number of possible actions that might be used to improve them. These networks are difficult to model adequately in a mathematical formulation, and, thus, simulation is often used for their study. In order to optimise such networks with their conflicting goals, metaheuristic algorithms could be used to provide a “good solution”. Because these networks are complex, researchers have found it beneficial to combine simulation and metaheuristics in a simheuristic approach to optimise them. This approach forms the basis for a logistics assistance system (LAS) that is described in Section 4. In the LAS, actions are selected to construct action plans in which the order of the actions is significant. However, the LAS has a long decision proposal time, because simulation forms the major part of the optimisation run time.
Researchers have suggested approaches to reduce the number of evaluations in an optimisation algorithm, such as screening solutions [41]. Other researchers proposed random biased selection of the solution’s elements to improve the optimisation [42]. None of these strategies addressed the presented action plan problem that is a combinatorial optimisation problem in which actions are selected.
Since decision-makers look for a “good solution” in a reasonable time for the decision proposal even in large and complex networks, our paper proposes innovative approaches to reduce this time. In the first approach, reinforcement learning is proposed to reduce the decision proposal time. Section 3.2 and Section 5 describe reinforcement learning and its innovative implementation in the LAS. Another innovative approach defines a network’s domain-specific information and utilises it to recommend actions (Section 6). The last proposed approaches reduce the number of simulation runs by defining equivalent solutions and reducing the actions’ search space (Section 7).
3. Optimisation Approaches
3.1. Evolutionary Algorithms
Evolutionary algorithms are metaheuristic algorithms developed to solve optimisation problems. In evolutionary algorithms (EAs), solutions are represented as individuals in a population. The individual’s definition and encoding depend on the optimisation problem to be solved [43]. The individual might be presented as a string of binary numbers or real numbers. A fitness value assigned to each individual represents the objective function value associated with it. These individuals evolve in each generation and form a new population. The fittest individuals evolve inspired by the theory of evolution defined by Darwin. The selection of the individuals to evolve is facilitated by a biased selection, such as roulette-wheel or tournaments [44,45].
In addition to “individual”, “population”, and “fitness” terms used in the EA, other terms are used, such as “offsprings”, “crossover”, and “mutation” [7,43,45]. Offsprings are individuals from the population that are reproduced using crossover and mutation. In a crossover, parts of the individuals’ genes are exchanged between two individuals. The crossover form depends on the number of exchange points along the individual’s length, for example, one-point crossover, two-point crossover, and uniform crossover. In uniform crossover, multiple crossing points are defined along the individual’s length. Mutation modifies one individual to reproduce an offspring. One or more parts of the individual are changed. Both crossover and mutation can be customised based on the optimisation problem.
The evolution of the individuals continues until a termination criterion is met, such as reaching a specified number of generations or stagnation [7,45]. Stagnation is defined when the best-found solution is not changed by the algorithm over a specific number of generations.
Evolutionary algorithms can handle optimisation problems in different domains. For example, an EA was used to minimise the service costs in marine container terminal operations [46]. Pasha et al. [47] compared an EA and other algorithms for solving the vehicle routing problem with a “factory-in-a-box” concept. The EA found the nearest solution to the optimum in small-scale problem instances and better solutions than other algorithms in large-scale problem instances. Evolutionary algorithms can detect promising regions in the search space and be utilised in the learning process while solving optimisation problems [48,49]. In online optimisation, the problems’ features change over time and are unknown in advance. A learning-based EA was proposed to handle this problem [49]. Additionally, EAs were used to solve combinatorial optimisation problems, such as the vehicle routing problem and the travelling salesman problem [7,48].
Evolutionary algorithms can handle multi-objective optimisation problems [50]. In these problems, the non-dominated solutions, which outperform other solutions at least in one of the objective functions, are stored, and the algorithm looks for solutions along the Pareto front. Moradi [48] used a multi-objective evolutionary algorithm to minimise the number of vehicles and the total travelled distance in the vehicle routing problem. Researchers have utilised EAs in optimisation problems, including minimisation of energy consumption. For example, Ji et al. [51] solved a multi-objective green express cabinet assignment problem in urban last-mile logistics using probability-guided EA. They minimised total costs and energy consumption. The total makespan and total energy consumption were minimised in the flow shop scheduling problem with sequence-dependent setup times [52]. Petrowski and Ben-Hamida [43] stated that EAs for multi-objective problems provide promising solutions in problems with less than four objective functions. Other approaches proposed combining an EA and DES to solve optimisation problems, such as optimising lead time and total inventory holding costs in job sequencing and buffer size optimisation problems [53].
3.2. Deep Reinforcement Learning
In the field of reinforcement learning, the primary goal is to produce autonomous agents that interact with their environments to learn optimal behaviours, improving over time through trial and error. Although considerable successes in this field have been reported in the past [14,54,55], previous approaches often lacked scalability and were inherently limited to fairly low-dimensional problems [56]. In order to apply reinforcement learning to problems approaching real-world complexity, agents need to be able to derive efficient representations of the environment from high-dimensional inputs, and use these representations to generalize past experiences to new situations [15]. In recent years, improvements in the ability to process large amounts of data have led to considerable progress in this field [57]. A major reason for the development in this regard is the rise of deep learning, a class of representation learning with multi-layer artificial neural networks [58,59,60]. The neural networks are called deep, because they have numerous hidden layers between the input layer and the output layer and have, thus, an extensive internal structure [61,62,63]. Combining several layers, a deep neural network can be used to find compact low-dimensional representations in high-dimensional data, for example, in audio, text, and images. Hence, deep neural networks can, hence, be used to progressively build up abstract representations of data, and, thus, enable abstract learning. A particularly successful type of deep neural network is the Convolutional Neural Network (CNN) [15,64]. CNNs leverage the fact that the analyzed data are composed of smaller details—referred to as features—and trigger a decision about the entire data set by analyzing each feature in isolation. By using the mathematical concept of convolution, CNNs are able to learn patterns, for example, to associate object categories to raw image data. Applied in the context of reinforcement learning, a CNN can be used to approximate the internal value function of the agent, and, thus, to map actions to constellations of data in a particular state [65]. In this regard, effective progress has been made in addressing the curse of dimensionality in the field of reinforcement learning [15,56]. Deep reinforcement learning is supposed to be able to scale to decision-making problems that were previously unsolvable, for example, settings with high-dimensional state and action spaces. Recent work in this field has shown outstanding progress, which started with an algorithm that could learn to play a range of Atari 2600 video games at super-human level, directly from screen pixels [65]. A comprehensive survey of efforts in deep reinforcement learning can be found in Reference [66].
4. Solution Architecture
4.1. A Logistics Assistance System
A logistics assistance system has been developed to assist decision-makers in distribution networks using the Python programming language [16]. This LAS utilises basic components related to a transactional system in a distribution network, such as Enterprise Resource Planning. Figure 1 shows the architecture of the LAS. The data are extracted from the transactional system and loaded into a data warehouse. KPIs are calculated, and any deterioration of the value of a KPI beyond the previously assigned limit triggers an alert in a corresponding key performance indicator management system (KPIMS) [67]. These systems recommend potential actions that are designed to improve the value of the KPI. A recommended action by the KPIMS is expected to increase the intrinsic value of the KPI that triggers the alert, but it could reduce the intrinsic value of other KPIs. Since each of the KPIMS recommends actions independently from the others, the LAS aims to consider the impact of the actions on the entire network and improve the network’s performance as a whole.
In addition, the data are extracted from the transactional system by the model builder into a data model to form the database of a data-driven simulation tool (Figure 1). Rabe and Dross (2015) proposed the use of data-driven simulation tools to apply actions using SQL statements, such as SimChain, which is a generic supply chain simulation model based on the Siemens Plant Simulation tool [69]. The developers of the LAS used SimChain to model a similar distribution network previously [70].
In the LAS, actions are derived from action types [71], which are defined by simulation experts. An action type represents a generic description of an action, for example, centralising an SKU in a site without specifying the SKU and the site. To derive actions from the action types, input parameters are specified, for example, SKU 1 in site A. Action types are defined in the action type designer by decision-makers of the LAS using a domain-specific modelling language. The action types are stored in an action type directory that can be accessed by the KPIMS and the heuristic unit in the simheuristic framework (cf. Figure 1). The actions recommended by the KPIMS and the actions derived from action types form the search space of actions for the heuristic unit.
In the heuristic unit, the simheuristic approach is represented by simulation and a metaheuristic algorithm. The metaheuristic algorithm explores the search space and constructs action plans to be evaluated. The changes applied by actions are executed as SQL statements in the database. These data are then transferred to a “shadowed data warehouse”, which mimics the calculation of the operational KPI, but for simulated data. The shadowed data warehouse is introduced in order to avoid any potential mix-up of the simulated (experimental) data with the real operational data sets. The (simulated) KPIs calculated from the shadowed data warehouse form the objective values to be optimised by the metaheuristic. The construction and evaluation continue until a termination condition is met. Then, suggested actions as an action plan are recommended to decision-makers, who are the main users of the LAS.
4.2. Semantic Model for Action Types in Wholesale Logistics Networks
To increase the LAS’s flexibility and usability, decision-makers can model and integrate user-generated action types. For this purpose, decision-makers can utilize a specifically developed domain-specific modelling language, which is tailored to the model of action types in wholesale logistics networks. Accessing the developed domain-specific modelling language can be performed via the Action Type Designer, an integrated development interface (IDE), providing all benefits of common IDEs such as code completion or syntax highlighting.
All action types are based on the same semantic model. Therefore, the semantic model of an action type must be capable of representing all required information for all possible action types in a logistics network. Action types can be instantiated by adding type-specific parameters to the semantic model’s attributes [72].
The attributes of the semantic model serve different purposes and are, thus, divided into different categories. The first category of attributes has informative purposes, such as the action type’s name, description, id, the owner’s id, and a list of ids for representing the involved modellers.
Action types represent changes to the underlying simulation model. For the specification of these changes, functional attributes are used. The attribute input is used to define the affected entities of the logistics network. To specify the effects on those entities, statements of the domain-specific modelling language are used.
Meta information of action types is stored in meta-attributes of the semantic model. For example, it may take some time to fully execute a set of actions in the real logistics network. Therefore, the required time for executing actions is stored in the attribute time till effect. Additionally, executing an action may entail costs. The costs of an action are stored in the attribute total costs.
The semantic model additionally includes domain-specific information [68,73,74], for example, the frequency or the impact of an action type on the logistics network, which can be stored in corresponding attributes of the model. Changes to the network can be categorised into two different groups, structural and parametrical changes. A structural change alters the structure of the network, for instance, adding new routes, sites, or SKUs to a site. Actions that affect attributes of the logistics network’s entities are categorised as parametrical, for example, increasing the safety stock or changing the frequency of a route. In addition, correlations between different action types and their actions’ impact on the network can be modelled. For example, when “centralising an assortment”, “increasing the safety stock” of any centralised SKU might be a promising candidate for further actions. Thus, a positive relation is defined between “centralise” and “increase the safety stock”.
After the parameterisation of an action type, the corresponding derived actions can be stored in the semantic model’s attribute actions. An overview of the semantic model is given in Table 1.
4.3. Abstracting the Modelling of Action Types from the Underlying Simulation’s Data Base
Actions are closely related to the underlying simulation’s data model, resulting in multiple issues. Modelling action types requires in-depth knowledge of the database’s structure, for example, for specifying the areas of the database that are affected by applying corresponding actions. Another issue arises when the database’s structure changes, for example, when the simulation software is updated or a new simulation tool is introduced. To address these problems, the authors propose to decouple the modelling of action types from the underlying simulation data model [75].
When applying an action, a set of corresponding entities of the logistics network needs to be adapted, accordingly. In a data-driven simulation, an entity can be described by entries in a database’s table. To identify the correct entities, the table’s name and the entities’ attributes are defined as part of statements in the modelling process of an action type (Section 4.2). Thus, when applying an action, multiple entries in the database might be changed (Figure 2).
However, the simulation’s database and, therefore, the data model, are typically predefined by the simulation tool that is being used. Thus, the data model is not easily adjustable. When decoupling the modelling of action types from the data model of the underlying simulation, an additional data model is required: an enterprise-specific data model. This enterprise-specific data model can be structured in the way that best suits the decision-makers’ knowledge and needs.
Using an enterprise-specific data model, action types can be specified against this model and not against the simulation data model. To correctly convert actions into changes to the simulation data model, each attribute of the simulation data model must be distinctly linked to the corresponding attribute of the enterprise-specific data model (Figure 3). Such a mapping can be defined, for example, in the form of a JSON-file. In the process of executing an action, the information for the mapping between the two models is read from the JSON-file, so that changes can be applied to the simulation data model, accordingly [75].
By utilizing this approach, action types can be modelled against an enterprise-specific data model, which can be adapted to the modellers’ knowledge and needs. This approach allows decision-makers to become modellers and to specify action types against a common data structure and with known names of the entities and their attributes. Another advantage of this approach is that when the simulation data model changes, only the mapping must be adjusted and not all the definitions of the action types. This saves resources, reduces the risk of faults, and improves the acceptance of the method in general.
5. Addressing the Performance Challenge: Deep Reinforcement Learning
As mentioned above, creating an algorithm that is able to master a varied range of challenging tasks by teaching itself in a trial-and-error procedure is one of the major goals of reinforcement learning. Reinforcement learning in general considers tasks in which an agent interacts with an environment through a sequence of observations, actions, and rewards. To use reinforcement learning successfully in situations approaching real-world complexity, however, agents are confronted with a challenge: they have to derive efficient representations of the environment from high-dimensional sensory inputs and use these to generalize past experiences to new situations (cf. Section 3.2). The authors of Reference [15] approached this challenge by creating an algorithm that used a Deep Q-Network (DQN) as the central value function approximation.
Almost all reinforcement learning algorithms are based on estimating value functions. The algorithm used for the DQN agent, Q-learning, is based on the Q-function, a function of state-action pairs that expresses how beneficial it is for the agent to perform a given action in a given state with respect to the expected return [76]. More formally, the Q-function expresses the value of taking an action a in a state s under a policy with respect to the expected return starting from s, taking the action a, and thereafter following policy . For small problems, the Q-function can be stored as a table, but for larger problems, this table quickly gets too large to be stored in memory. Moreover, the time and data required to fill the table accurately would be too high. In many tasks to which one would like to apply reinforcement learning, most states encountered will never have been experienced exactly in the same way before. The only way to learn anything at all in these cases is to generalize from previously experienced states to ones that have never been seen before. Hence, for larger problems, the key issue is that some sort of function approximation is included. In this regard, advances in deep neural networks have made it possible to approximate the Q-function, for example, with a CNN.
Mnih et al. [15] tested an agent with a DQN on the Arcade Learning Environment (ALE), which is a software framework designed to simplify the development of agents that play arbitrary Atari 2600 games and, therefore, offers a method to evaluate the development of general, domain-independent reinforcement learning agents [77]. Its source code is publicly available on the Internet [78]. Through the ALE, researchers have access to several dozen games through a single common interface. Eighteen actions can be input to the game via a digital joystick: three positions of the joystick for each axis, plus a single button. The DQN approach of Reference [15] outperformed the best existing reinforcement learning methods on 43 of the 49 games without incorporating any of the additional prior knowledge about the Atari 2006 games used by other approaches. In conclusion, the DQN algorithm trained itself and reached super-human performance just by using the game pixels as the observation and the game score as the reward signal from the environment.
The work by Mnih et al. [15] inspired the authors to test the DQN agent as a reinforcement learning approach to the performance challenge, as discussed earlier in this article (cf. Section 1). For the experiments, the general working principles of the DQN agent have been retained, but the parameters of this agent have been slightly adjusted. The implementation of the DQN has been built with the Python API for TensorFlow, an open-source software library for numerical computations using data flow graphs [79]. After the reinforcement learning agent applies an action to the database, the simulation model is instantiated and the simulation is run as described above. A reward calculation function generates the reward signal from the simulation output data by computing a scalar reward signal, using the changes in costs and performance. The reward signal is then routed back to the DQN for training [80]. In order to express the state s of the logistics system configuration as an image, a feature extraction function selects the different features from the tables in the MySQL database and composes them into an image (Figure 4).
The image has been designed to look similar to an Atari game screen in order to make the problem accessible for the DQN agent. The general idea behind the design of the state representation as an image is to profit from the research regarding further domain-independent agents in the future.
Since the agent needs to learn a mapping from states to actions, the state representation also needs to encode information that enables for concluding from states to actions. For instance, if the agent is intended for learning to make a decision regarding the inventory, useful information to make such a decision, for example, inventory levels and customer demands, needs to be included in the state representation. For actions regarding, for example, machines, other information is needed in the state representation. Thus, the information needed in the state representation heavily depends on the action types available in the system (see Section 4.2). Consequently, the features that have to be selected from the MySQL database for the state s are derived from the action types used. In order to address the requirements regarding the scalability of the state representation, the state image is built from different image segments. Each segment corresponds to a segment type, similar to the previously explained relationship between actions and action types. The size of each segment is fixed. The actual segment size is derived from the size of the largest segment type. The overall design was chosen to enable the CNN to more easily identify patterns within the state data.
In order to generate a scalar reward signal for the reinforcement learning agent, a decrease in the total costs after taking an action is translated into a positive reward. An increase in the total costs, on the other hand, is translated into a negative reward. Furthermore, besides the bare costs, the difference in the logistics performance before and after applying the action is also incorporated into the reward. The authors have decided to define a penalty cost that is multiplied with the percentage change in the service level. If the service level decreases, a penalty is generated. If the service level increases, a bonus payment is generated. The service level costs are meant to express the loss of customer orders in the future due to unsatisfied customers, or the increase of customer orders from satisfied customers. The difference in the logistics costs and the service level costs are summed up and interpreted as the total costs caused by an action. Finally, these total costs are scaled down to generate the final reward signal, which is sent back to the agent. The scaling is done to get as close as possible to the architecture used in the original DQN implementation.
6. Addressing the Performance Challenge: Exploiting Domain-Specific Information
The performance of the LAS can be evaluated based on the impact of the recommended action plans on the distribution network and on the number of simulation runs. This section focuses on guiding the metaheuristic algorithm in the heuristic unit to find promising actions to be added to the action plan. The approach investigates the potential actions and explores information to guide the search. This information is called domain-specific information and is added to the action type definitions, such as the type of changes, success, and correlation (Section 4.2) [68,73,74].
6.1. Utilizing the Characteristics of Action Type Classes
The first illustrated DSI concerns the type of changes applied by an action. An action can change a parametrical value of an entity in a distribution network, for example, the stock level of an SKU at a site. Actions of this kind are called parametrical actions. For example, an action that increases the stock level of SKU 1 at site A is a parametrical action.
Other actions might add an entity to the network or delete an entity. These actions cause structural changes in the network, such as centralising SKU 1 at site A. These actions cause structural and parametrical changes. Centralising SKU 1 at site A is realised by several changes, for example, adding SKU 1 to site A if it is not at site A, removing SKU 1 from the other sites, establishing transport relations between site A and the other sites if not currently existing, and specifying the parametrical values of SKU 1 at site A. This action should define the parametrical values for the newly added entities, for example, SKU 1 at site A, and the transport relations between site A and the other sites.
Accordingly, actions are classified as structural or parametrical based on their type of changes. Structural actions cause significant changes in the network. Their changes delete the impact of previously applied parametrical actions if they affect the same entity in the network. For example, action increases the stock level of SKU 1 at site B, and centralises SKU 1 at site A. Action removes SKU 1 at site B from the network when it is applied. If follows , the change in the stock level caused by is removed by removing the entity by .
In order to consider the structural and parametrical changes in the selection of actions, the selection probability of an action is biased according to its type of changes and its position in an action plan. Structural actions are preferred at the beginning of an action plan and parametrical actions at its end. Figure 5 shows a proposed probability distribution of actions’ types of changes that changes linearly along the length of an action plan, l. In Equations (1) and (2), is the selection probability of structural actions at position i of an action plan. If structural changes are selected, a structural action is selected from the potential structural actions.
6.2. Building on Success Experience
Another DSI is the success of actions in improving the performance of a distribution network. The term success is defined with respect to an action. The impact of an action on a network is investigated to determine whether it increases or decreases the performance measures. For example, Figure 6 shows actions, and , that increase the service level and an action, , that reduces the service level. Actions that increase the service level get a higher success value than the actions that decrease the service level. Within the actions that increase the service level, their impact of the actions varies, and accordingly, their success value varies, such as and in Figure 6.
Actions with a high success value tend to increase the performance of the network, and hence, increasing their selection probability might guide the metaheuristic algorithm to construct promising action plans. Actions with a high success value get a higher selection probability than actions with a lower success value. For example, the selection probabilities of the actions in Figure 6 might be assigned as 0.32, 0.28, 0.24, and 0.16 to actions , , , and , respectively.
While the success values of concrete actions can only be measured for the single and parametrized actions themselves, these values cannot be expected to contribute to the performance improvement, directly, because there is a low probability that the specific current action has already been evaluated before and, thus, owns a success attribute. Therefore, success may have to be regarded only indirectly: Measured success values of actions are summarized for the respective action types, and this success attribute of the action types is then used to steer the construction of action plans. With this procedure, action types are preferred if the associated actions have often led to improvements in the past.
6.3. Defining Relations between Actions
The last DSI that we propose is the correlation between two actions and their impact on the performance of the network. In this context, the joint impact of a sequence of two actions on the performance of a network is compared to their expected impact if they are applied individually. In Figure 7, the expected impact of applying actions and is an increase of 0.19% in the service level, given by the summation of the impact of the single actions (0.12%) and (0.07%). Actually, the sequence followed by increases the service level by only 0.15%. Thus, applying these two actions as has a negative influence (“−”). The sequence causes an increase in the service level by 0.28%. Thus, it has a positive impact (“+”) compared to the expected impact of the single actions. Another example of the positive impact is the sequence . If the expected impact of a sequence does not differ from the actual impact, the relation is a weak relation (“∼”), for example, sequence in Figure 7.
The correlation between actions could be tabulated in a correlation matrix. Rows represent the first applied action in the sequence, and columns represent the second applied action. The cells show the relation between the impact of a sequence of actions and their expected impact on the network as “+”, “∼”, and “−” for positive, weak, and negative relations, respectively. The relations extracted from Figure 7 are tabulated in Table 2. The rest of the correlation matrix shows relations between other actions in the search space.
The cell between and is a duplication of an action. An action can be duplicated by applying it twice. If an action increases the stock level of an SKU at a site by 10 units, its duplication increases the stock level by 20 units. Accordingly, the performance of the network is affected and might vary from the expected impact.
Similar to the previous section, applying actions affects the performance of the network, and their impact might be used to guide the selection of actions to construct promising action plans. The selection probability of actions is increased if the actions are in a positive relation with already selected actions. For example, if action is selected, then the recommended action is to increase the service level (Table 2). Selecting does not increase the service level as expected, and selecting does not influence the expected increase in the value. Thus, the selection probability of becomes higher than .
7. Addressing the Performance Challenge: Reducing the Number of Evaluations
Another performance measure of the LAS is the number of simulation runs, which we define to be the number of objective function evaluations. In order to reduce the number of evaluations of the objective function, a selective evaluation might be performed, or evaluations might be skipped. In this research, the evaluation of the impact of an action plan is skipped if the action plan has previously been evaluated [81].
Previously evaluated action plans might be identical to newly formed action plans, or they can be equivalent to them. Equivalent action plans have an identical impact on the performance of the distribution network, but are not identical action plans. Figure 8 shows an example of equivalent action plans. These action plans cause the same changes in the network and, hence, result in the same impact on the performance. The performance of an equivalent action plan can directly be used, without again evaluating the performance of the newly formed plan.
In order to identify equivalent action plans we define interchangeable and redundant actions. Interchangeable actions can be reordered in an action plan without affecting the impact of the action plan on the performance of the network (Figure 8a). Actions and in Figure 8a have been reordered without affecting the applied changes and the impact of the action plan on the service level; and are interchangeable actions. Actions that affect different entities in the network can be reordered without affecting the impact of the action plan. These actions are interchangeable if they do not interfere with an overall parameter of the network, such as the capacity of a site. For example, increases the stock level of SKU 1 at site A, and increases the stock level of SKU 2 at site A. Both actions affect different entities in the network, SKU 1 at site A and SKU 2 at site A. Applying the changes by any of the actions does not affect the changes applied by the other action. However, if the total capacity of site A reaches its limit after applying any of these actions, the resulting applied changes differ when the actions are swapped.
Redundant actions can be removed from the action plan without affecting the impact of the action plan on the distribution network (Figure 8b). Action has been removed from the action plan in Figure 8b. The resulting action plan applies the same changes as the original action plan, without removing , and the service remains unchanged. Action is a redundant action, because its removal has no effect on the changes applied in the network. These actions can be duplicated structural actions. A structural action adds or removes entities from the network, and its duplication repeats these changes without causing additional changes in the network. A duplicated parametrical action that causes incremental changes is not redundant, because it causes an incremental increase or decrease in the value of the affected parameter.
Defining the equivalent action plans based on interchangeable and redundant actions enables skipping the evaluation of an action plan. An action plan is rated as its equivalent action plan that was evaluated previously.
Another approach reduces the number of actions to reduce the number of evaluations. In this approach, actions are grouped. The grouped actions replace actions and form a smaller search space of actions to be explored. For example, if two actions are grouped, the search space of actions can be reduced from 100 actions to 50 actions. Exploring the search space of 50 actions obviously requires a smaller number of evaluations.
The grouping criteria might be defined by the decision-maker, for example, grouping actions that affect SKUs based on an SKU assortment at a site [17]. For example, a distribution network has two sites, site A and site B. Assortment 1 includes SKU 1 and SKU 2, and assortment 2 includes SKU 3 and SKU 4. Then, action that increases the stock level of SKU 1 at site A and action that increases the stock level of SKU 2 at site A are grouped to form a new action that increases the stock level of SKUs in assortment 1 at site A. Similarly, action that increases the stock level of SKU 1 at site B and that increases the stock level of SKU 2 at site B are grouped to form the new action that increases the stock level of SKUs in assortment 2 at site B. The reduction in the number of actions depends on the number of actions assigned to an assortment. As a result, the optimisation algorithm explores a smaller number of actions.
In order to construct an action plan from the grouped actions, the number of selected grouped actions is almost certainly lower than the length of the action plan. Four actions are selected to form an action plan of length four. If two actions are grouped, they form an action plan of length four. Therefore, this reduction in the number of selected actions further reduces the number of potential action plans and the number of evaluations.
8. Evaluation and Results
In order to test the proposed approaches, we used a database from a distribution network of an international material trading company. The database was extracted from their enterprise resource planning system and was verified and validated according to a procedure model presented by Rabe et al. [82]. In this research, we filtered this database down to a subset of five sites and 30 SKUs. This database represents the database in Figure 1. Then, we adapted the evolutionary algorithm to utilise the actions’ DSI. This information is assigned to the action types, and from there then it is inherited to the derived actions from the action types. The selection probability of actions is changed based on their DSI. For example, considering the actions’ type of changes, the actions are classified as structural and parametrical actions. The selection probability of these classes is changed according to Equations (1) and (2). An action is selected randomly from the respective selected class. Thus, the selection probability of actions is biased based on their type of changes.
We compared a completely random selection of actions with a biased selection of actions in the construction of action plans in the EA’s initial generation. The number of generations that were required to stagnate and the quality of the corresponding recommended action plans were recorded for the comparison. The quality of the action plans has been evaluated based on the costs and the service level. Fifty individuals form a generation in the EA. The crossover and mutation probabilities were set to 0.8 and 0.3, respectively. The crossover forms, CR, were the one-point crossover, the two-point crossover, and the uniform crossover. In mutation, MU, one randomly selected action was replaced, or multiple actions were selected to be replaced. Each experiment setup was run ten times. Table 3 records the average performance and demonstrates the gap analysis of the difference between random selection and the biased selection of actions.
Next, we have tested the approach that exploits the definition of equivalent action plans. In this experiment, the EA selected actions randomly, and the evaluation of an action plan was skipped if an equivalent action plan was previously evaluated. Figure 9 shows the time distribution during an experiment run when the crossover and the mutation probabilities were set to 0.8 and 0.3, respectively. The number of simulation runs decreased by more than 15%.
For the experimentation with the DQN agent, the authors assumed that one training episode for the reinforcement learning agent consists of taking three actions. Hence, once the three actions have been taken, the simulation is reset to its initial state and the agent can start a new training episode. The hyper-parameters of the architecture have been kept mostly the same for all the experiments. However, further architectures for the internal DQN were tested. For each architecture, the reinforcement learning agent was trained with at least 1000 episodes, each consisting of taking three actions, which resulted in at least 3000 evaluative simulation runs for each architecture. In most of the cases, the agent was able to gradually learn to take the best three actions possible for the initial state of the logistics network after about half of the training episodes. By conducting these experiments, the authors could demonstrate that a general reinforcement learning agent was able to generate action plans just from its trained internal value function approximation. Hence, in general, the presented approach can be used to reduce the response time (cp. Section 1). However, as a drawback, the total runtime of each experiment took several days. As expected, the bottleneck in terms of computing performance was not the back-propagation through the CNN, but the simulation time needed for each evaluative simulation run. Although the experiments have been performed on relatively small test models of a logistics network, the results of the experiments with the DQN implementation were promising, since they showed that a general purpose reinforcement learning agent can in fact be trained to optimize a logistics network model solely from a state representation, a reward signal, and the available actions types.
9. Discussion
The approaches explained in Section 4 and Section 5 aim to improve the performance of the LAS. This performance is evaluated based on the performance of the simheuristic’s components – metaheuristics and simulation. The quality of found solutions is a major performance measure to evaluate the metaheuristics used to solve an optimisation problem [7]. Additionally, the run time of the algorithm is used to evaluate it [83]. In this research, we used the objective values of the found solutions and the number of simulation runs to evaluate the recommended approaches. The number of simulation runs represents the number of objective function evaluations, which is an indicator of the run time of an algorithm to recommend a solution [27].
Researchers proposed approaches to improve the performance of the metaheuristics by focusing on the analysis of the search space. For example, Bode et al. [41] screened solutions before their evaluation. Karimi et al. [84] clustered the problem’s search space before exploring it, and Ku and Arthanari [85] replaced the search space with a smaller space. Furthermore, researchers have filtered the solutions to reduce the number of objective function evaluations, such as Cai et al. [86] and Alsheddy et al. [13].
Other approaches have examined the search algorithms. They investigated improvements to the local search, such as Alsheddy et al. [13], who aimed to escape from a local optimum by introducing penalties. Other researchers have investigated machine learning and data mining to learn from the patterns [87,88]. Amaran et al. [89] stated that problem information could be used to construct initial promising solutions as an input to the optimisation algorithm. Forming these solutions by selecting its parts randomly based on problem information is called randomly biased selection [42].
In Section 6, we introduced an approach to guide the search of a metaheuristic algorithm. In this approach, DSI is used to prioritise which actions to select while constructing action plans. The experiments utilising the type of changes to construct action plans showed promising results for identifying initial solutions for the algorithm. We used the Mann-Whitney U test [90] to compare our approach to random selection of actions. The null hypothesis in comparing the random selection and the biased selection is rejected concerning decreasing costs, increasing the service level, and reducing the number of generations to stagnate at p-values of 0.0961, 0.0000, and 0.0000, respectively. These results suggest a significant impact of DSI on the performance of the metaheuristics of the LAS, and our claims of recommending better solutions’ quality and decreasing the number of generations to stagnate are accepted.
The domain-specific information can be used to alter the variation operators of the found action plans in the subsequent iterations in a metaheuristic algorithm. In our research, these operators are represented as modified crossover and mutation. Because initial solutions based on the type of changes helped the algorithm to recommend better solutions than the random selection of actions, we expect to get a similar effect in implementing them in crossover and mutation. Combining different DSI is a field for further investigation.
In addition, we propose an approach to reduce the number of simulation runs by defining equivalent solutions. This approach keeps a list of evaluated solutions and increases the EA’s computational time a bit; but this is compensated by a reduction in the number of simulation runs (Figure 9). The memory usage might be overcome if the algorithm can have access to a table where this list of evaluated solutions is stored.
In conclusion, simulation runs consume a large portion of the computational time of the algorithm run in a simheuristic approach. Our approach reduced this percentage and enabled the algorithm to recommend solutions in shorter time.
10. Summary and Outlook
In this research, we have developed a logistics assistance system to support decision-making in material trading networks. Decision-makers face a challenging task in selecting actions to improve the performance of the networks. The developed LAS is based on a simheuristics framework that combines simulation and metaheuristics. For the metaheuristics, we have studied reinforcement learning and evolutionary algorithms. Additionally, we have proposed approaches to address performance challenges of the LAS that are represented as the quality of recommended actions and the number of simulation runs. Our approaches are based on utilising domain-specific information, reducing the number of actions, and defining equivalent solutions.
We have developed a suitable implementation and used a subset of real-world data to evaluate our LAS. Our results show that reinforcement learning requires a significant training time. However, after learning, it recommends promising actions upon request. The domain-specific information approach guides the search of an optimisation algorithm to select promising actions, and hence, improves the performance of the LAS. Defining equivalent action plans has reduced the number of simulation runs by up to 15%.
Our approaches are limited to distribution networks. We defined and tested them on a distribution network of an international trading company. In other networks or applications, the specific definition of the domain-specific information as well as of the equivalency of action plans should be studied.
For further research, we investigate other domain-specific information to guide the selection of actions in the LAS. Taking advantage of combining reinforcement learning and the evolutionary algorithm is another approach to be investigated. This combination requires the study of the schema to integrate both approaches. Furthermore, new parameters might become necessary to be defined and initialised.
Author Contributions
Conceptualization and research supervision, M.R.; General methodology of LAS and implementation of decision support system, F.D.; Development of domain-specific description language, D.S.; Development and evaluation of reinforcement learning approach, F.D.; Development and evaluation of domain-specific biasing methods, M.A.; Design of paper M.R. and M.A.; Original draft preparation, M.A.; Editing, M.R. and M.A.; Supervision, M.R. All authors have read and agreed to the published version of the manuscript.
Funding
This research was partially funded by the German University of Jordan, the Graduate School of Logistics in Dortmund (Germany) and by thyssenkrupp Materials International GmbH.
Data Availability Statement
This research has been based on real enterprise data taken from the IT systems of a German company. These data have been handed out under strict NDA and experience specific procedures to ensure their classification, which unfortunately hinders their free release.
Conflicts of Interest
The authors declare no conflict of interest.
Abbreviations
The following abbreviations are used in this manuscript:
| SKU | stock keeping unit |
| KPI | key performance indicator |
| EA | evolutionary algorithm |
| DES | discrete event simulation |
| LAS | logistics assistance system |
| CNN | Convolutional Neural Network |
| KPIMS | key performance indicator management system |
| IDE | integrated development interface |
| DGN | Deep Q-Network |
| ALE | Arcade Learning Environment |
| DSI | domain-specific information |
| CR | crossover form |
| MU | mutation form |
References
- Stadtler, H. Supply Chain Management—An Overview. In Supply Chain Management and Advanced Planning: Concepts, Models, Software, and Case Studies; Stadtler, H., Kilger, C., Eds.; Springer: Berlin/Heidelberg, Germany, 2008; pp. 9–36. [Google Scholar]
- Ravindran, A.R. Managing Supply Chains: An Introduction. In Multiple Criteria Decision Making in Supply Chain Management; Ravindran, A.R., Ed.; CRC Press, Taylor and Francis Group: Boca Raton, FL, USA, 2016; pp. 1–14. [Google Scholar]
- Sürie, C.; Wagner, M. Supply Chain Analysis. In Supply Chain Management and Advanced Planning: Concepts, Models, Software, and Case Studies; Stadtler, H., Kilger, C., Eds.; Springer: Berlin/Heidelberg, Germany, 2008; pp. 37–64. [Google Scholar]
- Buriol, L.S. Network Optimization. In Handbook of Heuristics; Martí, R., Pardalos, P.M., Resende, M.G.C., Eds.; Springer: Cham, Switzerland, 2018; pp. 1123–1140. [Google Scholar]
- Law, A.M. Simulation Modeling and Analysis, 5th ed.; McGraw-Hill: New York, NY, USA, 2015. [Google Scholar]
- Bianchi, L.; Dorigo, M.; Gambardella, L.M.; Gutjahr, W.J. A Survey on Metaheuristics for Stochastic Combinatorial Optimization. Nat. Comput. 2009, 8, 239–287. [Google Scholar] [CrossRef] [Green Version]
- Talbi, E.G. Metaheuristics: From Design to Implementation; John Wiley and Sons: Hoboken, NJ, USA, 2009. [Google Scholar]
- Datta, S.; Roy, S.; Davim, J.P. Optimization Techniques: An Overview. In Optimization in Industry: Present Practices and Future Scopes; Datta, S., Davim, J.P., Eds.; Management and Industrial Engineering; Springer International Publishing: Cham, Switzerland, 2019; pp. 1–11. [Google Scholar]
- Juan, A.A.; Faulin, J.; Grasman, S.E.; Rabe, M.; Figueira, G. A Review of Simheuristics: Extending Metaheuristics to Deal with Stochastic Combinatorial Optimization Problems. Oper. Res. Perspect. 2015, 2, 62–72. [Google Scholar] [CrossRef] [Green Version]
- Banks, J.; Carson, J.S., II; Nelson, B.L.; Nicol, D.M. Discrete-Event System Simulation, 5th ed.; Pearson: Upper Saddle River, NJ, USA, 2010. [Google Scholar]
- Ding, H.; Benyoucef, L.; Xie, X. Stochastic Multi-objective Production-distribution Network Design Using Simulation-based Optimization. Int. J. Prod. Res. 2009, 47, 479–505. [Google Scholar] [CrossRef]
- Deininger, M. Modellierungsmethode für die Simulationsbasierte Optimierung Rekonfigurierbarer Produktionssysteme; Fortschritte in der IT in Produktion und Logistik, Cuvillier: Göttingen, Germany, 2019. [Google Scholar]
- Alsheddy, A.; Voudouris, C.; Tsang, E.P.K.; Alhindi, A. Guided Local Search. In Handbook of Heuristics; Martí, R., Pardalos, P.M., Resende, M.G.C., Eds.; Springer: Cham, Switzerland, 2018; pp. 261–297. [Google Scholar]
- Singh, S.; Litman, D.; Kearns, M.; Walker, M. Optimizing Dialogue Management with Reinforcement Learning: Experiments with the NJFun System. J. Artif. Intell. Res. 2002, 16, 105–133. [Google Scholar] [CrossRef]
- Mnih, V.; Kavukcuoglu, K.; Silver, D.; Rusu, A.A.; Veness, J.; Bellemare, M.G.; Graves, A.; Riedmiller, M.; Fidjeland, A.K.; Ostrovski, G.; et al. Human-level Control through Deep Reinforcement Learning. Nature 2015, 518, 529–533. [Google Scholar] [CrossRef]
- Rabe, M.; Dross, F.; Schmitt, D.; Ammouriova, M.; Ipsen, C. Decision Support for Logistics Networks in Materials Trading Using a Simheuristic Framework and User-generated Action Types. In Simulation in Production and Logistics 2017; Wenzel, S., Peter, T., Eds.; Kassel University Press: Kassel, Germany, 2017; pp. 109–118. [Google Scholar]
- Rabe, M.; Schmitt, D.; Ammouriova, M. Improving the Performance of a Logistics Assistance System for Materials Trading Networks by Grouping Similar Actions. In Proceedings of the 2018 Winter Simulation Conference, Gothenburg, Sweden, 9–12 December 2018; pp. 2861–2872. [Google Scholar]
- VDI-Guideline 3633.1. In Simulation of Systems in Materials Handling, Logistics, and Production: Fundamentals; Beuth: Berlin, Germany, 2014.
- Schmidt, J.W.; Taylor, R.E. Simulation and Analysis of Industrial Systems; Irwin Series in Quantitative Analysis for Business; Irwin: Homewood, IL, USA, 1970. [Google Scholar]
- Rabe, M.; Spieckermann, S.; Wenzel, S. Verifikation und Validierung für die Simulation in Produktion und Logistik: Vorgehensmodelle und Techniken; Springer: Berlin/Heidelberg, Germany, 2008. [Google Scholar]
- Gutenschwager, K.; Rabe, M.; Spieckermann, S.; Wenzel, S. Simulation in Produktion und Logistik: Grundlagen und Anwendungen; Springer Vieweg: Berlin/Heidelberg, Germany, 2017. [Google Scholar] [CrossRef]
- Balci, O.; Fujimoto, R.M.; Goldsman, D.; Nance, R.E.; Zeigler, B.P. The State of Innovation in Modeling and Simulation: The Last 50 Years. In Proceedings of the 2017 Winter Simulation Conference, Las Vegas, NV, USA, 3–6 December 2017; pp. 821–836. [Google Scholar]
- Fanti, M.P.; Iacobellis, G.; Ukovich, W.; Boschian, V.; Georgoulas, G.; Stylios, C. A Simulation Based Decision Support System for Logistics Management. J. Comput. Sci. 2015, 10, 86–96. [Google Scholar] [CrossRef]
- Pujawan, N.; Arief, M.M.; Tjahjono, B.; Kritchanchai, D. An Integrated Shipment Planning and Storage Capacity Decision Under Uncertainty: A Simulation Study. Int. J. Phys. Distr. Log. 2015, 45, 913–937. [Google Scholar] [CrossRef] [Green Version]
- Fang, D.J.; Li, C. Simulation-based Hybrid Approach to Robust Multi-echelon Inventory Policies for Complex Distribution Networks. Int. J. Simul. Model. 2014, 13, 377–387. [Google Scholar] [CrossRef]
- Ivanov, D. Simulation-based Ripple Effect Modelling in the Supply Chain. Int. J. Prod. Res. 2017, 55, 2083–2101. [Google Scholar] [CrossRef]
- Spall, J.C. Introduction to Stochastic Search and Optimization: Estimation, Simulation and Control; Wiley-Interscience: Hoboken, NJ, USA, 2003. [Google Scholar]
- Lawler, E.L. Combinatorics. In Encyclopedia of Operations Research and Management Science; Gass, S.I., Fu, M.C., Eds.; Springer: Boston, MA, USA, 2013; pp. 192–194. [Google Scholar] [CrossRef]
- Schrijver, A. Polyhedral Combinatorics and Combinatorial Optimization. J. Ann.-Rech. Oper. 2004, 15, 59–74. [Google Scholar]
- Taylor, B.W. Introduction to Management Science, 11th ed.; Pearson: Boston, MA, USA, 2013. [Google Scholar]
- Korte, B.; Vygen, J. Combinatorial Optimization: Theory and Algorithms, 6th ed.; Algorithms and Combinatorics; Springer: Berlin/Heidelberg, Germany, 2018; Volume 21. [Google Scholar] [CrossRef]
- Sörensen, K.; Glover, F. Metaheuristics. In Encyclopedia of Operations Research and Management Science; Gass, S.I., Fu, M.C., Eds.; Springer: Boston, MA, USA, 2013; Volume 1, pp. 960–970. [Google Scholar] [CrossRef]
- Osaba, E.; Carballedo, R.; Diaz, F.; Onieva, E.; de La Iglesia, I.; Perallos, A. Crossover Versus Mutation: A Comparative Analysis of the Evolutionary Strategy of Genetic Algorithms Applied to Combinatorial Optimization Problems. Sci. World J. 2014. [Google Scholar] [CrossRef] [Green Version]
- Cybulski, R. Vergleich zwischen Algorithmen zur Optimierung Logistischer Netzwerke. Bachelor’s Thesis, TU Dortmund University, Dortmund, Germany, 2018. [Google Scholar]
- Juan, A.A.; Rabe, M. Combining Simulation with Heuristics to Solve Stochastic Routing and Scheduling Problems. In Simulation in Production andLogistics—Entscheidungsunterstützung von der Planung bis zur Steuerung; Dangelmaier, W., Laroque, C., Klaas, A., Eds.; HNI-Verlagsschriftenreihe: Paderborn, Germany, 2013; pp. 641–649. [Google Scholar]
- Figueira, G.; Almada-Lobo, B. Hybrid Simulation—Optimization Methods: A Taxonomy and Discussion. Simul. Model. Pract. Theory 2014, 46, 118–134. [Google Scholar] [CrossRef] [Green Version]
- VDI-Guideline 3633.12. In Simulation of Systems in Materials Handling, Logistics, and Production: Simulation and Optimisation; Beuth: Berlin, Germany, 2016.
- Jackson, I.; Tolujevs, J.; Reggelin, T. The Combination of Discrete-event Simulation and Genetic Algorithm for Solving the Stochastic Multi-product Inventory Optimization Problem. Transp. Telecommun. J. 2018, 19, 233–243. [Google Scholar] [CrossRef] [Green Version]
- Gutenschwager, K.; Wilhelm, B.; Völker, S. Speeding up Simulation-based Optimization of Supply Networks by Means of a Multi-population Genetic Algorithm and Reuse of Partial Solutions. In Proceedings of the 2018 Winter Simulation Conference; Rabe, M., Juan, A.A., Mustafee, N., Skoogh, A., Jain, S., Johansson, B., Eds.; IEEE: Piscataway, PA, USA, 2018; pp. 3036–3047. [Google Scholar] [CrossRef]
- Pagès-Bernaus, A.; Ramalhinho, H.; Juan, A.A.; Calvet, L. Designing e-Commerce Supply Chains: A Stochastic Facility—Location Approach. Int. Trans. Oper. Res. 2019, 26, 507–528. [Google Scholar] [CrossRef]
- Bode, F.; Reed, P.; Reuschen, S.; Nowak, W. Search Space Representation and Reduction Methods to Enhance Multiobjective Water Supply Monitoring Design. Water Resour. Res. 2019, 55, 2257–2278. [Google Scholar] [CrossRef]
- Grasas, A.; Juan, A.A.; Faulin, J.; de Armas, J.; Ramalhinho, H. Biased Randomization of Heuristics Using Skewed Probability Distributions: A Survey and some Applications. Comput. Ind. Eng. 2017, 110, 216–228. [Google Scholar] [CrossRef]
- Pétrowski, A.; Ben-Hamida, S. Evolutionary Algorithms; Metaheuristics Set; Wiley-Iste: London, UK, 2017; Volume 9. [Google Scholar]
- Ahn, C.W. Advances in Evolutionary Algorithms: Theory, Design and Practice; Studies in Computational Intelligence; Springer: Berlin/Heidelberg, Germany, 2006; Volume 18. [Google Scholar] [CrossRef]
- Chong, E.K.P.; Żak, S.H. An Introduction to Optimization, 4th ed.; Wiley: Hoboken, NJ, USA, 2013. [Google Scholar]
- Dulebenets, M.A. An Adaptive Island Evolutionary Algorithm for the Berth Scheduling Problem. Memetic Comput. 2020, 12, 51–72. [Google Scholar] [CrossRef]
- Pasha, J.; Dulebenets, M.A.; Kavoosi, M.; Abioye, O.; Wang, H.; Guo, W. An Optimization Model and Solution Algorithms for the Vehicle Routing Problem With a “Factory-in-a-Box”. IEEE Access 2020, 8, 134743–134763. [Google Scholar] [CrossRef]
- Moradi, B. The New Optimization Algorithm for the Vehicle Routing Problem with Time Windows using Multi-objective Discrete Learnable Evolution Model. Soft Comput. 2020, 24, 6741–6769. [Google Scholar] [CrossRef]
- Zhao, H.; Zhang, C. An Online-learning-based Evolutionary Many-objective Algorithm. Inf. Sci. 2020, 509, 1–21. [Google Scholar] [CrossRef]
- Coello Coello, C.A. Multi-objective Optimization. In Handbook of Heuristics; Martí, R., Pardalos, P.M., Resende, M.G.C., Eds.; Springer: Cham, Switzerland, 2018; pp. 177–204. [Google Scholar]
- Ji, S.F.; Luo, R.j.; Peng, X.S. A Probability Guided Evolutionary Algorithm for Multi-objective Green Express Cabinet Assignment in Urban Last-mile Logistics. Int. J. Prod. Res. 2019, 57, 3382–3404. [Google Scholar] [CrossRef]
- Jiang, E.d.; Wang, L. An Improved Multi-objective Evolutionary Algorithm based on Decomposition for Energy-efficient Permutation Flow Shop Scheduling Problem with Sequence-dependent Setup Time. Int. J. Prod. Res. 2019, 57, 1756–1771. [Google Scholar] [CrossRef]
- Kang, P.S.; Bhatti, R.S. Continuous Process Improvement Implementation Framework using Multi-objective Genetic Algorithms and Discrete Event Simulation. Bus. Process. Manag. J. 2019, 25, 1020–1039. [Google Scholar] [CrossRef] [Green Version]
- Kohl, N.; Stone, P. Policy Gradient Reinforcement Learning for Fast Quadrupedal Locomotion. In Proceedings of the IEEE International Conference on Robotics and Automation, 2004. ICRA ’04. 2004, New Orleans, LA, USA, 26 April–1 May 2004; pp. 2619–2624. [Google Scholar]
- Ng, A.Y.; Coates, A.; Diel, M.; Ganapathi, V.; Schulte, J.; Tse, B.; Berger, E.; Liang, E. Autonomous Inverted Helicopter Flight via Reinforcement Learning. In Experimental Robotics IX; Siciliano, B., Khatib, O., Groen, F., Ang, M.H., Eds.; Springer: Berlin/Heidelberg, Germany, 2006; Volume 21, pp. 363–372. [Google Scholar]
- Arulkumaran, K.; Deisenroth, M.P.; Brundage, M.; Bharath, A.A. Deep Reinforcement Learning: A Brief Survey. IEEE Signal Process. Mag. 2017, 34, 26–38. [Google Scholar] [CrossRef] [Green Version]
- Scholkopf, B. Artificial Intelligence: Learning to See and Act. Nature 2015, 518, 486–487. [Google Scholar] [CrossRef] [PubMed]
- Hinton, G.E.; Salakhutdinov, R.R. Reducing the Dimensionality of Data with Neural Networks. Science 2006, 313, 504–507. [Google Scholar] [CrossRef] [Green Version]
- Bengio, Y. Learning Deep Architectures for AI. Found. Trends Mach. Learn. 2009, 2, 1–127. [Google Scholar] [CrossRef]
- Krizhevsky, A.; Sutskever, I.; Hinton, G.E. ImageNet Classification with Deep Convolutional Neural Networks. In Proceedings of the Advances in Neural Information Processing Systems 25 (NIPS 2012), Lake Tahoe, NV, USA, 3–6 December 2012. [Google Scholar]
- McClelland, J.L.; Rumelhart, D.E. Parallel Distributed Processing: Explorations in the Microstructure of Cognition, 1st ed.; A Bradford Book; MIT Press: Cambridge, MA, USA, 1986. [Google Scholar]
- LeCun, Y.; Bengio, Y.; Hinton, G. Deep Learning. Nature 2015, 521, 436–444. [Google Scholar] [CrossRef]
- Goodfellow, I.; Bengio, Y.; Courville, A. Deep Learning; MIT Press: Cambridge, MA, USA, 2016. [Google Scholar]
- Lecun, Y.; Bottou, L.; Bengio, Y.; Haffner, P. Gradient-based Learning Applied to Document Recognition. Proc. IEEE 1998, 86, 2278–2324. [Google Scholar] [CrossRef] [Green Version]
- Mnih, V.; Kavukcuoglu, K.; Silver, D.; Graves, A.; Antonoglou, I.; Wierstra, D.; Riedmiller, M. Playing Atari with Deep Reinforcement Learning. 2013. Available online: arxiv.org/abs/1312.5602 (accessed on 14 December 2020).
- Li, Y. Deep Reinforcement Learning: An Overview. 2017. Available online: arxiv.org/abs/1701.07274 (accessed on 14 December 2020).
- Dross, F.; Rabe, M. A SimHeuristic Framework as a Decision Support System for Large Logistics Networks with Complex KPIs. In Proceedings of the 22nd Symposium Simulationstechnik, Berlin, Germany, 3–5 September 2014; pp. 247–254. [Google Scholar]
- Rabe, M.; Ammouriova, M.; Schmitt, D. Utilizing Domain-specific Information for the Optimization of Logistics Networks. In Proceedings of the 2018 Winter Simulation Conference, Gothenburg, Sweden, 9–12 December 2018; pp. 2873–2884. [Google Scholar]
- SimPlan AG. SimChain. 2018. Available online: www.simchain.net (accessed on 14 December 2020).
- Rabe, M.; Gutenschwager, K.; Fechteler, T.; Sari, M.U. A Data Model for Carbon Footprint Simulation in Consumer Goods Supply Chain. In Proceedings of the 2013 Winter Simulation Conference, Washington, DC, USA, 8–11 December 2013; pp. 2677–2688. [Google Scholar]
- Rabe, M.; Schmitt, D.; Dross, F. Method to Model Actions for Discrete-event Simulation of Logistics Networks. In Proceedings of the 2017 Winter Simulation Conference, Las Vegas, NV, USA, 3–6 December 2017; pp. 3370–3381. [Google Scholar]
- Rabe, M.; Schmitt, D. Domain-specific Language for Modeling and Simulating Actions in Logistics Networks. In Proceedings of the 2019 Winter Simulation Conference, National Harbor, MD, USA, 8–11 December 2019; pp. 1579–1590. [Google Scholar]
- Rabe, M.; Schmitt, D.; Ammouriova, M. Utilizing Domain-specific Information in Decision Support for Logistics Networks. In Dynamics in Logistics: Proceedings of the 6th International Conference LDIC 2018, Bremen, Germany; Freitag, M., Kotzab, H., Pannek, J., Eds.; Lecture Notes in Logistics; Springer International Publishing: Cham, Switzerland, 2018; pp. 413–417. [Google Scholar]
- Rabe, M.; Ammouriova, M. Constructing Action Plans Based on Correlation between Sequential Actions and their Performance in Logistics Distribution Networks. In Proceedings of the 13th International Conference of Research in Logistics and Supply Chain Management, Le Havre, France, 7–9 October 2020. [Google Scholar]
- Rabe, M.; Schmitt, D.; Klueter, A.; Hunker, J. Decoupling the Modeling of Actions in Logistics Networks from the Underlying Simulation Data Model. In Advances in Production, Logistics and Traffic: Proceedings of the 4th Interdisciplinary Conference on Production Logistics and Traffic (ICPLT); Clausen, U., Langkau, S., Kreuz, F., Eds.; Springer: Cham, Switzerland, 2019; pp. 32–44. [Google Scholar]
- Watkins, C. Learning from Delayed Rewards. Ph.D. Thesis, Kings College, Cambridge, UK, 1989. [Google Scholar]
- Bellemare, M.G.; Naddaf, Y.; Veness, J.; Bowling, M. The Arcade Learning Environment: An Evaluation Platform for General Agents. J. Artif. Intell. Res. 2013, 47, 253–279. [Google Scholar] [CrossRef]
- ALE. The Arcade Learning Environment. 2020. Available online: https://github.com/mgbellemare/Arcade-Learning-Environment (accessed on 14 December 2020).
- TensorFlow. 2020. Available online: https://www.tensorflow.org/ (accessed on 14 December 2020).
- Rabe, M.; Dross, F.; Wuttke, A. Combining a Discrete-event Simulation Model of a Logistics Network with Deep Reinforcement Learning. In Proceedings of the 12th Metaheuristics International Conference (MIC), Barcelona, Spain, 4–7 July 2017; pp. 438–447. [Google Scholar]
- Rabe, M.; Ammouriova, M.; Schmitt, D.; Chicaiza-Vaca, J. An Approach for Reducing the Search Space for Simheuristics Applications in Logistics Network in Trading. In Simulation in Production and Logistics; Putz, M., Schlegel, A., Eds.; Verlag Wissenschaftliche Skripten: Auerbach, Germany, 2019; pp. 335–344. [Google Scholar]
- Rabe, M.; Dross, F.; Vennemann, A. A Procedure Model for the Credible Measurability of Data Warehouse Metrics on Discrete-event Simulation Models of Logistics Systems. In Simulation in Production and Logistics 2015; Rabe, M., Clausen, U., Eds.; Fraunhofer Verlag: Stuttgart, Germany, 2015; pp. 168–176. [Google Scholar]
- Silberholz, J.; Golden, B.; Gupta, S.; Wang, X. Computational Comparison of Metaheuristics. In Handbook of Metaheuristics; Gendreau, M., Potvin, J.Y., Eds.; International Series in Operation Research and Management Science; Springer International Publishing: Cham, Switzerland, 2019; pp. 581–604. [Google Scholar]
- Karimi, M.B.; Isazadeh, A.; Rahmani, A.M. QoS-aware Service Composition in Cloud Computing Using Data Mining Techniques and Genetic Algorithm. J. Supercomput. 2017, 73, 1387–1415. [Google Scholar] [CrossRef]
- Ku, D.; Arthanari, T.S. On the Abstraction Method for the Container Relocation Problem. Comput. Oper. Res. 2016, 68, 110–122. [Google Scholar] [CrossRef]
- Cai, K.Q.; Zhang, J.; Xiao, M.M.; Tang, K.; Du, W.B. Simultaneous Optimization of Airspace Congestion and Flight Delay in Air Traffic Network Flow Management. IEEE Trans. Intell. Transp. Syst. 2017, 18, 3072–3082. [Google Scholar] [CrossRef]
- Blenk, A.; Kalmbach, P.; Kellerer, W.; Schmid, S. O’zapft is: Tap Your Network Algorithm’s Big Data. In Proceedings of the Workshop on Big Data Analytics and Machine Learning for Data Communication Networks (Big-DAM’17); Association for Computing Machinery: New York, NY, USA, 2017; pp. 19–24. [Google Scholar] [CrossRef]
- Umetani, S. Exploiting Variable Associations to Configure Efficient Local Search Algorithms in Large-scale Binary Integer Programs. Eur. J. Oper. Res. 2017, 263, 72–81. [Google Scholar] [CrossRef]
- Amaran, S.; Sahinidis, N.V.; Sharda, B.; Bury, S.J. Simulation Optimization: A Review of Algorithms and Applications. Ann. Oper. Res. 2016, 240, 351–380. [Google Scholar] [CrossRef] [Green Version]
- Sheskin, D. Handbook of Parametric and Nonparametric Statistical Procedures, 5th ed.; CRC Press: Boca Raton, FL, USA, 2011. [Google Scholar]
Figure 1.
The architecture of the developed Logistics Assistance System (LAS) [68].
Figure 1.
The architecture of the developed Logistics Assistance System (LAS) [68].
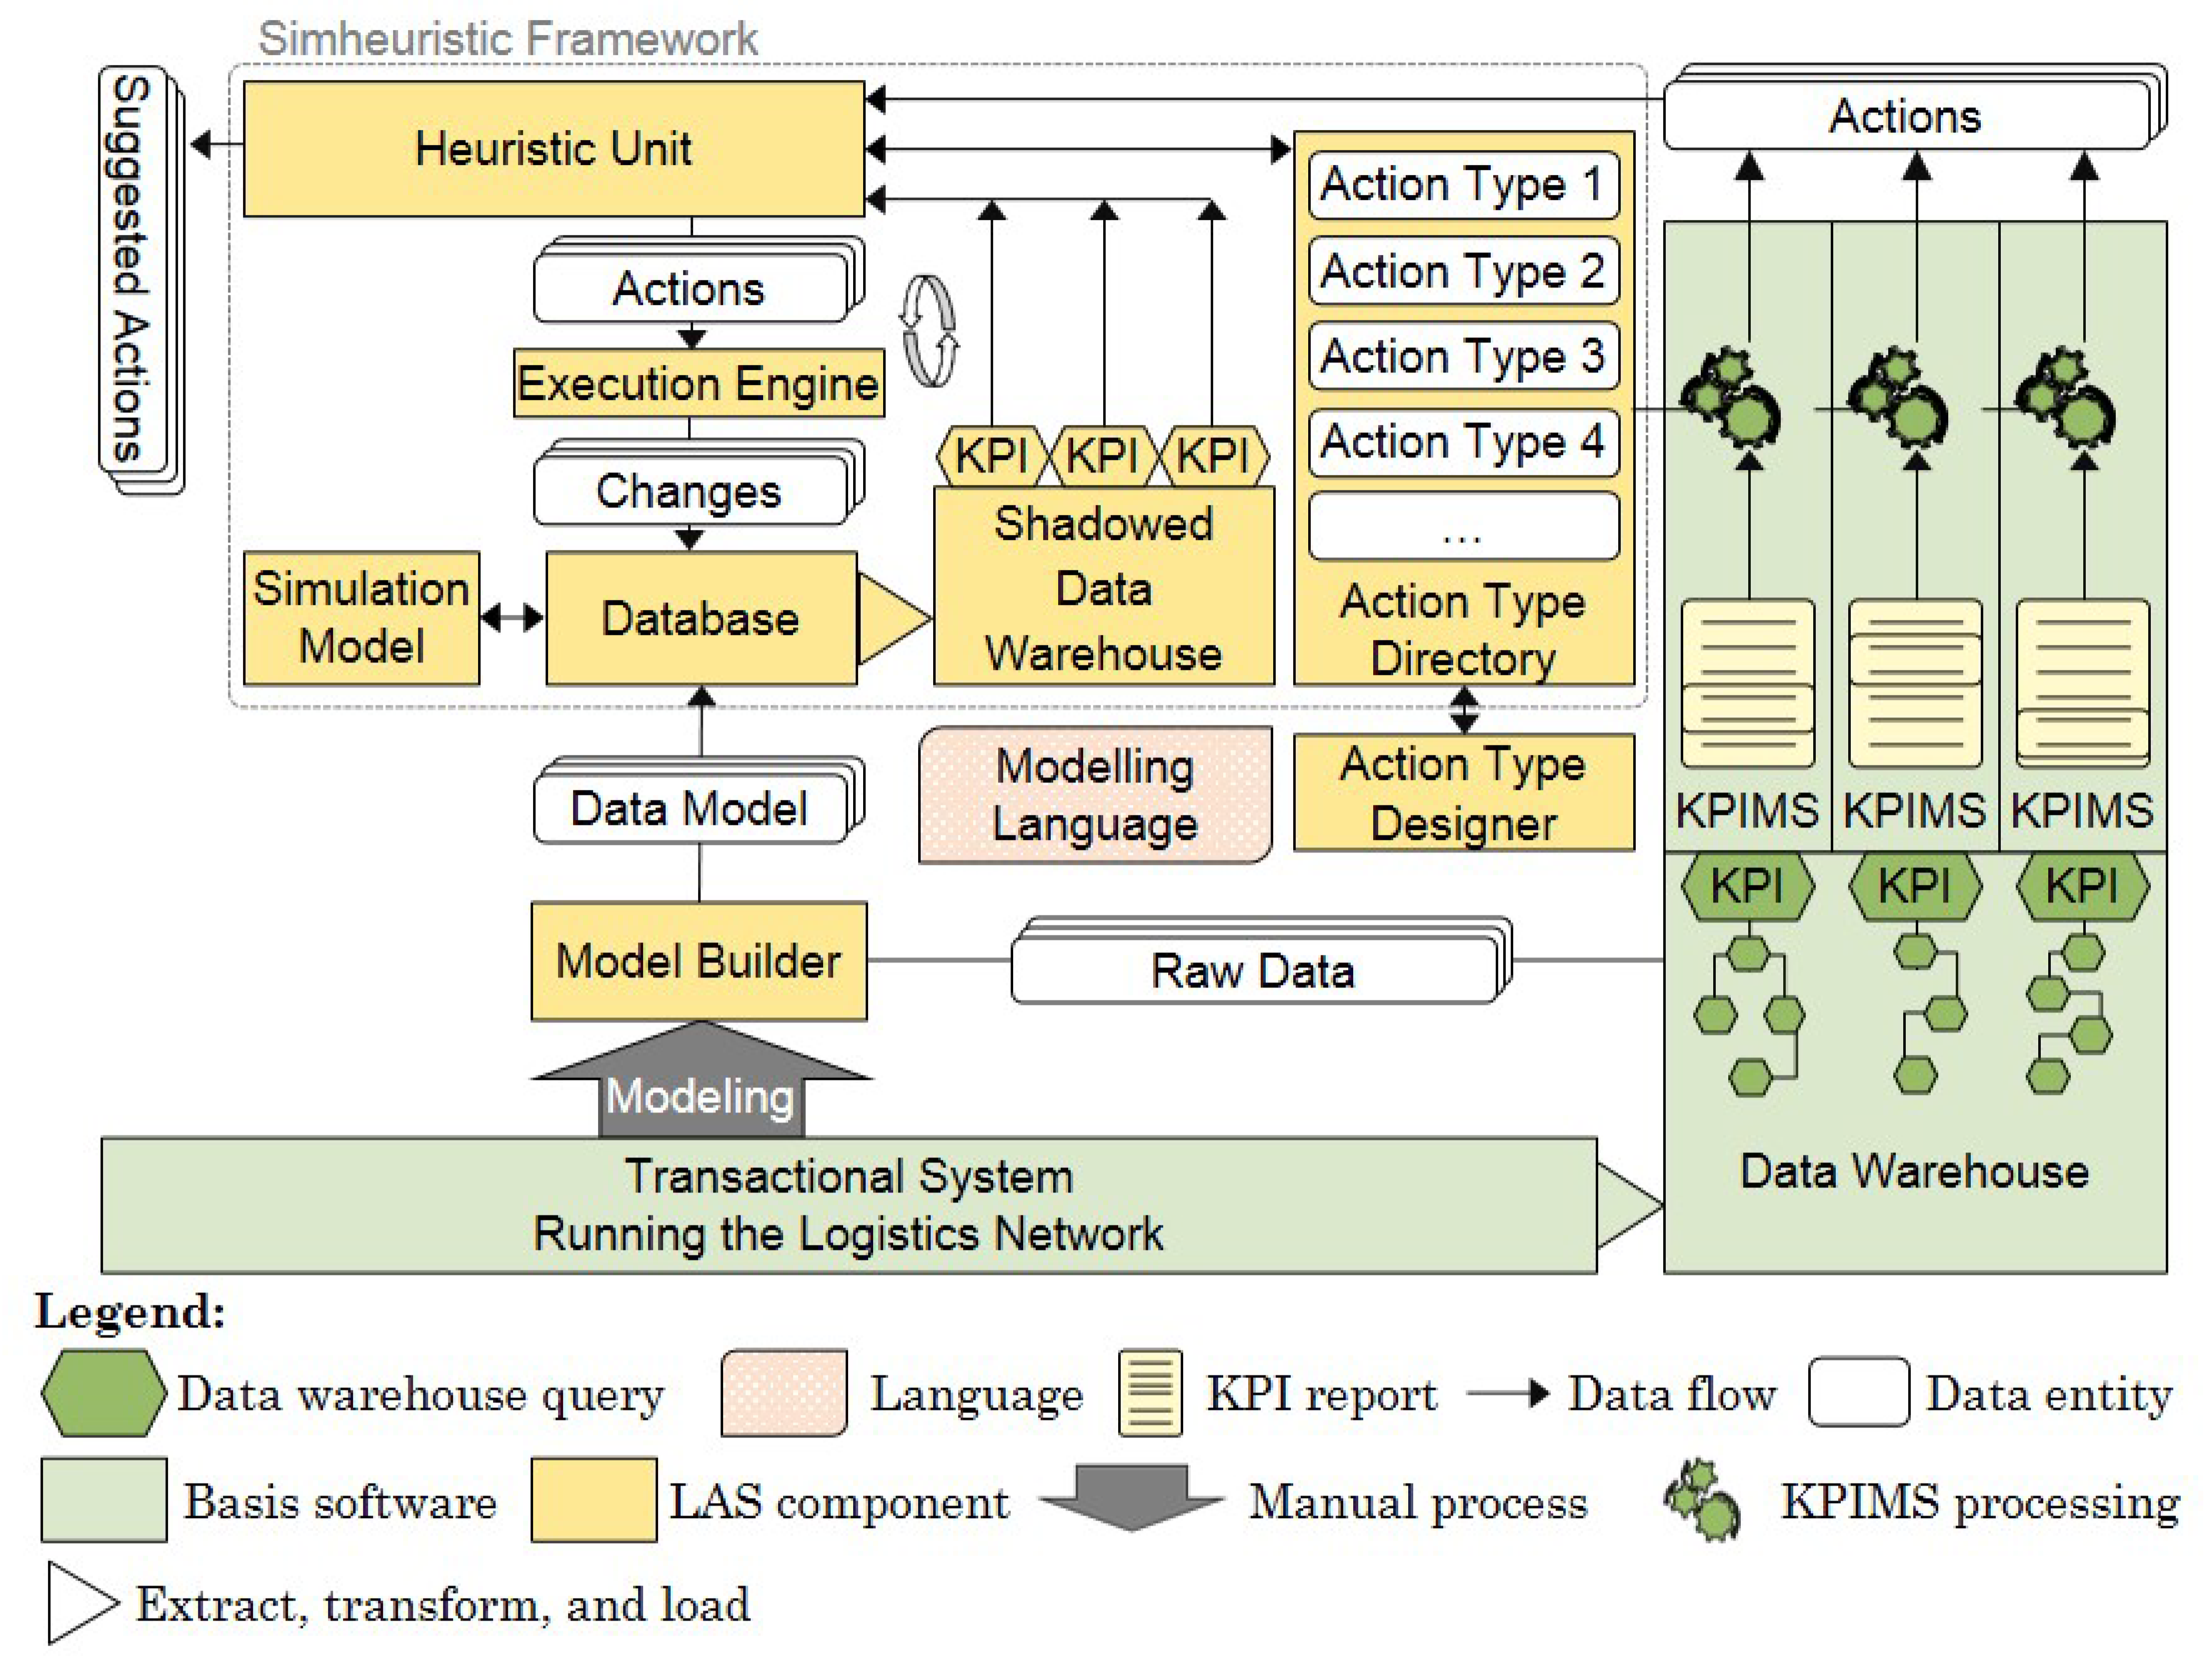
Figure 2.
Applying an action directly to the simulation’s database.

Figure 3.
Applying an action to the enterprise-specific data model and mapping the resulting changes to the simulation data model.
Figure 3.
Applying an action to the enterprise-specific data model and mapping the resulting changes to the simulation data model.

Figure 4.
Graphical state representation (small image) and details of two exemplary image segments (large images) [80].
Figure 4.
Graphical state representation (small image) and details of two exemplary image segments (large images) [80].
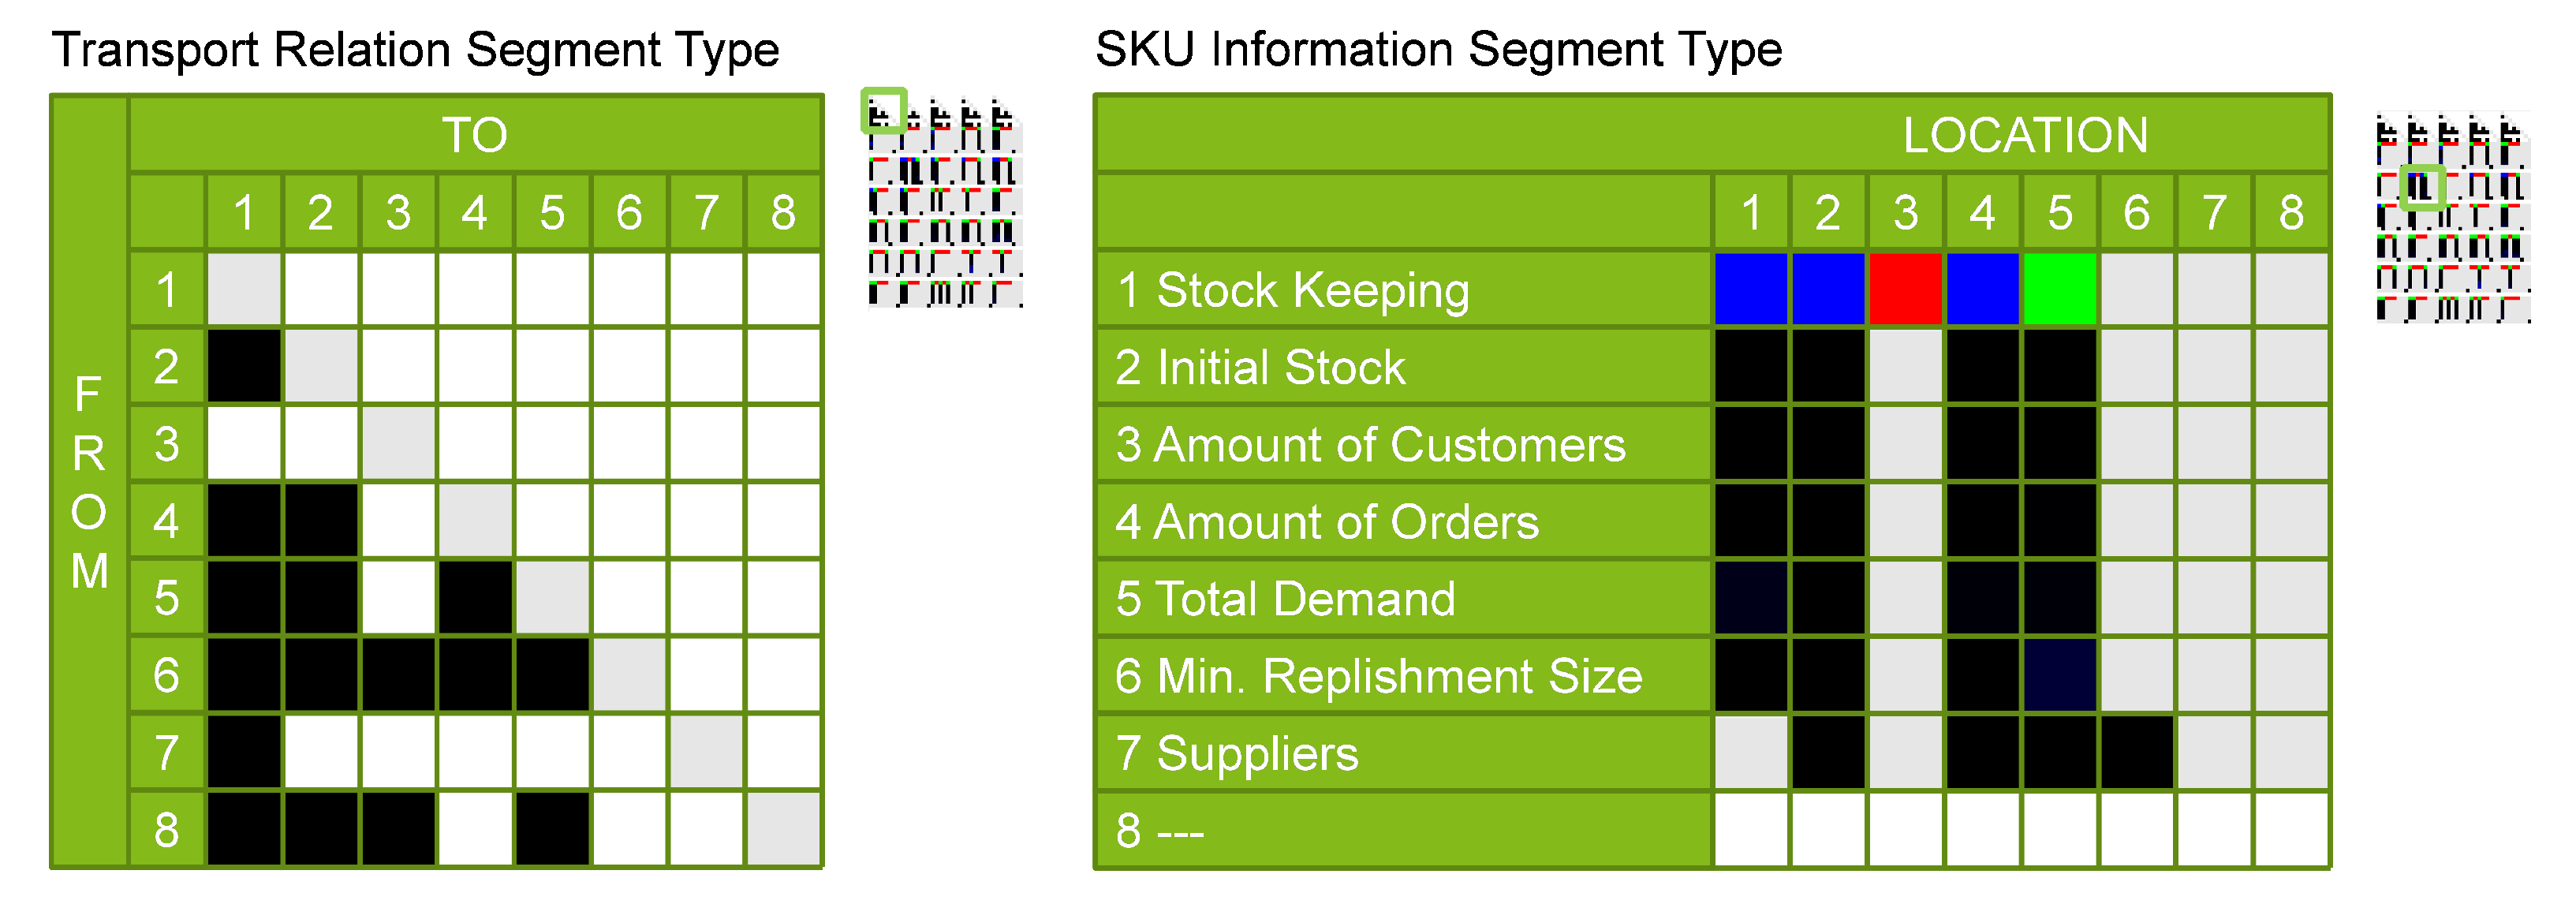
Figure 5.
Probability distribution of actions’ types of changes along the length of an action plan.

Figure 6.
Impact of actions on the service level.
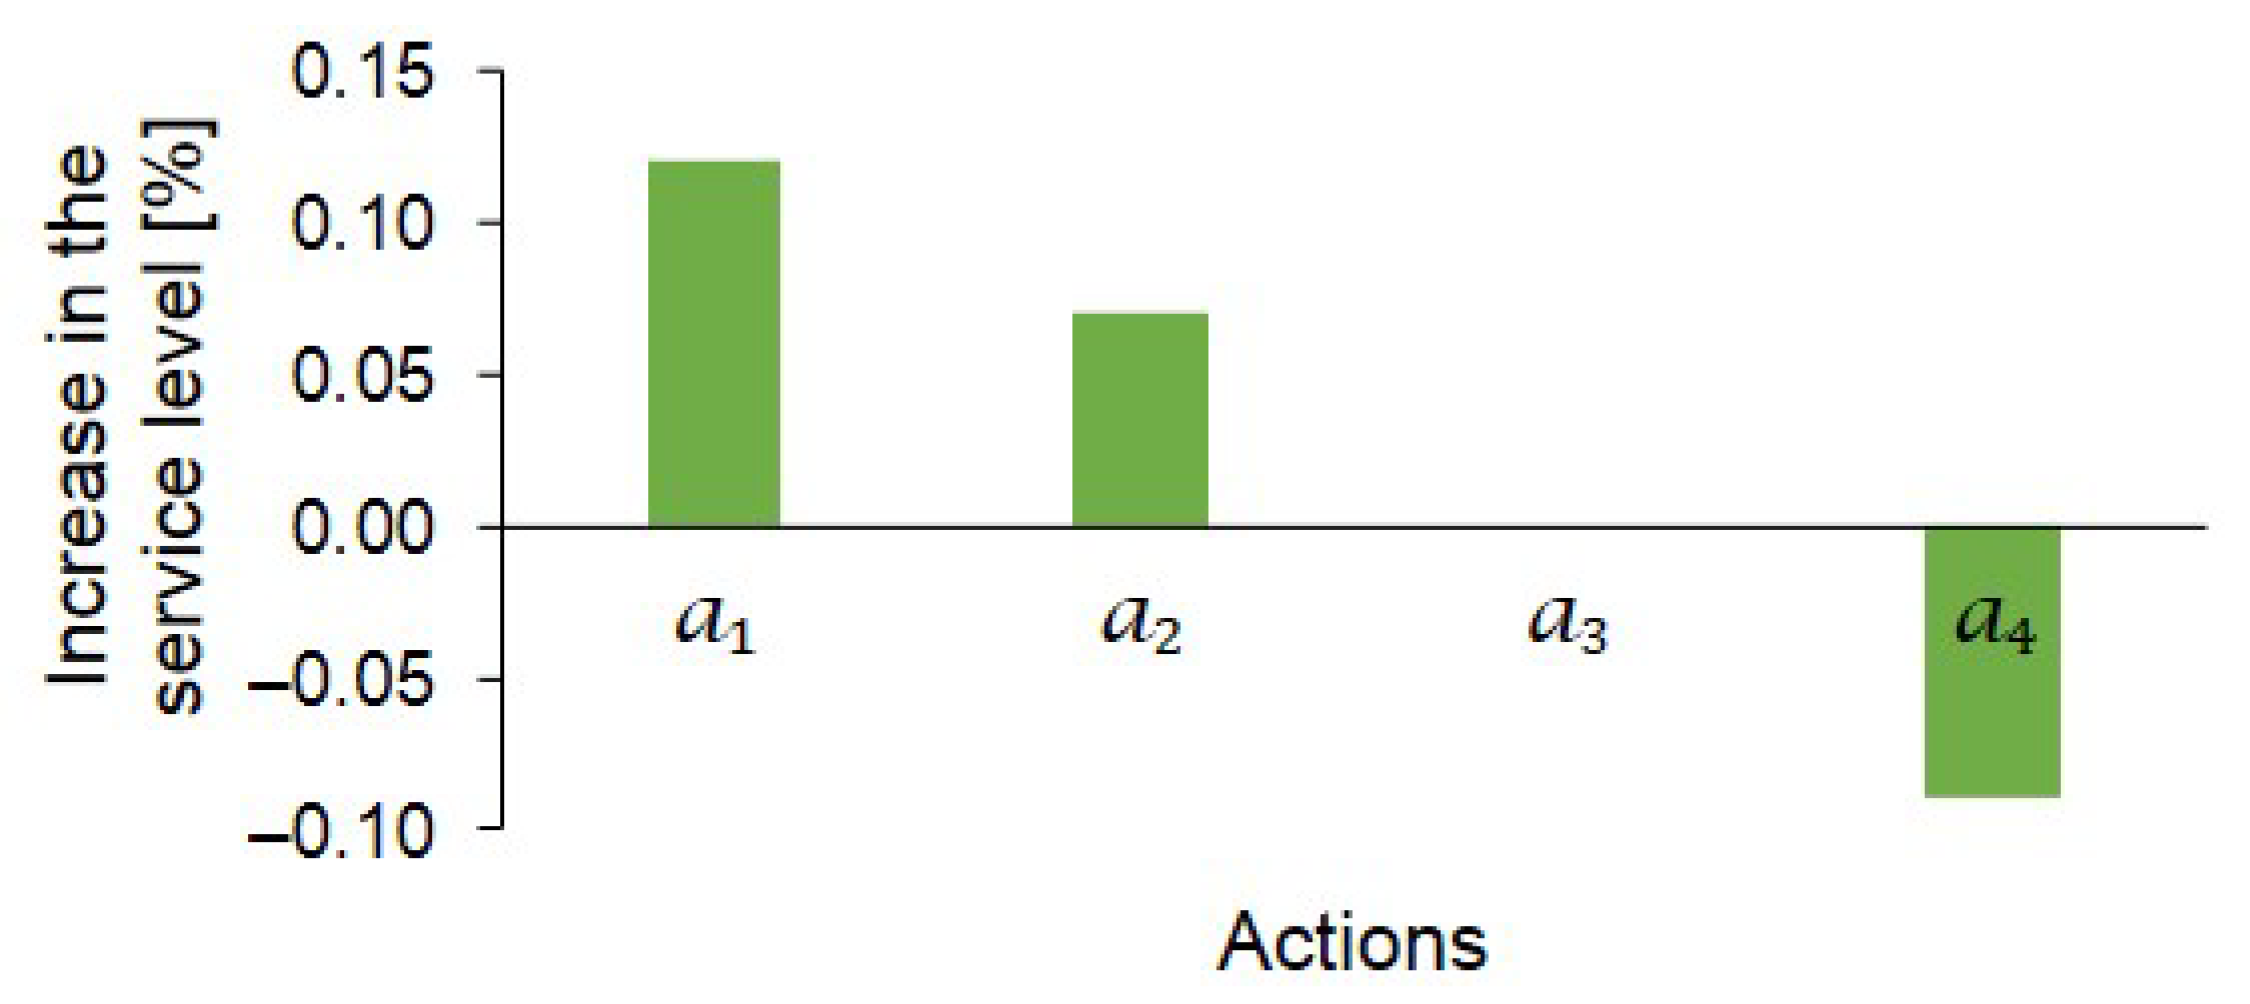
Figure 7.
Impact of sequence of actions on the service level.

Figure 8.
Equivalent action plans: (a) action plans with interchangeable actions and (b) action plans with redundant actions.
Figure 8.
Equivalent action plans: (a) action plans with interchangeable actions and (b) action plans with redundant actions.
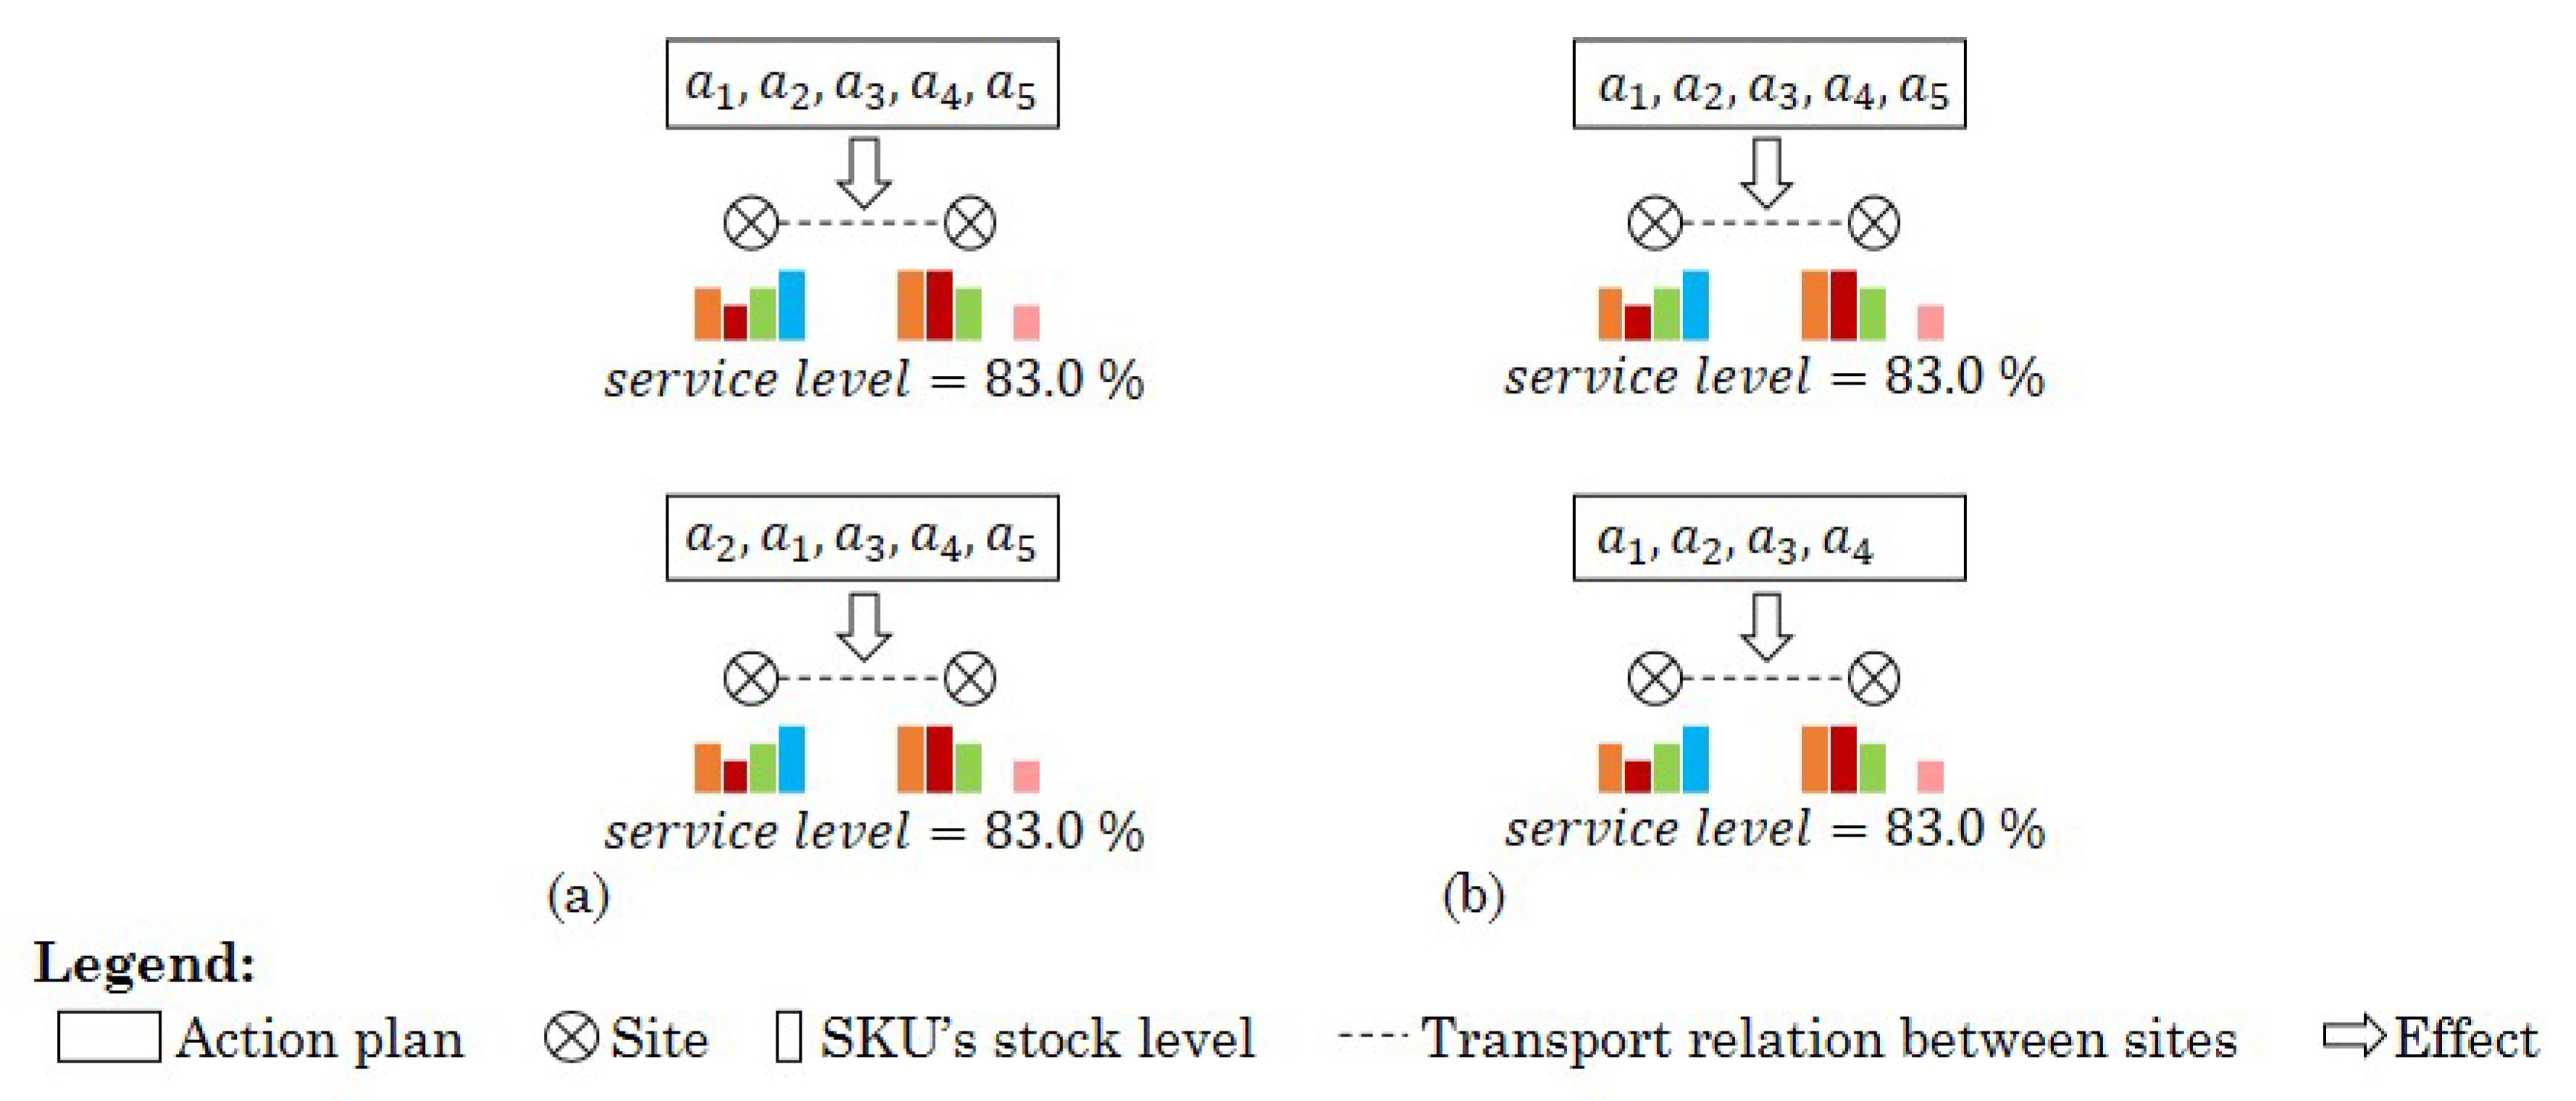
Figure 9.
The time distribution in (a) a reference EA experiment and (b) an EA experiment utilising the equivalent action plans approach.
Figure 9.
The time distribution in (a) a reference EA experiment and (b) an EA experiment utilising the equivalent action plans approach.


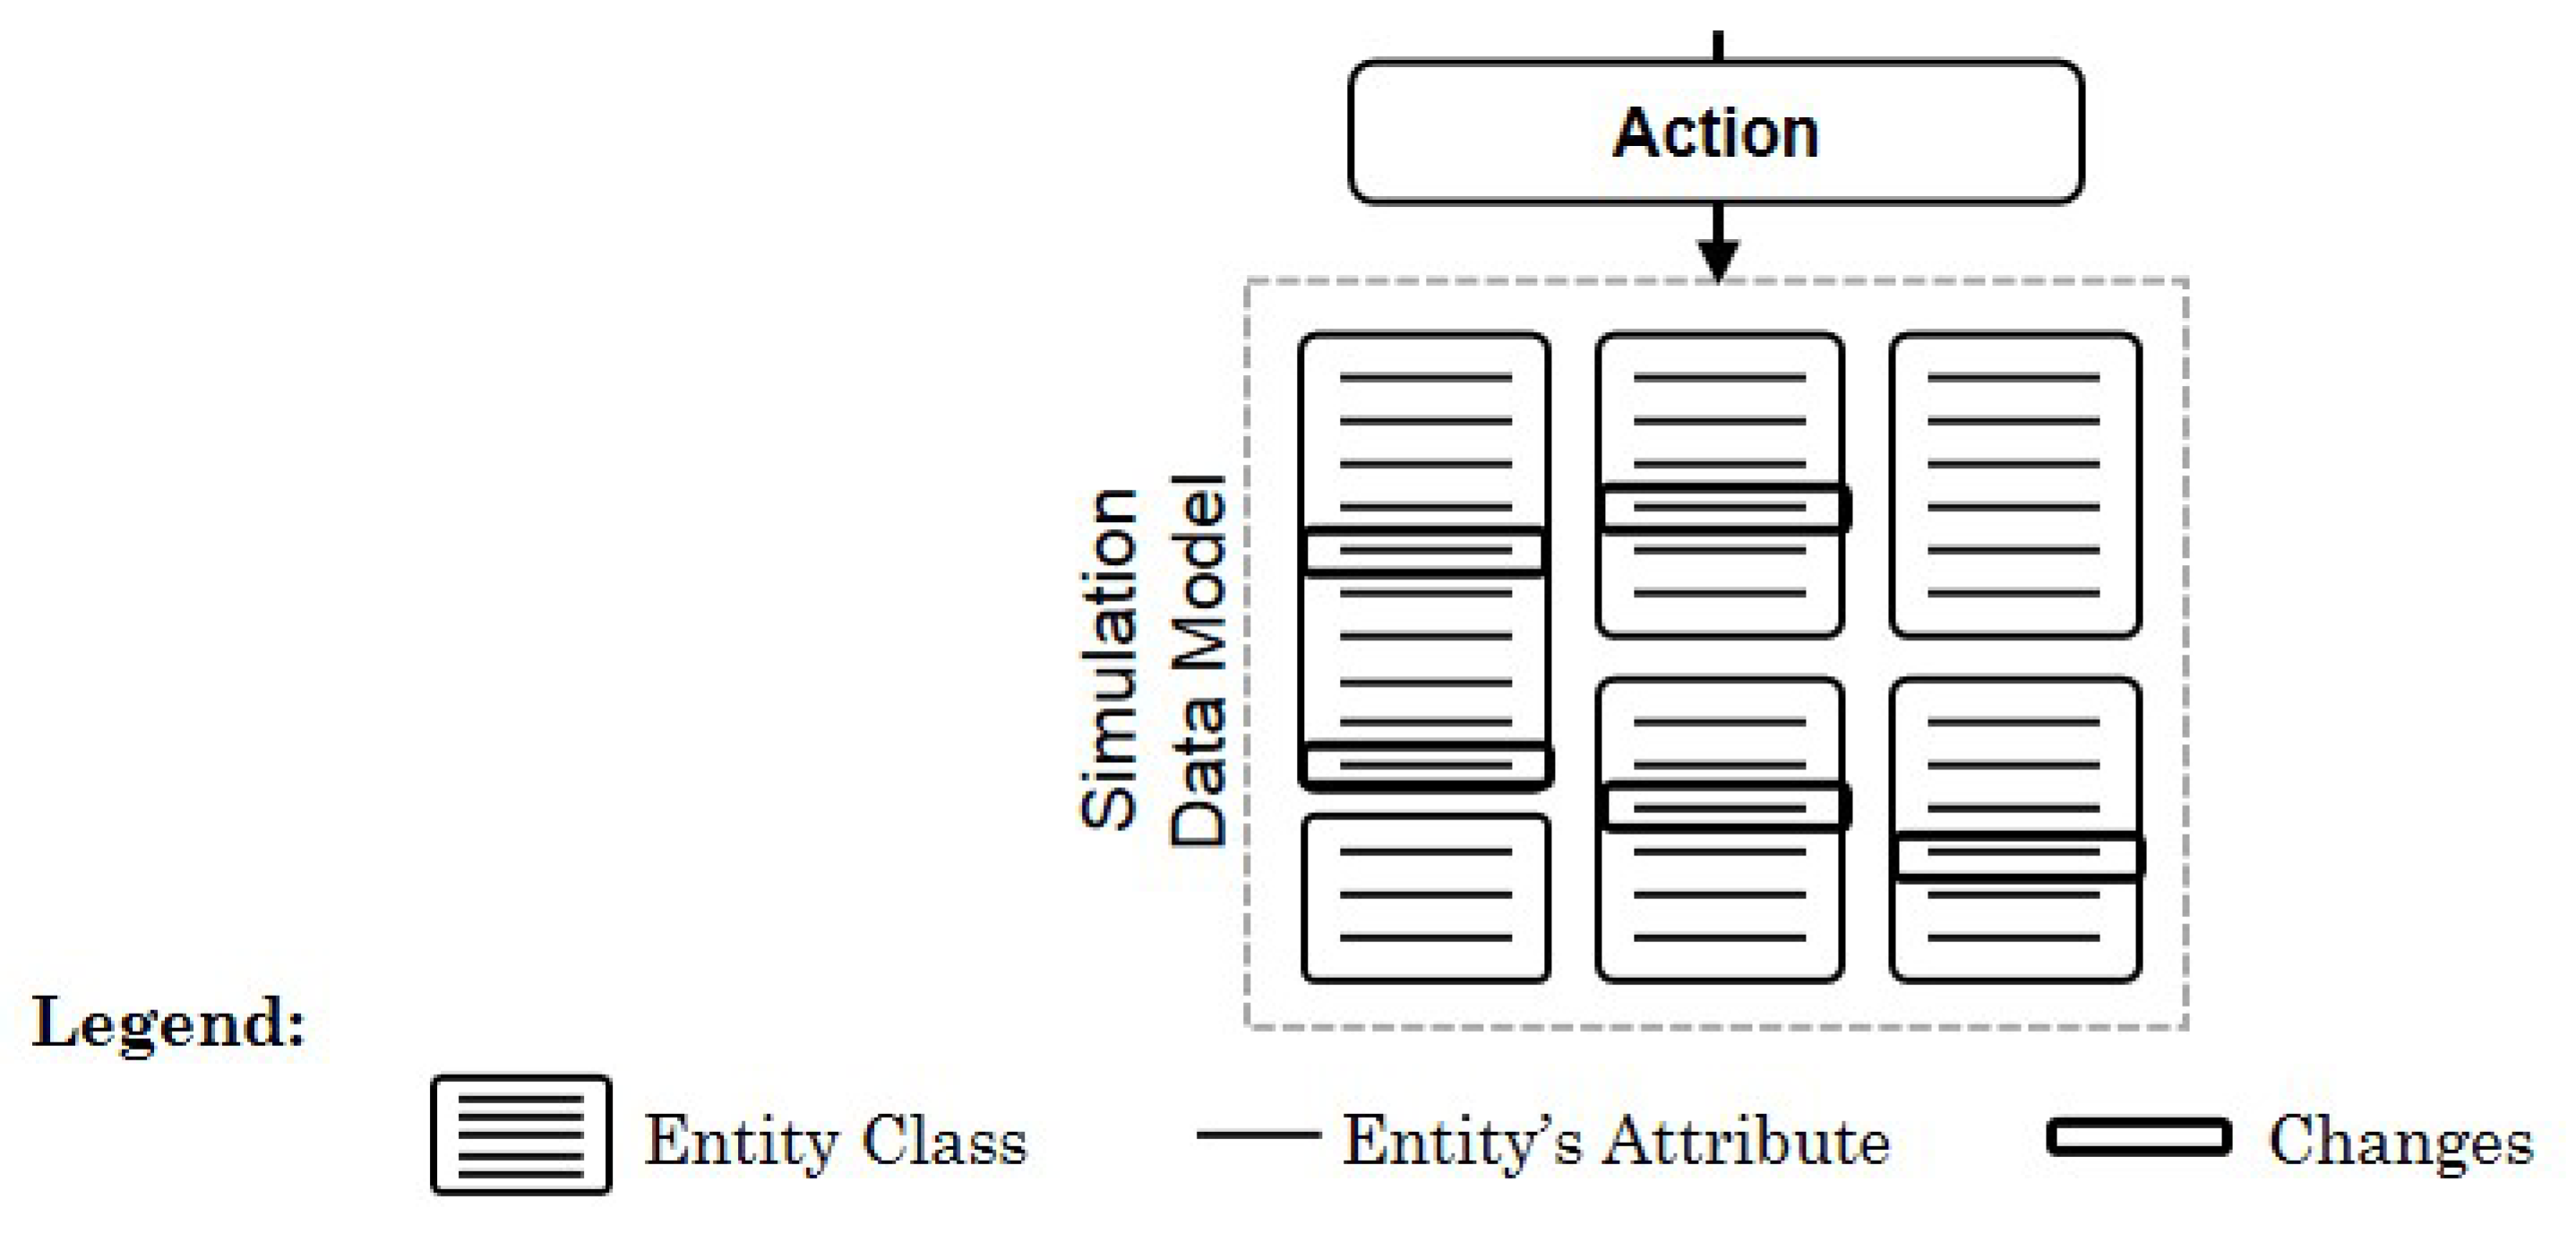
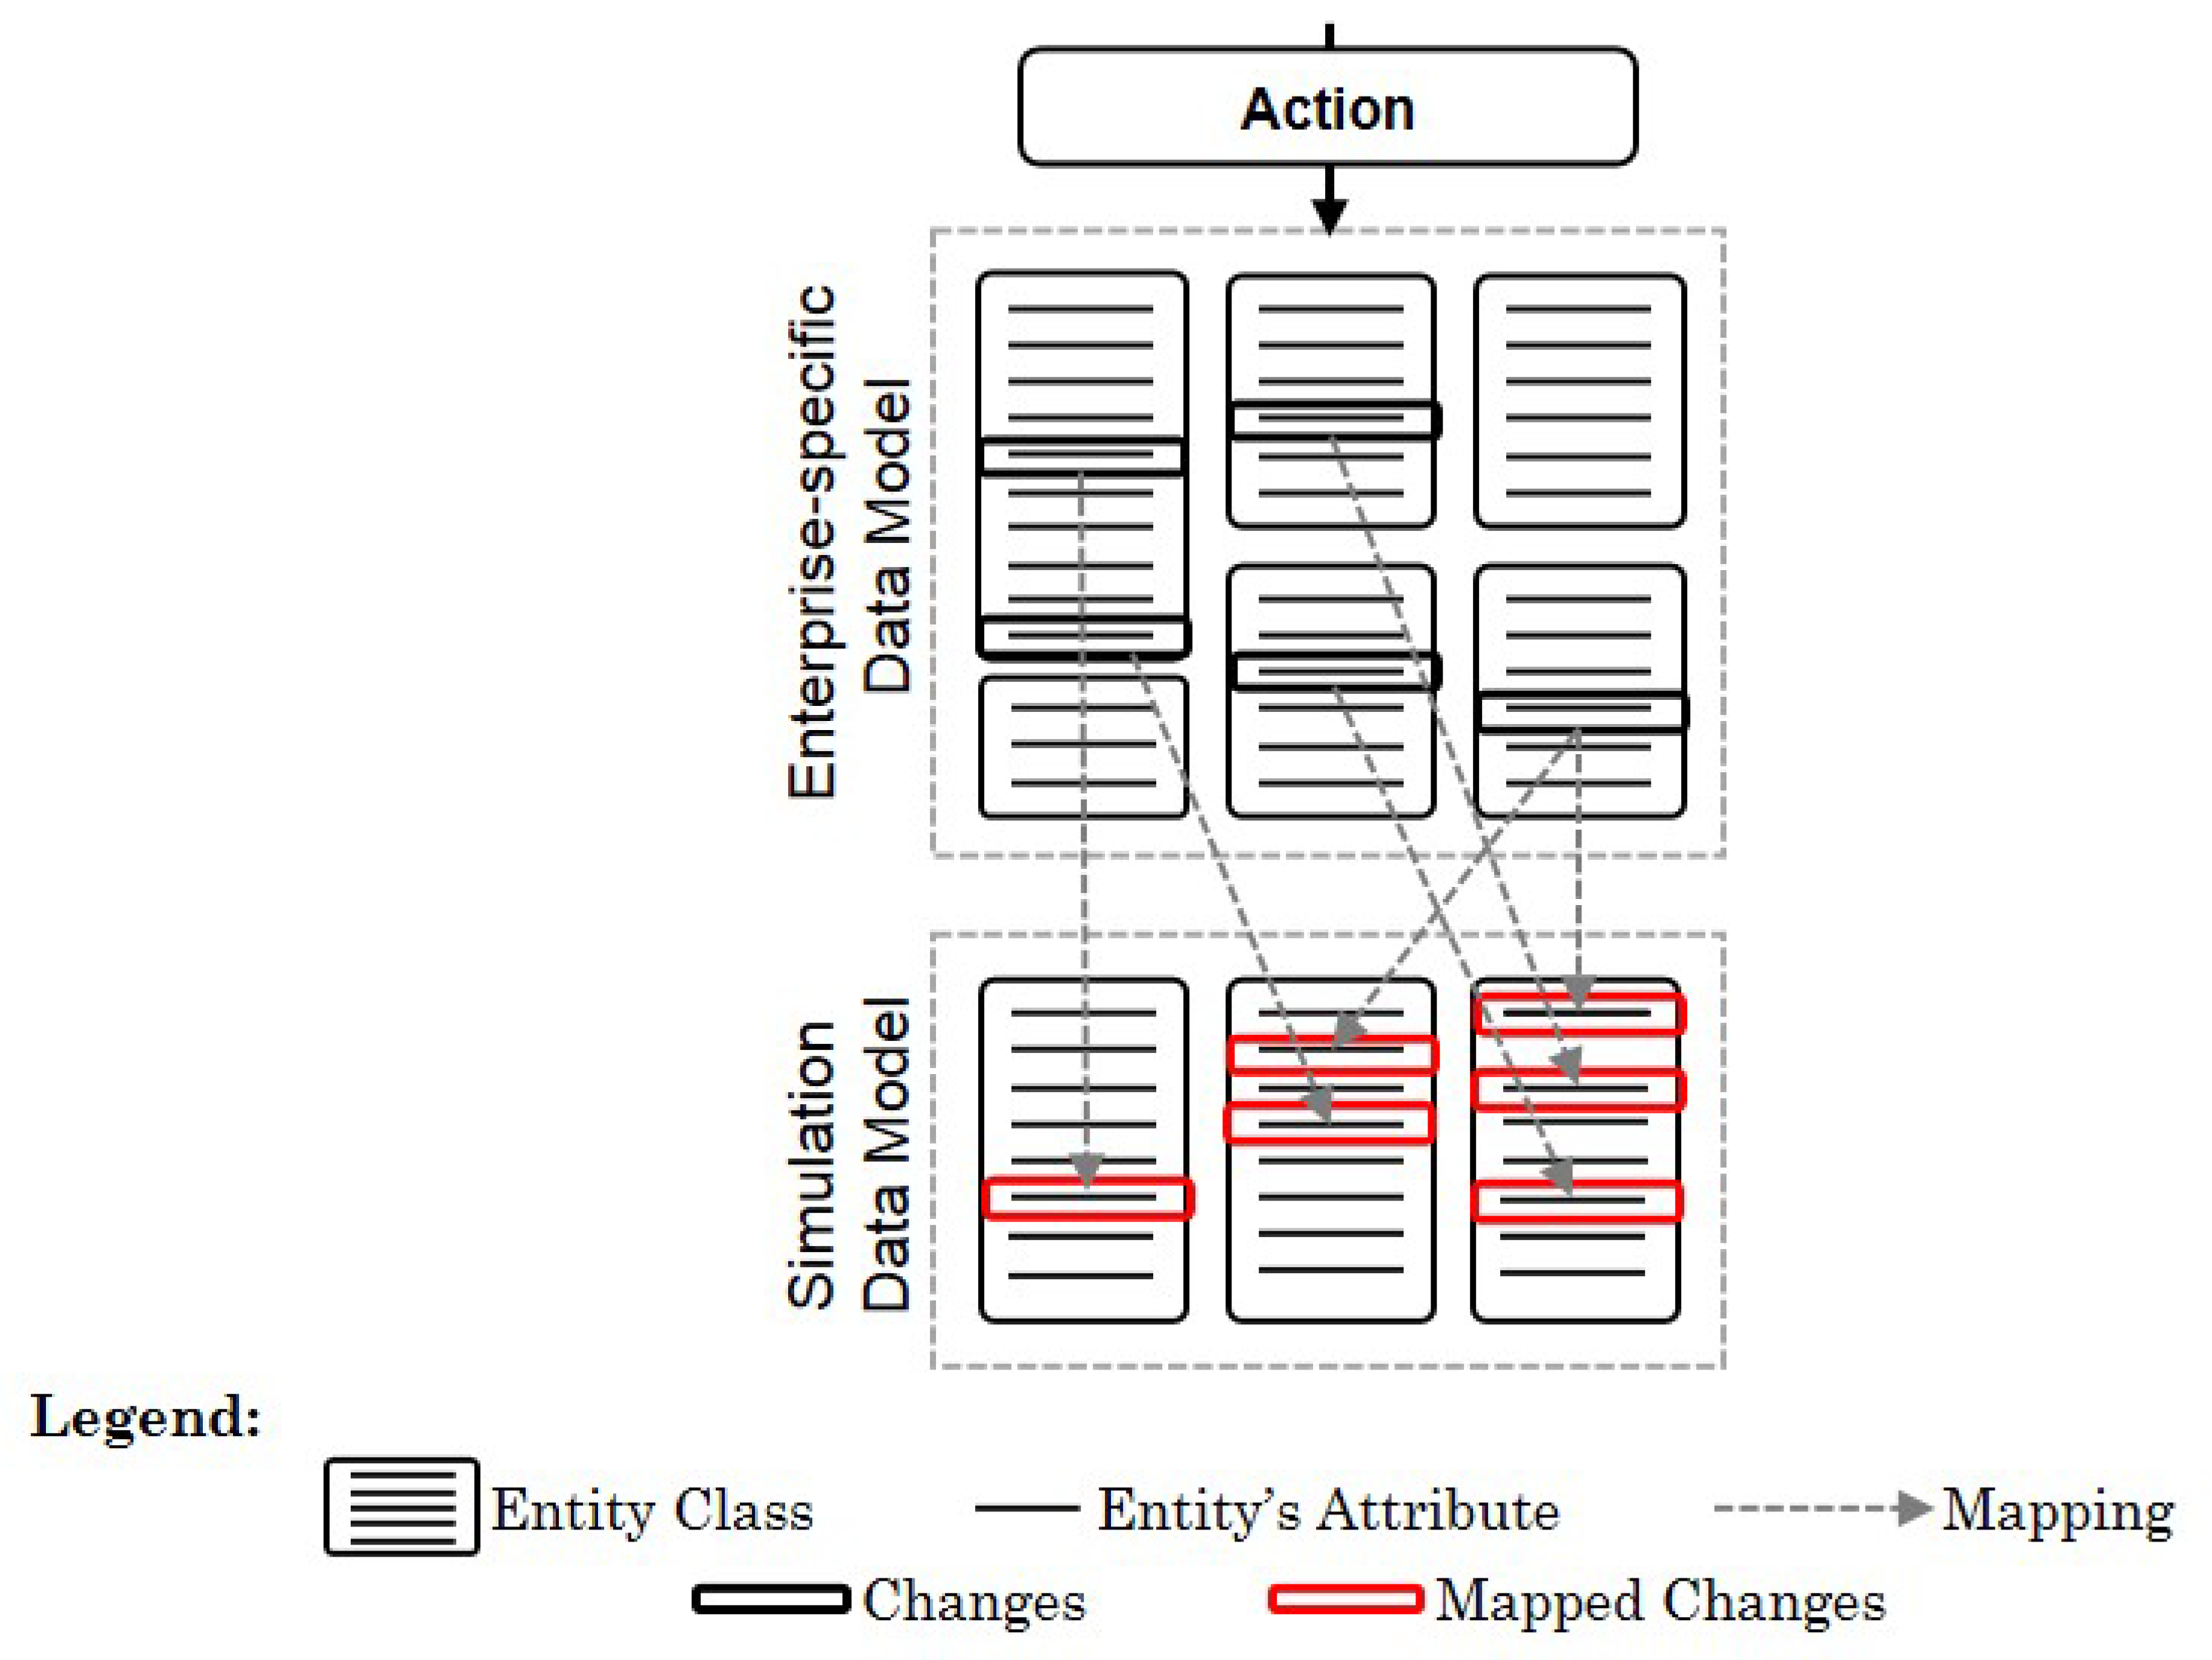
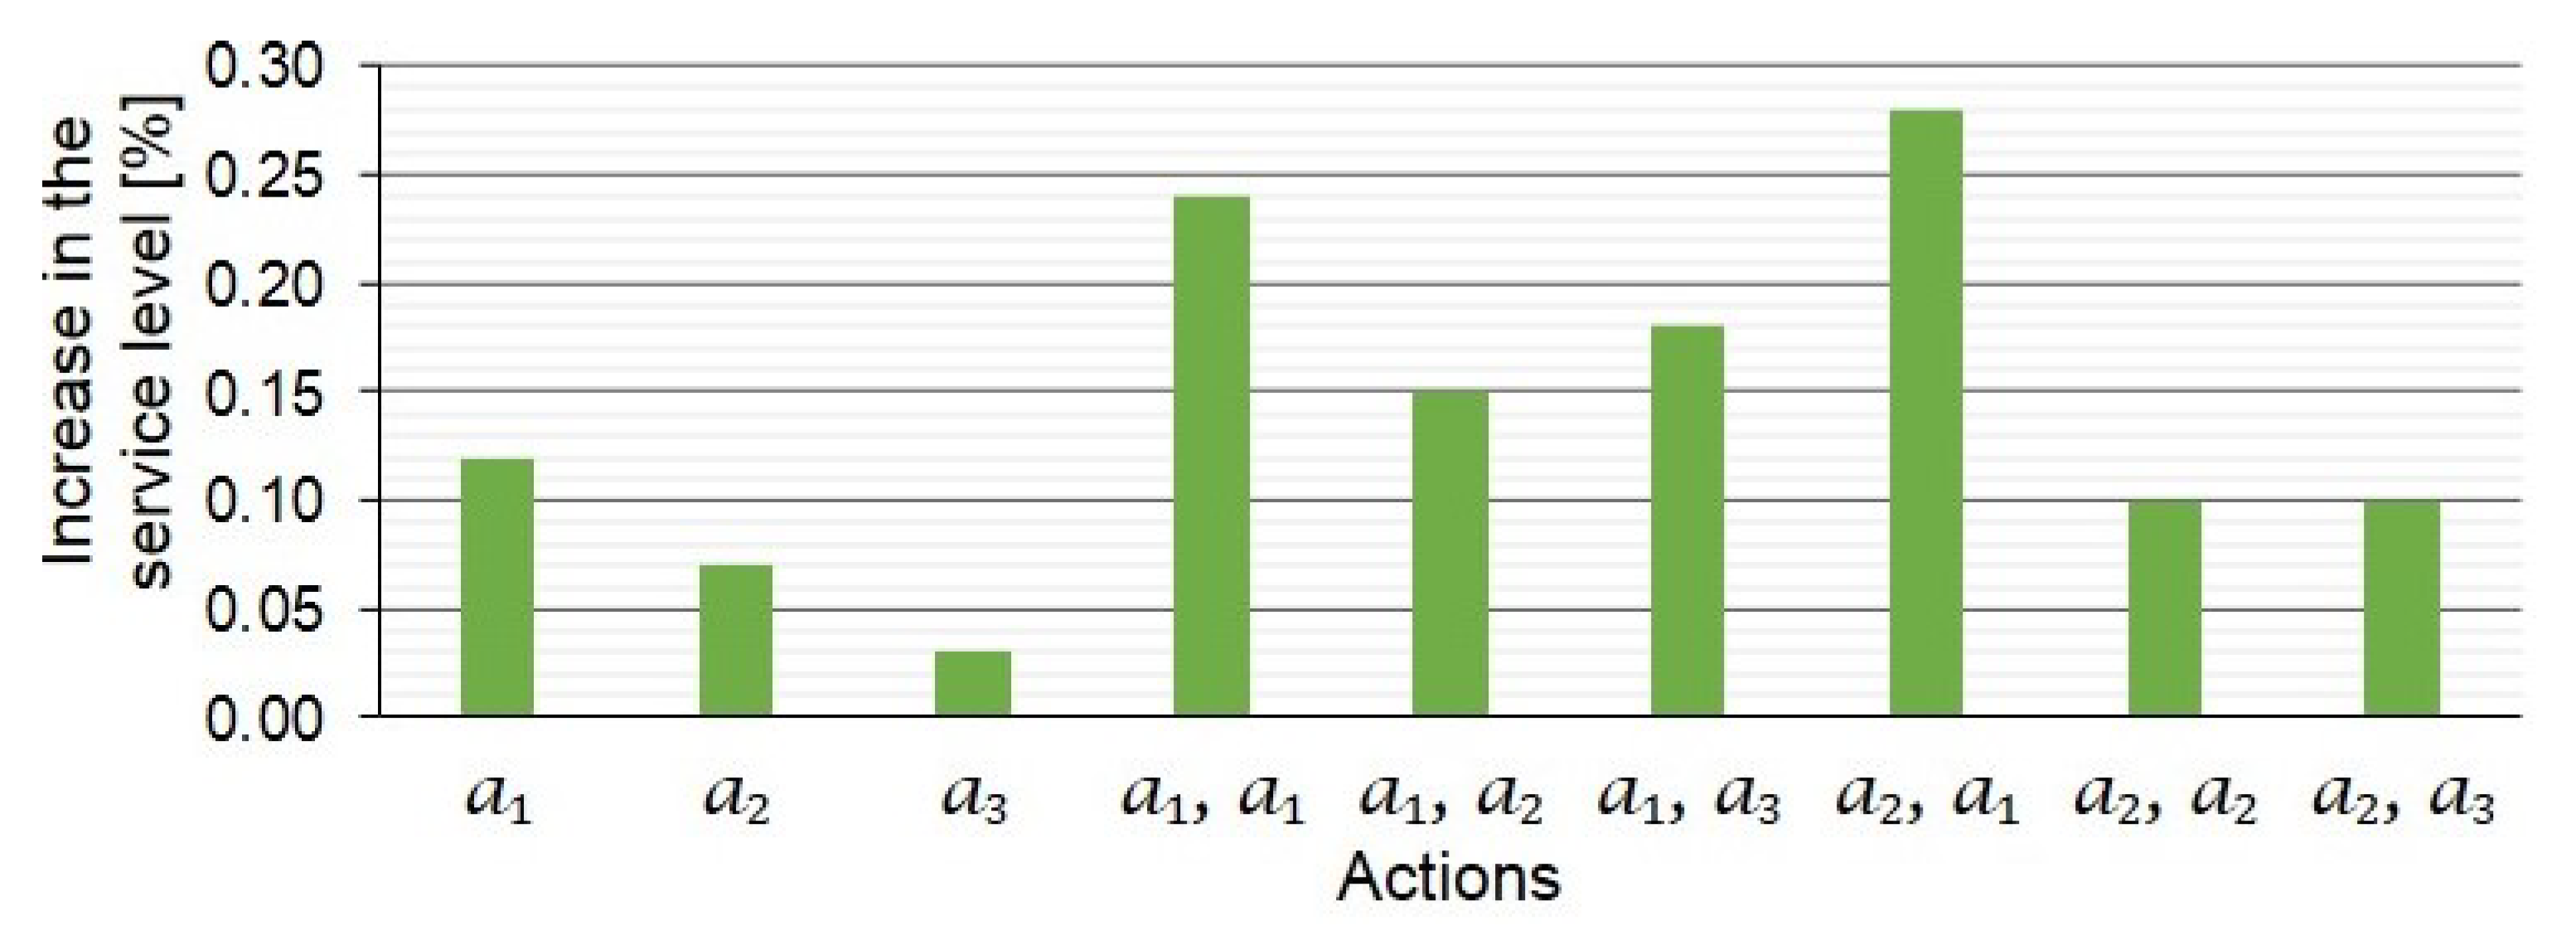
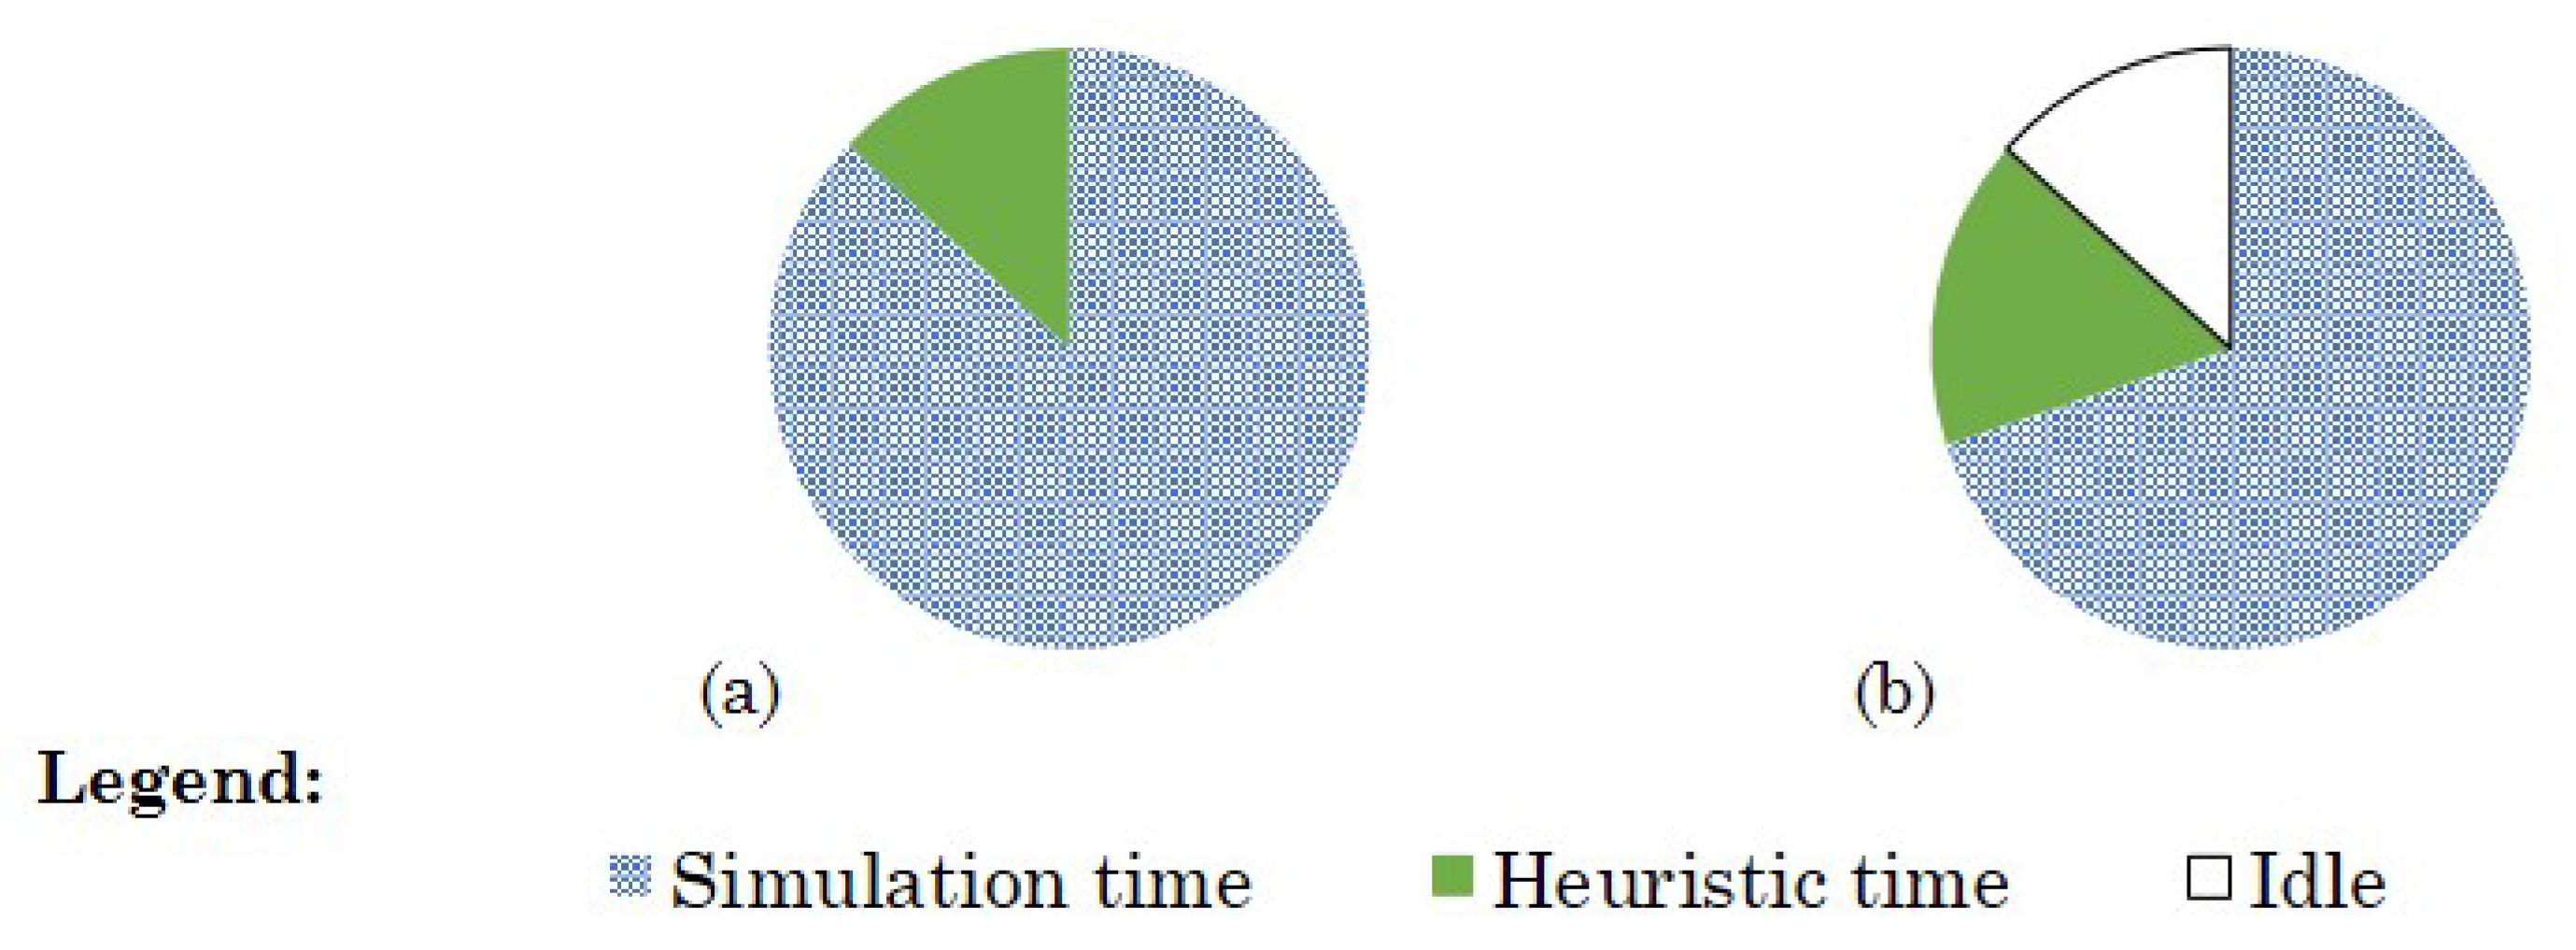
Table 1.
The semantic model for action types in wholesale logistics networks, based on Reference [72].
Table 1.
The semantic model for action types in wholesale logistics networks, based on Reference [72].
| Attribute | Description | Category |
|---|---|---|
| Actions | List with all derived actions, depending on the logistics network’s state. | Functional |
| Correlation | Domain-specific information that specifies possible correlations and their correlation factors with other action types. | Domain-specific |
| Description | Free description of the action type. | Informative |
| Frequency | Domain-specific information that specifies the frequency of the implementation of derived actions. | Domain-specific |
| Id | Id of the action type. | Informative |
| Impact | Domain-specific information that specifies the impact of derived actions to the underlying logistics network’s performance. | Domain-specific |
| Input | List of input parameters. | Functional |
| Modelers | List with ids of the involved modelers. | Informative |
| Name | Name of the action type. | Informative |
| Owner | Owner of the action type. | Informative |
| Parametrical | Domain-specific information that specifies, for an action type, whether the corresponding changes are parametrical. | Domain-specific |
| Statements | List of statements, representing changes to the underlying logistics network. | Functional |
| Structural | Domain-specific information that specifies whether the corresponding changes of the action type are structural. | Domain-specific |
| Time till effect | Required time for a corresponding action to take effect. | Meta |
| Total costs | The costs associated with the implementation of derived actions. | Meta |
Table 2.
Correlation matrix example.
| ∼ | − | + | ∼ | − | − | ||
| + | − | ∼ | − | ∼ | ∼ | ||
Table 3.
Comparison between random selection of actions and biased selection in an evolutionary algorithm (EA) experiment using the gap analysis (CR = crossover form, MU = mutation form).
Table 3.
Comparison between random selection of actions and biased selection in an evolutionary algorithm (EA) experiment using the gap analysis (CR = crossover form, MU = mutation form).
| Random Selection | Biased Selection | Gap (Biased − Random) | ||||||||
|---|---|---|---|---|---|---|---|---|---|---|
| CR | MU | c (€) | (%) | c (€) | (%) | c (€) | (%) | |||
| 1-point | 1-action | 90,420 | 84.58 | 76 | 90,309 | 84.74 | 31 | −111 | 0.2 | −45 |
| 1-point | multi | 91,414 | 84.65 | 41 | 90,045 | 84.79 | 41 | −1369 | 0.1 | 0 |
| 2-point | 1-action | 90,630 | 84.72 | 73 | 90,806 | 84.81 | 34 | 176 | 0.1 | −39 |
| 2-point | multi | 90,673 | 84.69 | 65 | 91,340 | 84.83 | 43 | 667 | 0.1 | −22 |
| uniform | 1-action | 90,086 | 84.75 | 89 | 88,039 | 85.11 | 37 | −2047 | 0.4 | −52 |
| uniform | multi | 91,699 | 84.72 | 63 | 92,292 | 85.03 | 32 | 593 | 0.3 | −31 |
Publisher’s Note: MDPI stays neutral with regard to jurisdictional claims in published maps and institutional affiliations. |
© 2021 by the authors. Licensee MDPI, Basel, Switzerland. This article is an open access article distributed under the terms and conditions of the Creative Commons Attribution (CC BY) license (http://creativecommons.org/licenses/by/4.0/).
Share and Cite
MDPI and ACS Style
Rabe, M.; Ammouriova, M.; Schmitt, D.; Dross, F. Simheuristics Approaches for Efficient Decision-Making Support in Materials Trading Networks. Algorithms 2021, 14, 23. https://0-doi-org.brum.beds.ac.uk/10.3390/a14010023
AMA Style
Rabe M, Ammouriova M, Schmitt D, Dross F. Simheuristics Approaches for Efficient Decision-Making Support in Materials Trading Networks. Algorithms. 2021; 14(1):23. https://0-doi-org.brum.beds.ac.uk/10.3390/a14010023
Chicago/Turabian StyleRabe, Markus, Majsa Ammouriova, Dominik Schmitt, and Felix Dross. 2021. "Simheuristics Approaches for Efficient Decision-Making Support in Materials Trading Networks" Algorithms 14, no. 1: 23. https://0-doi-org.brum.beds.ac.uk/10.3390/a14010023
Note that from the first issue of 2016, this journal uses article numbers instead of page numbers. See further details here.