
The Use of Temporal Check-All-That-Apply and Category Scaling by Experienced Panellists to Evaluate Sweet and Dry Ciders


Abstract
:
1. Introduction
2. Materials and Methods
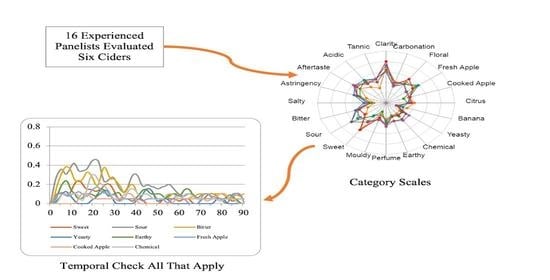
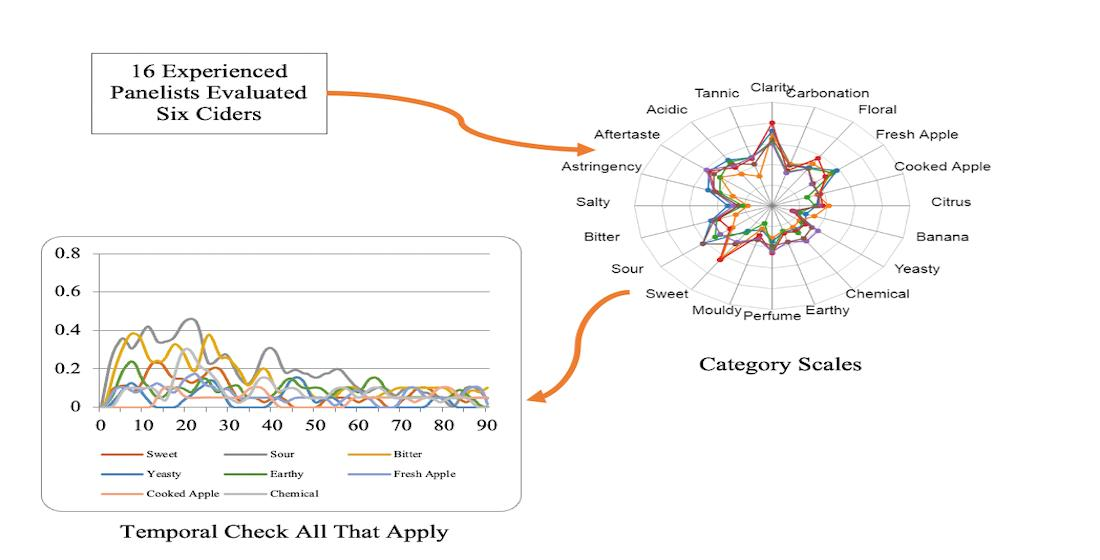
2.1. Experienced Panellists
2.2. Testing Environment
2.3. Samples and Sample Presentation
2.4. Procedure
2.5. Statistical Analysis
3. Results and Discussion
4. Conclusions
Supplementary Materials
Author Contributions
Funding
Institutional Review Board Statement
Informed Consent Statement
Data Availability Statement
Acknowledgments
Conflicts of Interest
References
- Qin, Z.; Petersen, M.A.; Bredie, W.L.P. Flavor Profiling of Apple Ciders from the UK and Scandinavian Region. Food Res. Int. 2018, 105, 713–723. [Google Scholar] [CrossRef] [PubMed]
- Way, M.L.; Jones, J.E.; Nichols, D.S.; Dambergs, R.G.; Swarts, N.D. A Comparison of Laboratory Analysis Methods for Total Phenolic Content of Cider. Beverages 2020, 6, 55. [Google Scholar] [CrossRef]
- Tozer, P.R.; Galinato, S.P.; Ross, C.F.; Miles, C.A.; McCluskey, J.J. Sensory Analysis and Willingness to Pay for Craft Cider*. J. Wine Econ. 2015, 10, 314–328. [Google Scholar] [CrossRef]
- Dos Santos, C.M.E.; Alberti, A.; Pietrowski, G.D.A.M.; Zielinski, A.A.F.; Wosiacki, G.; Nogueira, A.; Jorge, R.M.M. Supplementation of Amino Acids in Apple Must for the Standardization of Volatile Compounds in Ciders. J. Inst. Brew. 2016, 122, 334–341. [Google Scholar] [CrossRef] [Green Version]
- Thompson-Witrick, K.A.; Goodrich, K.M.; Neilson, A.P.; Hurley, E.K.; Peck, G.M.; Stewart, A.C. Characterization of the Polyphenol Composition of 20 Cultivars of Cider, Processing, and Dessert Apples (Malus × Domestica Borkh.) Grown in Virginia. J. Agric. Food Chem. 2014, 62, 10181–10191. [Google Scholar] [CrossRef] [PubMed]
- Sanoner, P.; Guyot, S.; Marnet, N.; Molle, D.; Drilleau, J.F. Polyphenol Profiles of French Cider Apple Varieties (Malus Domestica Sp.). J. Agric. Food Chem. 1999, 47, 4847–4853. [Google Scholar] [CrossRef]
- Girschik, L.; Jones, J.E.; Kerslake, F.L.; Robertson, M.; Dambergs, R.G.; Swarts, N.D. Apple Variety and Maturity Profiling of Base Ciders Using UV Spectroscopy. Food Chem. 2017, 228, 323–329. [Google Scholar] [CrossRef] [PubMed]
- Torija, M.J.; Rozès, N.; Poblet, M.; Guillamón, J.M.; Mas, A. Effects of Fermentation Temperature on the Strain Population of Saccharomyces Cerevisiae. Int. J. Food Microbiol 2003, 80, 47–53. [Google Scholar] [CrossRef]
- Dos Santos, C.M.E.; Pietrowski, G.A.M.; Braga, C.M.; Rossi, M.J.; Ninow, J.; Dos Santos, T.P.M.; Wosiacki, G.; Jorge, R.M.M.; Nogueira, A. Apple Aminoacid Profile and Yeast Strains in the Formation of Fusel Alcohols and Esters in Cider Production. J. Food Sci. 2015, 80, C1170–C1177. [Google Scholar] [CrossRef] [PubMed]
- Rodríguez Madrera, R.; García Hevia, A.; Suárez Valles, B. Comparative Study of Two Aging Systems for Cider Brandy Making. Changes in Chemical Composition. LWT-Food Sci. Technol. 2013, 54, 513–520. [Google Scholar] [CrossRef]
- Ye, M.; Yue, T.; Yuan, Y. Evolution of Polyphenols and Organic Acids during the Fermentation of Apple Cider. J. Sci. Food Agric. 2014, 94, 2951–2957. [Google Scholar] [CrossRef] [PubMed]
- Bortolini, D.G.; Benvenutti, L.; Demiate, I.M.; Nogueira, A.; Alberti, A.; Zielinski, A.A.F. A New Approach to the Use of Apple Pomace in Cider Making for the Recovery of Phenolic Compounds. LWT 2020, 126, 109316. [Google Scholar] [CrossRef]
- Delage, E.; Bohuon, G.; Baron, A.; Drilleau, J.F. High-Performance Liquid Chromatography of the Phenolic Compounds in the Juice of Some French Cider Apple Varieties. J. Chromatogr. A 1991, 555, 125–136. [Google Scholar] [CrossRef]
- Ye, M.; Yue, T.; Yuan, Y. Changes in the Profile of Volatile Compounds and Amino Acids during Cider Fermentation Using Dessert Variety of Apples. Eur. Food Res. Technol. 2014, 239, 67–77. [Google Scholar] [CrossRef]
- Gomis, D.B.; Tamayo, D.M.; Alonso, J.M. Determination of Monosaccharides in Cider by Reversed-Phase Liquid Chromatography. Anal. Chim. Acta 2001, 436, 173–180. [Google Scholar] [CrossRef] [Green Version]
- Le Quéré, J.M.; Husson, F.; Renard, C.M.G.C.; Primault, J. French Cider Characterization by Sensory, Technological and Chemical Evaluations. LWT-Food Sci. Technol. 2006, 39, 1033–1044. [Google Scholar] [CrossRef]
- Farris, J.; Malone, T.; Robison, L.J.; Rothwell, N.L. Is “Localness” about Distance or Relationships? Evidence from Hard Cider. J. Wine Econ. 2019, 14, 252–273. [Google Scholar] [CrossRef]
- Ares, G.; Varela, P. Trained vs. Consumer Panels for Analytical Testing: Fueling a Long Lasting Debate in the Field. Food Qual. Prefer. 2017, 61, 79–86. [Google Scholar] [CrossRef] [Green Version]
- Stone, H.; Bleibaum, R.N.; Thomas, H.A. Sensory Evaluation Practices; Academic Press: Cambridge, MA, USA, 2012. [Google Scholar]
- Castura, J.C.; Findlay, C.J.; Lesschaeve, I. Monitoring Calibration of Descriptive Sensory Panels Using Distance from Target Measurements. Food Qual. Prefer. 2005, 16, 682–690. [Google Scholar] [CrossRef]
- Michon, C.; McDonnell, E. Validation of a Degree of Difference (DOD) Cut-off Point Using Cross-Cultural Insight for Quality Purposes. Food Qual. Prefer. 2008, 19, 727–733. [Google Scholar] [CrossRef]
- Morin, M.; Hayward, L.; McSweeney, M.B. Use of Experienced Panelists and the Projective Mapping Task in Comparison to Trained Panelists and Naïve Consumers. J. Sens. Stud. 2018, 33, e12463. [Google Scholar] [CrossRef]
- Barton, A.; Hayward, L.; Richardson, C.D.; McSweeney, M.B. Use of Different Panellists (Experienced, Trained, Consumers and Experts) and the Projective Mapping Task to Evaluate White Wine. Food Qual. Prefer. 2020, 83, 103900. [Google Scholar] [CrossRef]
- Castura, J.C.; Antúnez, L.; Giménez, A.; Ares, G. Temporal Check-All-That-Apply (TCATA): A Novel Dynamic Method for Characterizing Products. Food Qual. Prefer. 2016, 47, 79–90. [Google Scholar] [CrossRef] [Green Version]
- Baker, A.K.; Castura, J.C.; Ross, C.F. Temporal Check-All-That-Apply Characterization of Syrah Wine. J. Food Sci. 2016, 81, S1521–S1529. [Google Scholar] [CrossRef] [PubMed]
- de Souza Paglarini, C.; Vidal, V.A.S.; Dos Santos, M.; Coimbra, L.O.; Esmerino, E.A.; Cruz, A.G.; Pollonio, M.A.R. Using Dynamic Sensory Techniques to Determine Drivers of Liking in Sodium and Fat-Reduced Bologna Sausage Containing Functional Emulsion Gels. Food Res. Int. 2020, 132, 109066. [Google Scholar] [CrossRef]
- Schumaker, M.R.; Diako, C.; Castura, J.C.; Edwards, C.G.; Ross, C.F. Influence of Wine Composition on Consumer Perception and Acceptance of Brettanomyces Metabolites Using Temporal Check-All-That-Apply Methodology. Food Res. Int. 2019, 116, 963–972. [Google Scholar] [CrossRef]
- McMahon, K.M.; Culver, C.; Castura, J.C.; Ross, C.F. Perception of Carbonation in Sparkling Wines Using Descriptive Analysis (DA) and Temporal Check-All-That-Apply (TCATA). Food Qual. Prefer. 2017, 59, 14–26. [Google Scholar] [CrossRef]
- Mitchell, J.; Castura, J.C.; Thibodeau, M.; Pickering, G. Application of TCATA to Examine Variation in Beer Perception Due to Thermal Taste Status. Food Qual. Prefer. 2019, 73, 135–142. [Google Scholar] [CrossRef]
- Wei, J.; Wang, S.; Zhang, Y.; Yuan, Y.; Yue, T. Characterization and Screening of Non-Saccharomyces Yeasts Used to Produce Fragrant Cider. LWT 2019, 107, 191–198. [Google Scholar] [CrossRef]
- Antón, M.J.; Suárez Valles, B.; García Hevia, A.; Picinelli Lobo, A. Aromatic Profile of Ciders by Chemical Quantitative, Gas Chromatography-Olfactometry, and Sensory Analysis. J. Food Sci. 2014, 79, S92–S99. [Google Scholar] [CrossRef] [PubMed]
- Symoneaux, R.; Guichard, H.; Le Quéré, J.M.; Baron, A.; Chollet, S. Could Cider Aroma Modify Cider Mouthfeel Properties? Food Qual. Prefer. 2015, 45, 11–17. [Google Scholar] [CrossRef]
- Husson, F.; Bocquet, V.; Pagès, J. Use of Confidence Ellipses in a Pca Applied to Sensory Analysis Application to the Comparison of Monovarietal Ciders. J. Sens. Stud. 2004, 19, 510–518. [Google Scholar] [CrossRef]
- Piggott, J.R.; Watson, M.P. A Comparison of Free-Choice Profiling and the Repertory Grid Method in the Flavor Profiling of Cider. J. Sens. Stud. 1992, 7, 133–145. [Google Scholar] [CrossRef]
- Ares, G.; Jaeger, S.R.; Bava, C.M.; Chheang, S.L.; Jin, D.; Gimenez, A.; Vidal, L.; Fiszman, S.M.; Varela, P. CATA Questions for Sensory Product Characterization: Raising Awareness of Biases. Food Qual. Prefer. 2013, 30, 114–127. [Google Scholar] [CrossRef]
- Meyners, M.; Castura, J.C. Randomization of CATA Attributes: Should Attribute Lists Be Allocated to Assessors or to Samples? Food Qual. Prefer. 2016, 48, 210–215. [Google Scholar] [CrossRef]
- Kemp, B.; Trussler, S.; Willwerth, J.; Inglis, D. Applying Temporal Check-All-That-Apply (TCATA) to Mouthfeel and Texture Properties of Red Wines. J. Sens. Stud. 2019, 34, e12503. [Google Scholar] [CrossRef]
- Ares, G.; Alcaire, F.; Antúnez, L.; Vidal, L.; Giménez, A.; Castura, J.C. Identification of Drivers of (Dis)Liking Based on Dynamic Sensory Profiles: Comparison of Temporal Dominance of Sensations and Temporal Check-All-That-Apply. Food Res. Int. 2017, 92, 79–87. [Google Scholar] [CrossRef] [PubMed]
- Kessinger, J.; Earnhart, G.; Hamilton, L.; Phetxumphou, K.; Neill, C.; Stewart, A.C.; Lahne, J. Exploring Perceptions and Categorization of Virginia Hard Ciders through the Application of Sorting Tasks. J. Am. Soc. Brew. Chem. 2021, 79, 187–200. [Google Scholar] [CrossRef]
- Włodarska, K.; Pawlak-Lemańska, K.; Górecki, T.; Sikorska, E. Perception of Apple Juice: A Comparison of Physicochemical Measurements, Descriptive Analysis and Consumer Responses. J. Food Qual. 2016, 39, 351–361. [Google Scholar] [CrossRef]
- Jamir, S.M.R.; Stelick, A.; Dando, R. Cross-Cultural Examination of a Product of Differing Familiarity (Hard Cider) by American and Chinese Panelists Using Rapid Profiling Techniques. Food Qual. Prefer. 2020, 79, 103783. [Google Scholar] [CrossRef]
- Chambers, D.H.; Allison, A.M.A.; Chambers, E. Training Effects on Performance of Descriptive Panelists. J. Sens. Stud. 2004, 19, 486–499. [Google Scholar] [CrossRef]
- Wu, A.Z.; Lee, R.W.; Calvé, B.L.; Cayeux, I. Temporal Profiling of Simplified Lemonade Using Temporal Dominance of Sensations and Temporal Check-All-That-Apply. J. Sens. Stud. 2019, 34, e12531. [Google Scholar] [CrossRef]
- McCain-Keefer, H.R.; Meals, S.; Drake, M. The Sensory Properties and Consumer Acceptance of Cold Brew Coffee. J. Sens. Stud. 2020, 35, e12604. [Google Scholar] [CrossRef]
- Jaeger, S.R.; Beresford, M.K.; Hunter, D.C.; Alcaire, F.; Castura, J.C.; Ares, G. Does a Familiarization Step Influence Results from a TCATA Task? Food Qual. Prefer. 2017, 55, 91–97. [Google Scholar] [CrossRef]


| Cider | Type | Brix | pH | Alcohol Percentage | Packaging | Price (CAD) |
|---|---|---|---|---|---|---|
| S1 | Sweet | 5.6 | 3.4 | 6.0% | 473 mL Can | 4.99 |
| S2 | Sweet | 6.4 | 3.6 | 5.3% | 500 mL Bottle | 4.75 |
| S3 | Sweet | 6.0 | 3.6 | 5.8% | 500 mL Bottle | 4.75 |
| D1 | Dry | 4.5 | 3.7 | 6.5% | 500 mL Bottle | 4.69 |
| D2 | Dry | 4.3 | 3.9 | 6.0% | 500 mL Bottle | 4.29 |
| Attribute | S1 | S2 | S3 | D1 | D2 | D2 |
|---|---|---|---|---|---|---|
| Appearance | ||||||
| Clarity 1 | 5.6 a ± 1.1 | 7.2 b ± 1.3 | 6.2 ab ± 1.5 | 6.6 ab ± 1.3 | 5.4 a ± 1.5 | 5.6 a ± 1.6 |
| Carbonation | 3.1 a ± 1.0 | 3.2 a ± 1.1 | 3.8 a ± 1.3 | 3.7 a ± 1.0 | 2.8 a ± 1.0 | 2.9 a ± 1.0 |
| Aroma | ||||||
| Floral | 5.0 a ± 1.2 | 5.1 a ± 1.3 | 5.5 a ± 1.5 | 4.0 b ± 1.1 | 3.8 b ± 1.2 | 3.8 b ± 1.3 |
| Fresh Apple | 4.9 ab ± 0.9 | 4.3 ab ± 1.2 | 4.7 ab ± 1.2 | 5.2 a ± 1.4 | 3.0 c ± 1.2 | 3.2 c ± 1.2 |
| Cooked Apple | 3.4 a ± 1.0 | 3.3 a ± 1.0 | 3.1 a ± 1.0 | 2.1 b ± 0.9 | 2.0 b ± 1.0 | 2.0 b ± 1.2 |
| Citrus | 2.8 a ± 0.9 | 3.3 a ± 1.1 | 3.7 a ± 1.2 | 2.9 a ± 1.1 | 2.9 a ± 1.0 | 2.8 a ± 1.1 |
| Banana | 1.9 ab ± 1.1 | 1.4 ab ± 0.5 | 2.9 a ± 1.1 | 2.2 ab ± 1.1 | 1.1 b ± 0.6 | 1.3 ab ± 1.1 |
| Yeasty | 2.4 a ± 1.1 | 2.7 a ± 1.2 | 2.2 a ± 1.0 | 2.6 a ± 1.2 | 3.5 a ± 1.2 | 3.1 a ± 1.3 |
| Chemical | 2.1 b ± 0.8 | 2.1 b ± 0.9 | 2.3 b ± 0.8 | 2.3 b ± 0.9 | 3.6 a ± 1.2 | 3.3 a ± 1.3 |
| Earthy | 2.3 a ± 0.9 | 2.5 a ± 1.1 | 2.3 a ± 0.9 | 4.2 b ± 1.0 | 4.0 b ± 1.2 | 4.1 b ± 1.4 |
| Perfume | 3.8 a ± 1.0 | 4.1 a ± 1.2 | 2.8 b ± 1.1 | 2.9 b ± 1.2 | 3.8 a ± 1.2 | 3.3 ab ± 1.2 |
| Mouldy | 1.6 a ± 1.0 | 2.7 b ± 0.9 | 2.1 ab ± 1.1 | 2.1 ab ± 1.0 | 3.7 c ± 1.1 | 3.9 c ± 1.4 |
| Taste/Mouthfeel | ||||||
| Sweet | 3.7 a ± 1.1 | 5.8 b ± 1.4 | 5.6 ab ± 1.4 | 2.6 c ± 1.1 | 2.9 c ± 1.3 | 2.5 c ± 1.0 |
| Sour | 4.6 ab ± 1.4 | 3.4 b ± 1.1 | 3.2 b ± 1.2 | 5.7 a ± 1.3 | 5.1 a ± 1.3 | 5.2 a ± 1.2 |
| Bitter | 3.8 a ± 1.1 | 3.7 a ± 1.1 | 2.5 a ± 1.1 | 4.2 ab ± 1.1 | 4.9 b ± 1.1 | 4.9 b ± 1.0 |
| Salty | 0.9 a ± 0.3 | 0.7 a ± 0.2 | 0.6 a ± 0.2 | 0.8 a ± 0.3 | 0.8 a ± 0.2 | 0.9 a ± 0.2 |
| Astringency | 3.6 a ± 1.1 | 3.9 a ± 1.1 | 2.7 a ± 1.2 | 4.4 a ± 1.0 | 5.8 b ± 1.5 | 5.0 b ± 1.3 |
| Aftertaste | 4.2 a ± 1.0 | 5.1 a ± 1.2 | 4.2 a ± 1.4 | 5.1 a ± 1.3 | 5.3 a ± 1.0 | 4.7 a ± 1.3 |
| Acidic | 4.7 a ± 1.2 | 4.1 a ± 1.2 | 3.4 a ± 1.3 | 4.9 a ± 1.3 | 4.2 a ± 1.2 | 4.5 a ± 1.2 |
| Tannic | 2.4 a ± 0.8 | 2.3 a ± 1.2 | 2.7 b ± 1.1 | 4.3 b ± 1.4 | 4.3 b ± 1.2 | 4.6 b ± 1.4 |
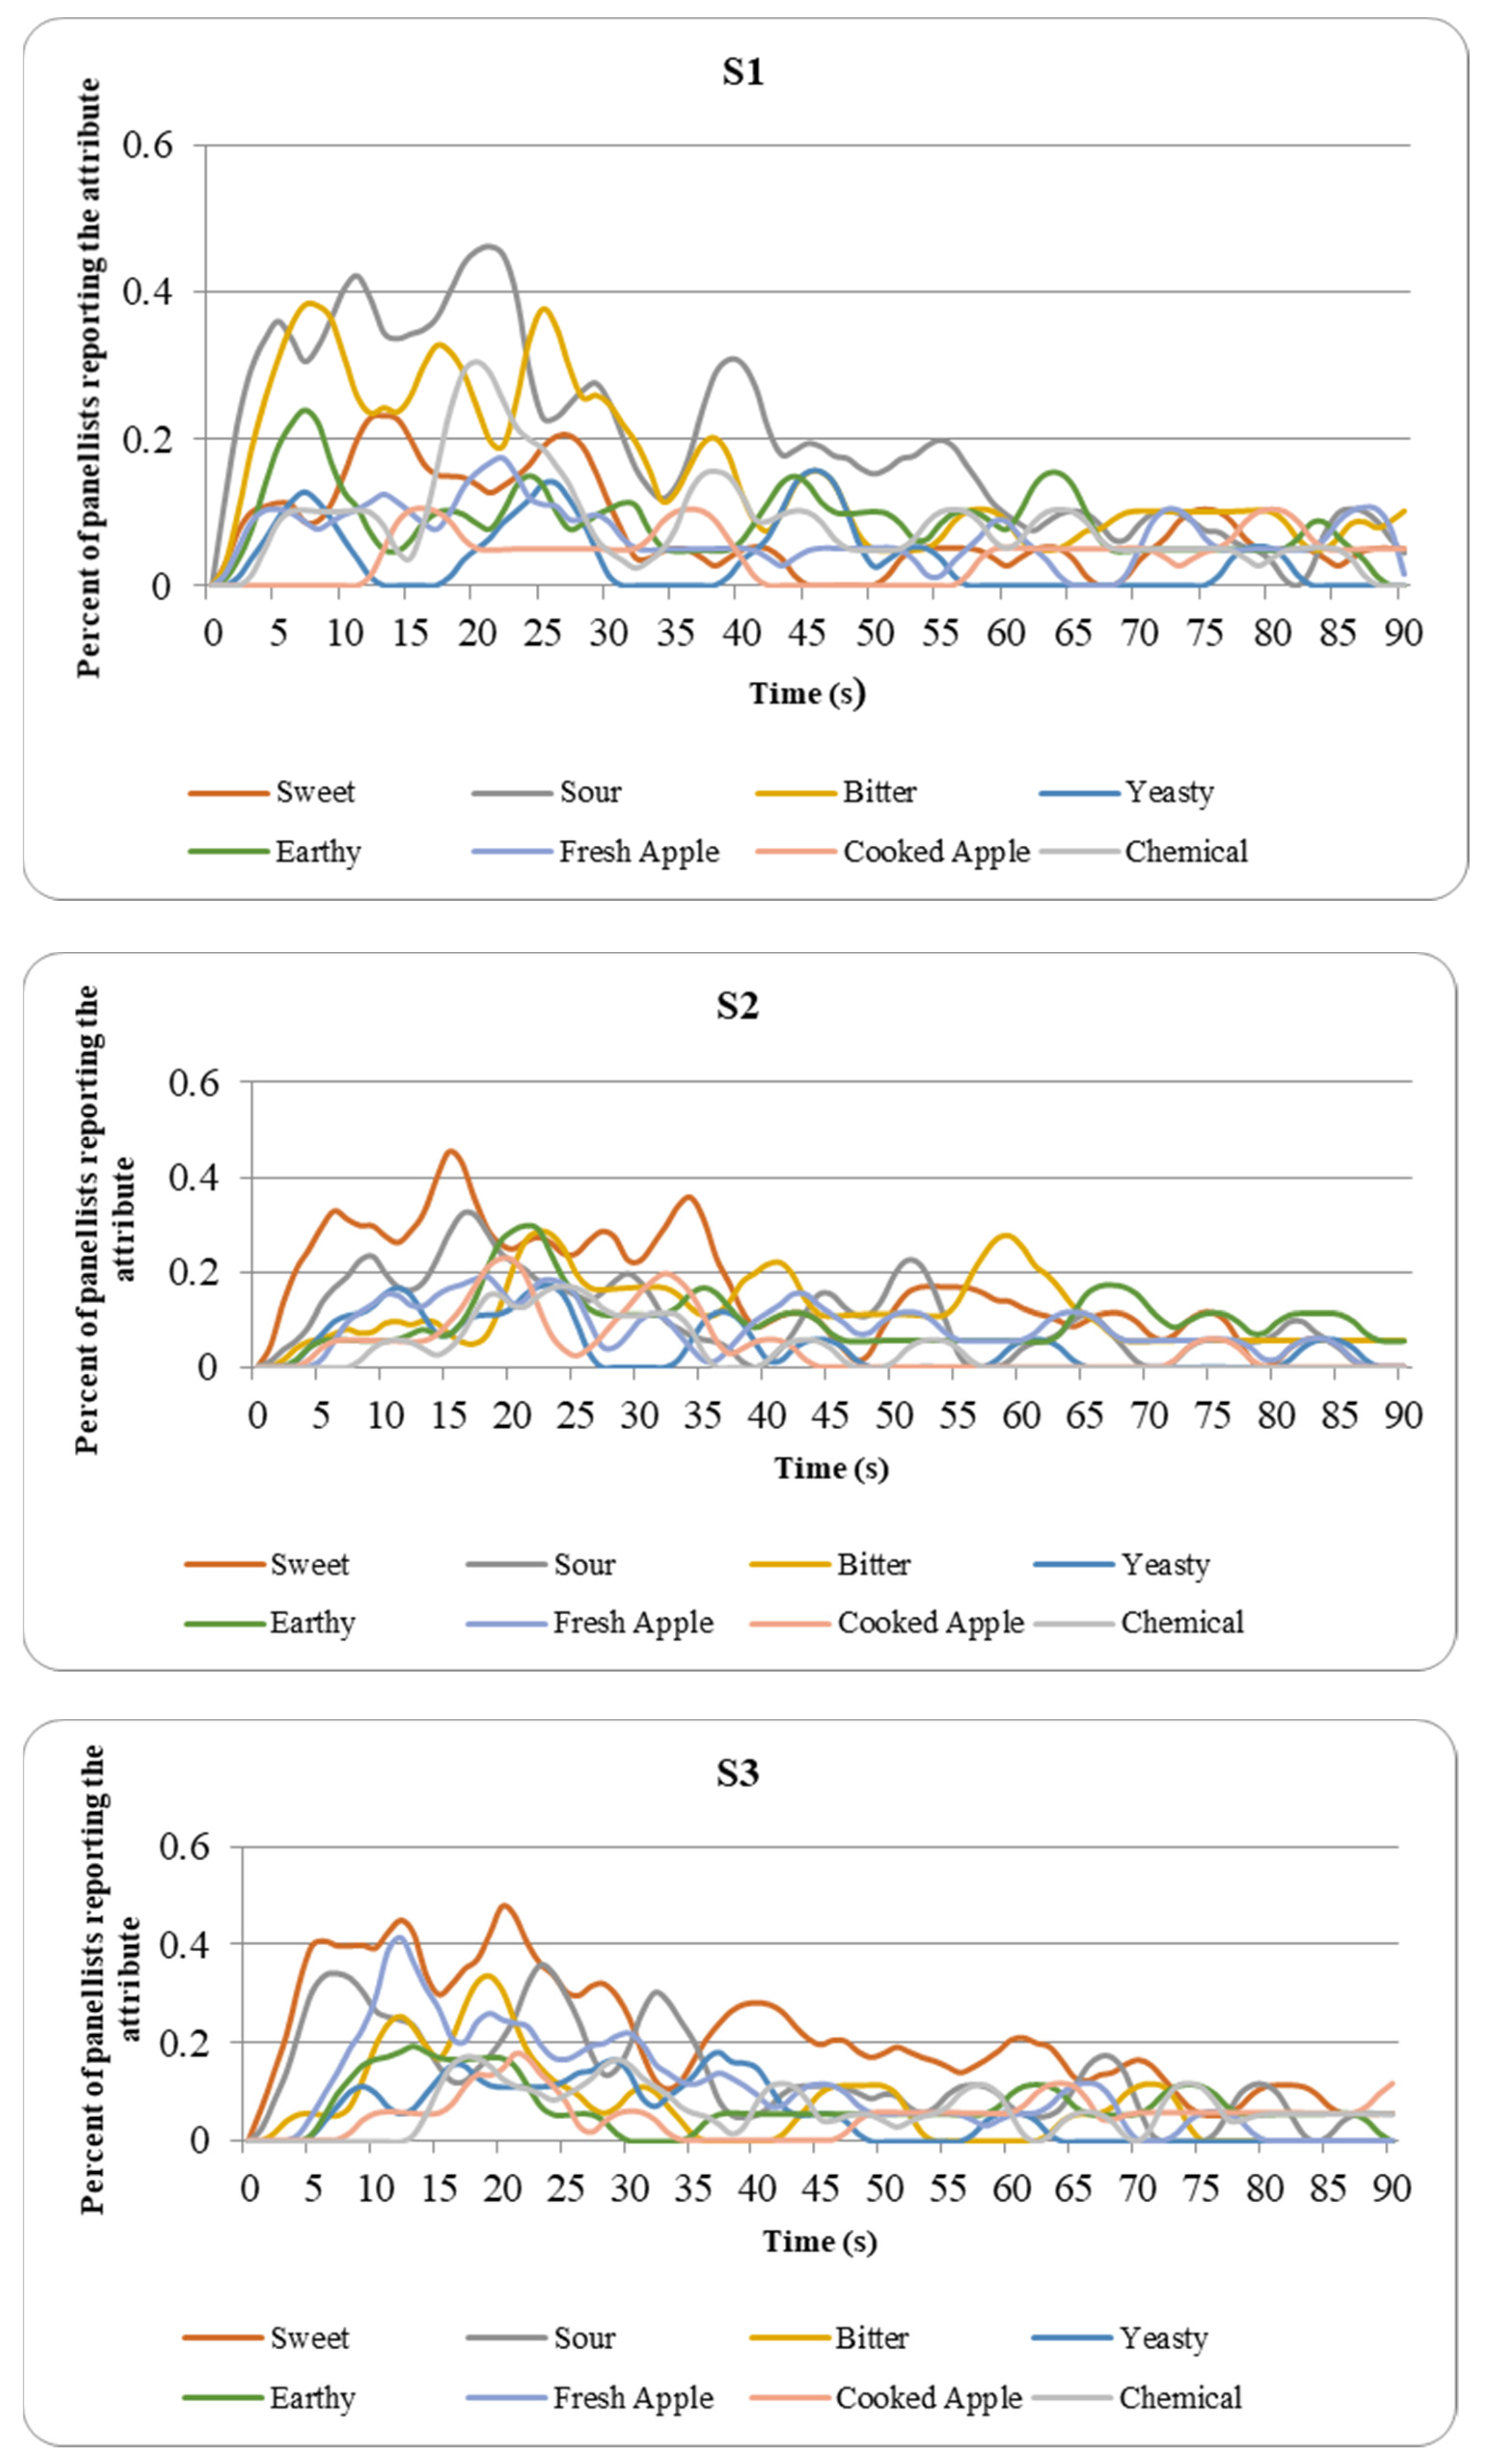
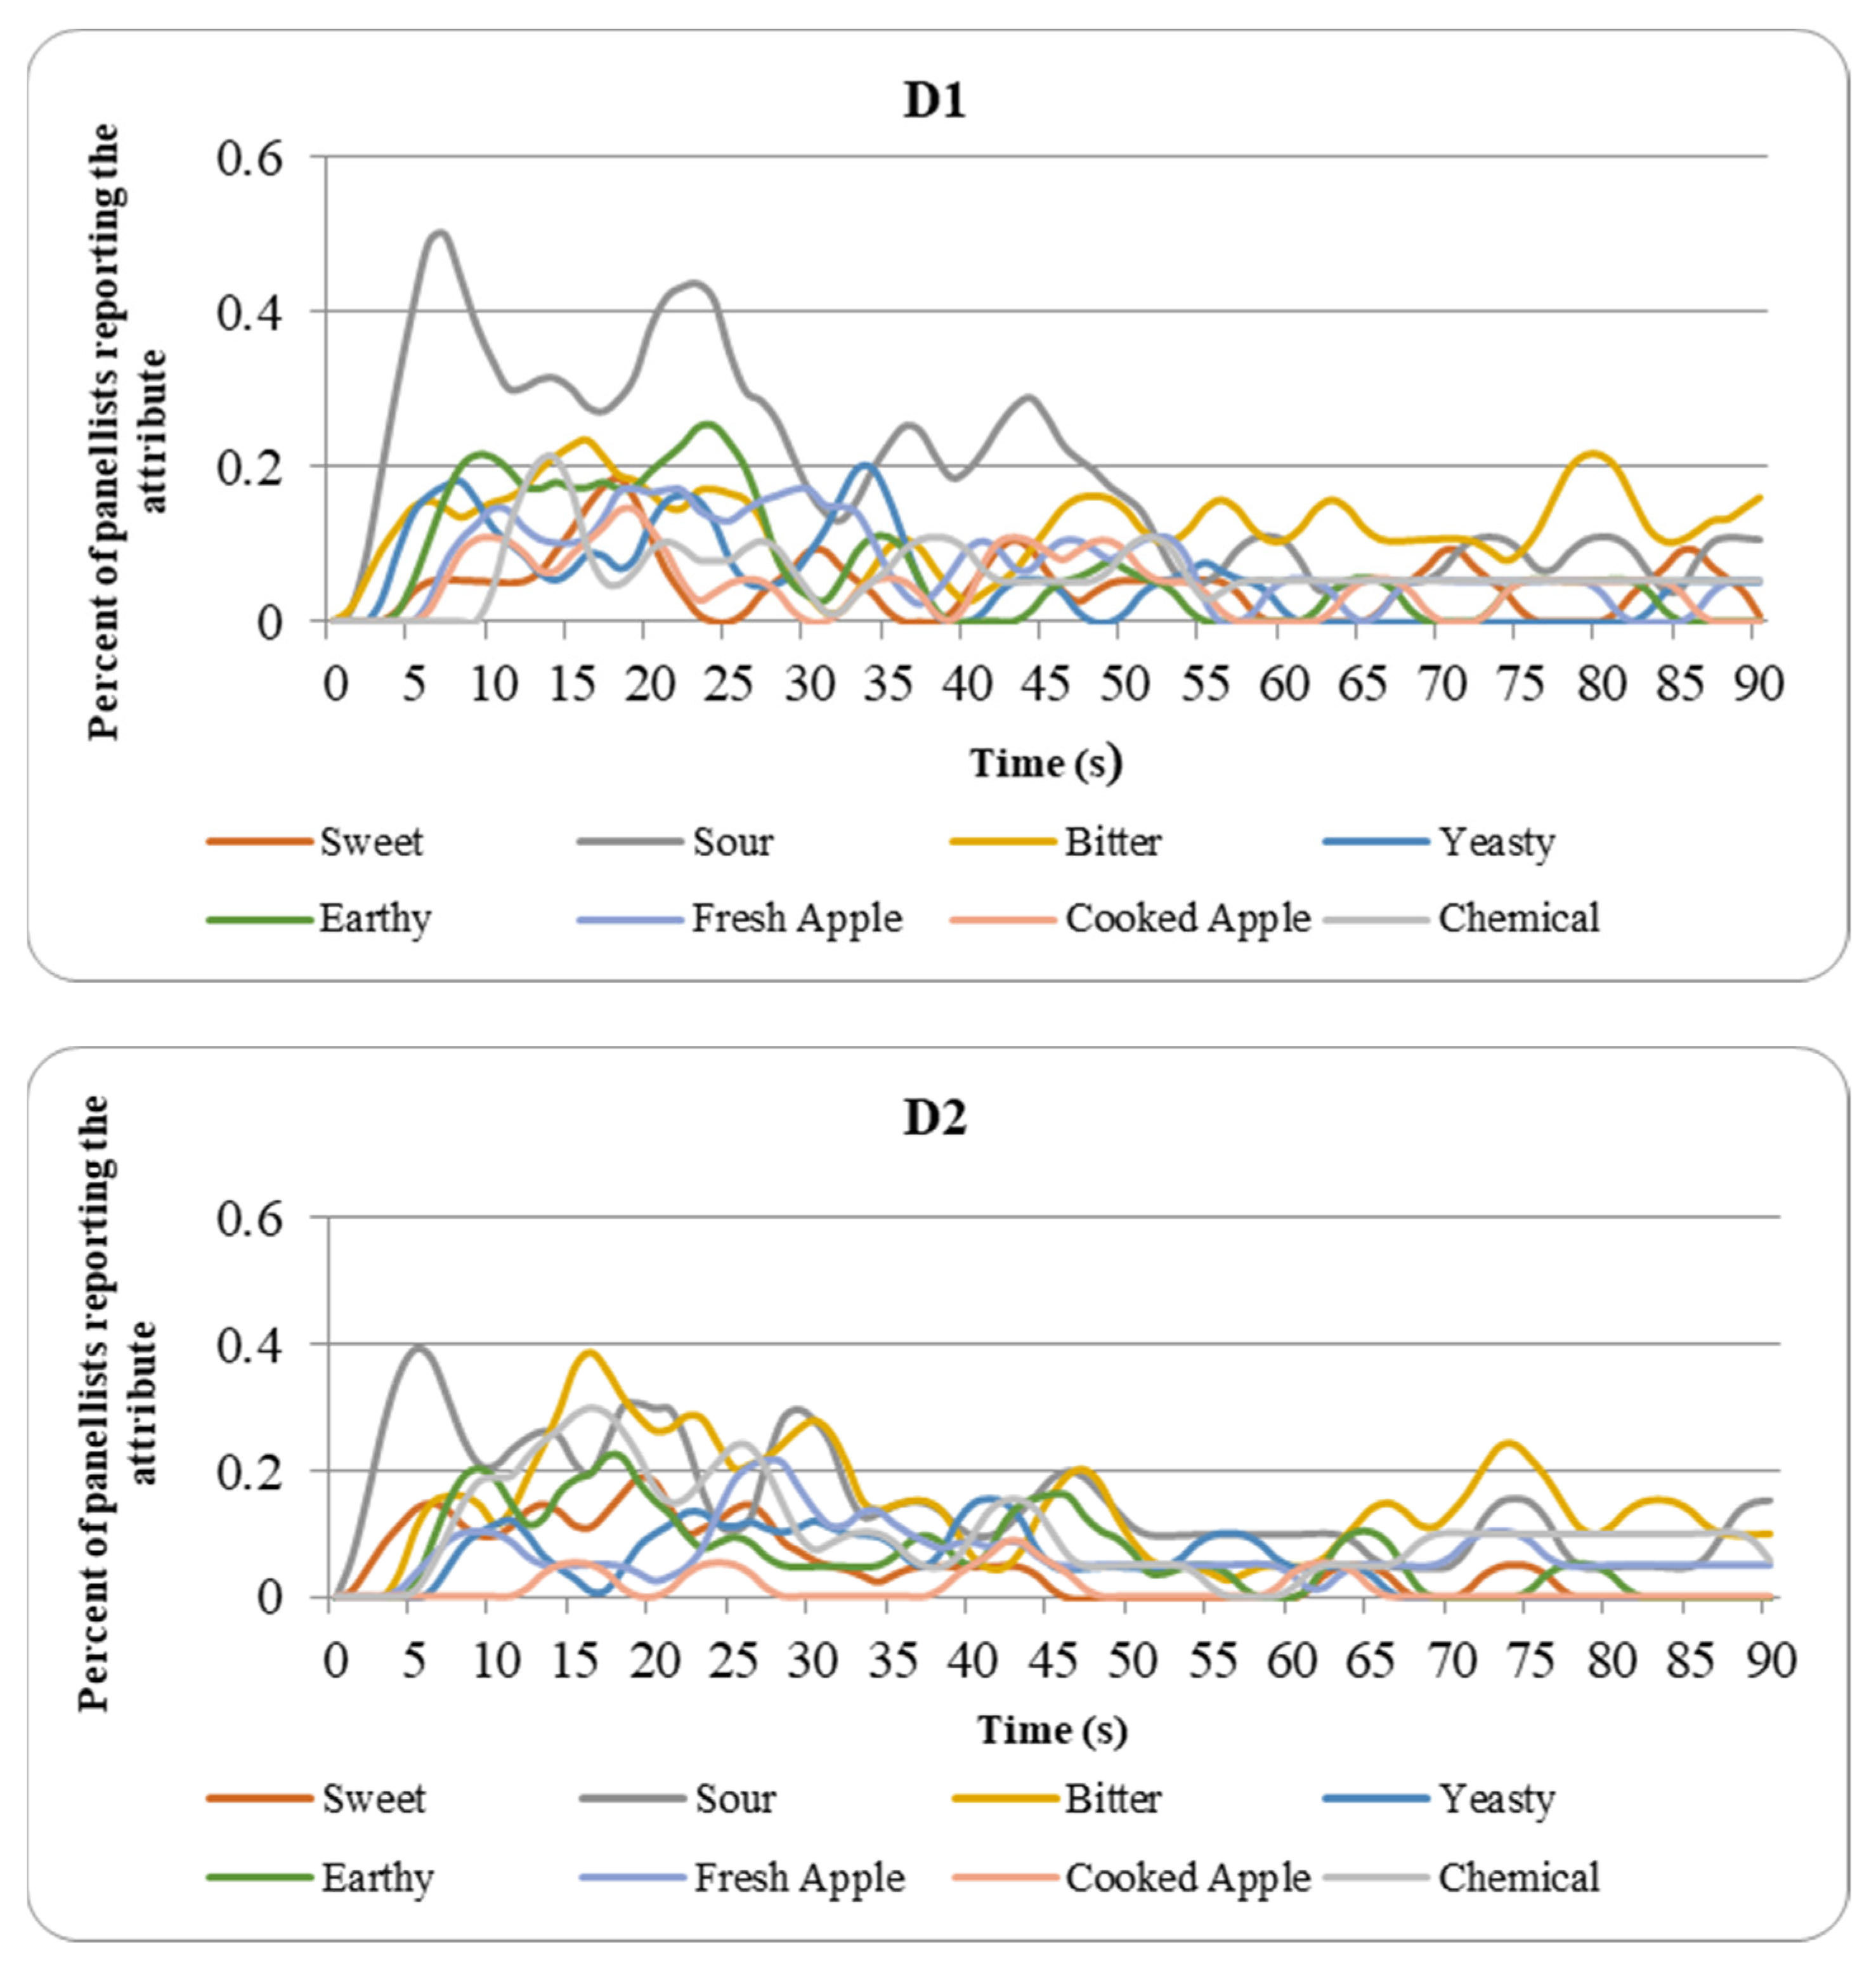
| Sample | Bitter | Chemical | Cooked Apple | Earthy | Fresh Apple | Sour | Sweet | Yeasty |
|---|---|---|---|---|---|---|---|---|
| S1 1 | 0.146 a | 0.048 a | 0.033 a | 0.082 a | 0.125 a | 0.225 a | 0.179 a | 0.100 a |
| S2 | 0.117 b | 0.037 a | 0.044 a | 0.101 a | 0.081 ab | 0.105 b | 0.164 a | 0.044 b |
| S3 | 0.072 c | 0.065 a | 0.052 a | 0.072 a | 0.106 a | 0.135 b | 0.216 a | 0.054 b |
| D1 | 0.131 a | 0.062 a | 0.047 a | 0.070 a | 0.079 b | 0.198 a | 0.042 b | 0.056 b |
| D2 | 0.166 a | 0.116 b | 0.015 a | 0.077 a | 0.077 b | 0.171 a | 0.058 b | 0.061 b |
| D2 | 0.167 a | 0.106 b | 0.046 a | 0.088 a | 0.073 b | 0.213 a | 0.084 b | 0.037 b |
Publisher’s Note: MDPI stays neutral with regard to jurisdictional claims in published maps and institutional affiliations. |
© 2021 by the authors. Licensee MDPI, Basel, Switzerland. This article is an open access article distributed under the terms and conditions of the Creative Commons Attribution (CC BY) license (https://creativecommons.org/licenses/by/4.0/).
Share and Cite
Moss, R.; Barker, S.; McSweeney, M.B. The Use of Temporal Check-All-That-Apply and Category Scaling by Experienced Panellists to Evaluate Sweet and Dry Ciders. Beverages 2021, 7, 24. https://0-doi-org.brum.beds.ac.uk/10.3390/beverages7020024
Moss R, Barker S, McSweeney MB. The Use of Temporal Check-All-That-Apply and Category Scaling by Experienced Panellists to Evaluate Sweet and Dry Ciders. Beverages. 2021; 7(2):24. https://0-doi-org.brum.beds.ac.uk/10.3390/beverages7020024
Chicago/Turabian StyleMoss, Rachael, Sophie Barker, and Matthew B. McSweeney. 2021. "The Use of Temporal Check-All-That-Apply and Category Scaling by Experienced Panellists to Evaluate Sweet and Dry Ciders" Beverages 7, no. 2: 24. https://0-doi-org.brum.beds.ac.uk/10.3390/beverages7020024