Article

Fabrication and Photocatalytic Properties of Electrospun Fe-Doped TiO2 Nanofibers Using Polyvinyl Pyrrolidone Precursors

1
Department of Advanced Materials Engineering, Gangneung-Wonju National University, Gangneung 25457, Korea
2
Korea Institute of Civil Engineering and Building Technology, Goyang 10223, Korea
3
Graduate School of Energy Science and Technology, Chungnam National University, Daejeon 34134, Korea
4
Research Institute for Dental Engineering, Gangneung-Wonju National University, Gangneung 25457, Korea
*
Authors to whom correspondence should be addressed.
First two authors contributed equally to this work.
Submission received: 28 July 2021 / Revised: 4 August 2021 / Accepted: 5 August 2021 / Published: 7 August 2021
(This article belongs to the Special Issue Advanced Electrospinning Technology)

Abstract

:
For the removal of pollutants, a modified TiO2 photocatalyst is attracting attention. Fe-doped TiO2 nanofibers were prepared through a combination of electrospinning and calcination. Morphological characterization of the sample was conducted using field-emission scanning electron and transmission electron microscopy. The crystal structure of each sample was analyzed using high-resolution transmission electron microscopy, selected area electron diffraction, and Fast Fourier Transform imaging. The average diameter of the Fe-doped TiO2 nanofibers was measured to be 161.5 nm and that of the pure TiO2 nanofibers was 181.5 nm. The crystal phase when heat treated at 350 °C was anatase for TiO2 nanofibers and rutile for Fe-doped TiO2 nanofibers. The crystal phase of the TiO2 matrix was easily transitioned to rutile by Fe-doping. The photocatalytic performance of each sample was compared via the photodegradation of methylene blue and acid orange 7 under ultraviolet and visible light irradiation. In the Fe-doped TiO2 nanofibers, photodegradation rates of 38.3% and 27.9% were measured under UV irradiation and visible light, respectively. Although other catalysts were not activated, the photodegradation rate in the Fe-doped TiO2 nanofibers was 9.6% using acid orange 7 and visible light. For improved photocatalytic activity, it is necessary to study the concentration control of the Fe dopant.

Graphical Abstract

1. Introduction

Since Honda and Fujishima reported photoelectrolysis photoelectrodes without an external power source in 1972 [1], TiO2 has been drawing substantial attention, and many studies have been conducted to apply TiO2 to various industrial fields, such as sensors [2,3,4,5], drug delivery systems [6,7,8], photocatalysts [9,10,11,12], and photoelectrodes [13,14,15]. TiO2 has many attractive properties; among them, non-toxicity, strong durability, and excellent chemical stability are regarded as suitable photocatalyst properties for water purification. Despite these excellent properties of TiO2, some issues must be addressed to ensure its applicability in industry: electron–hole pair recombination and electromagnetic wave absorption bands that are too wide. In order to accomplish the reduction–oxidation cycle that is targeted for applications as a photocatalyst, electrons in the valence band are excited by absorbing electromagnetic waves that are incident from the outside, and the excited electrons and holes must then be transferred to the surface of the semiconductor to react with the pollution. However, most of the excited electron-hole pairs are recombined in the transfer process to the surface, and the electrical energy is converted to heat energy. In this case, electrons and holes cannot contribute to the photocatalytic reaction. Second, there is the issue of the electromagnetic wave absorption band. The wide bandgap due to the unique electronic structure of the TiO2 gives strong oxidizing power to photoelectrons, but at the same time, it increases the light energy required to generate an excited electron–hole pair.
For this reason, in the case of anatase TiO2 with a bandgap of 3.2 eV, only a short wavelength no longer than 387.5 nm can be used for the reaction, which means that 95% of the sunlight incident on the earth cannot be used. Because these factors directly reduce the efficiency of the photocatalyst, various methods have been proposed to solve these issues, including elemental doping [16,17,18,19,20,21,22,23], dye sensitization [24,25,26], and microstructure control [27,28,29]. In the case of elemental doping, the dopant acts as a trap for excited electrons or holes, which delays the recombination of electron–hole pairs. Trap states due to the dopant energy level effectively separate the electron–hole pairs and their redox sites. However, at excessively high dopant concentrations, it should be noted that the photoelectric conversion efficiency may be reduced because of competition with the carrier transfer process at the surface. At the same time, if an appropriate element is doped, the band of the wavelength of the required electromagnetic wave can be controlled by improving the electronic structure. The dopant energy level in the TiO2 band gap expands the range of usable light energy [30,31,32]. Since elemental doping is an effective solution that can address both of the issues mentioned above, it is important to determine the appropriate element and optimized concentration. Commonly considered appropriate doping elements are metals [33,34,35,36] such as Cu, Fe, Mo, Ni; noble metals [37,38,39] such as Au, Ag, Pd; and anions [40,41,42,43,44] such as N, C, B, P, and S.
In addition, studies to optimize photoelectric conversion and transfer efficiency through morphology and specific surface area control have been conducted extensively, and various structures and synthesis methods have been suggested. To fabricate various TiO2 nanostructures such as nanoparticles, nanorods, nanotubes, nanograins, and nanowires, some synthesis methods have been considered, such as hydrothermal methods, sol–gel methods, chemical vapor deposition (CVD), anodization, microwave synthesis, and electrospinning [45,46,47,48,49]. Furthermore, efficiency can be improved by optimizing the shape anisotropy and the electrical properties of each microstructure.
Among them, electrospinning is a process using the jet spraying and the stretching of a polymer solution generated by an electrostatic force and is an effective process to fabricate one dimensional nanofibers. Although the basic ideas of electrohydrodynamics (EHD) have been explored since around the 16th century, earnest studies to apply them to microfiber fabrication have been discussed by researchers such as Williams and Taylor, starting with the patent of A. Formhals in 1934. Recently, various structures such as homogeneous [50], core-shell [51], Janus [52], tri-layer core–shell [53], and other complicated [54] nanofibers can be fabricated based on a basic understanding and process modeling. To use these various structures effectively, many studies have been conducted such as a biocompatible drug delivery system with antibacterial activity [55,56,57,58,59]. Additionally, various types of structures using nanofibers can be fabricated through after-treatment methods such as calcination [60] and cross-linking [61,62,63].
In this study, we used an electrospinning process to effectively fabricate TiO2 semiconductor nanofibers. Iron nitrate was added to a typical precursor solution for fabricating TiO2 nanofibers to dope the Fe element to the nanofibers. We anticipated that the fibrous nanofibers fabricated using the electrospinning process to improve mobility by limiting the pathway of the charge carriers to be one-dimensional and by suppressing recombination. At the same time, we reduced the required cost and time through an integrated fabrication process and nanostructure doping. The crystal structure and morphology of the calcined nanofibers were observed using a field emission scanning electron microscope (FE-SEM), a transmission electron microscope (TEM), and energy dispersive X-ray spectroscopy (EDS). A photo-degradation test was conducted using various photocatalysts, methylene blue aqueous solution, and an ultraviolet light source.

2. Materials and Methods

2.1. Chemicals

The reagents used to prepare the precursor solutions were as follows: titanium tetraisopropoxide (TTIP, ≥98.0%, GR, Junsei, Tokyo, Japan), acetyl acetone (ACAC, ≥99.0%, GR, Junsei, Japan), ethyl alcohol (EtOH, ≥99.5% EP, Daejung, Siheung, Korea), polyvinyl pyrrolidone (PVP, M.W. 1,300,000, Alfa Aesar, Haverhill, MA, USA), Fe(NO3)2·9H2O (GR, ≥ 99.0%, Kanto Chemical, Japan), titanium(IV) oxide (P25, ≥95.0%, Sigma-Aldrich, St. Louis, MO, USA), methylene blue ( ≥82.0%, Sigma-Aldrich, St. Louis, MO, USA), and acid-orange 7(AO7, ≥85.0%, Acros organics, Suwanee, GA, USA).

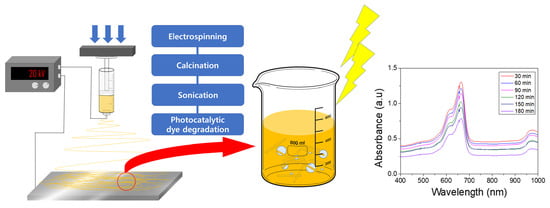
2.2. Electrospinning Process

First, 10.0 g of PVP was added to 60.0 g of EtOH and was stirred for 24 h using a magnetic stirrer to prepare a polymer solution. In another beaker, an aqueous solution of 7.5 g of TTIP, 10.0 g of ACAC, 2.5 g of Fe(NO3)2·9H2O, and 10.0 g of deionized water was stirred for 4 h. The polymer solution and the aqueous solution were then mixed and stirred for 2 h to prepare a reddish-brown precursor solution. In order to compare the photocatalytic activity caused by the Fe-doping, a precursor solution for the pure TiO2 nanofibers was prepared by only removing the Fe(NO3)2·9H2O from the same composition.
The two prepared precursor solutions were loaded into a polypropylene syringe with a diameter of 15.56 mm and a volume of 12 mL and were then mounted on a syringe pump. The syringes were connected to a stainless steel adapter and a 23-gauge needle using polypropylene tubing. We subsequently applied high voltage to the nozzle adapter using a power supplier and a constant flow rate at the same time to induce jet spinning from the droplets of the solution to the grounded aluminum foil collector. The applied electrospinning conditions were as follows: distance between electrodes of 20 cm, an applied voltage of 20 kV, a flow rate of 1.0 mL/h, room temperature, and humidity less than 40%. The composite nanofibers collected on the aluminum foil during the electrospinning process were collected every 1 h and were dried at 60 °C in a dry oven. The calcination process was then conducted at 350 °C using a box furnace. The temperature ramping speed was 5 °C/min.

2.3. Characterization

The crystal structure and morphology of the calcined nanofibers were analyzed by a field emission scanning electron microscope (FE-SEM, Inspect F, FEI Korea Co., Ltd., Gyeonggi, Korea), a transmission electron microscope (TEM, JEM-2200FS, Jeol Co., Ltd., Tokyo, Japan), and energy dispersive X-ray spectroscopy (EDS). In addition, a photodegradation test was conducted using a photocatalyst/methylene blue aqueous solution and an ultraviolet light source, and the degradation rate was compared using an ultraviolet–visible spectrophotometer (UV–Vis, G1103A, Agilent Co., Ltd., Santa Clara, CA, USA). To determine the calcination temperature, Thermogravimetric analysis (TGA) was conducted using a thermogravimetric analyzer (TGA, Q500, TA instruments, New Castle, DE, USA).

2.4. Photocatalytic Degradation Test

All steps of the photocatalytic degradation tests were conducted in a condition where the natural sunlight was blocked. Methylene blue, AO7, and distilled water were used to simulate contaminated water. Since it was necessary to apply the same contamination concentration of all test samples, 5 mg/L and 20 mg/L of methylene blue and AO7 aqueous solutions, respectively, were prepared in large-capacity bottles. As catalysts for photodegradation, P25, TiO2 nanofibers, and Fe-doped TiO2 nanofibers were used. To fabricate the mixture samples, 0.2 g of each catalyst and 20 mL of deionized water were added to a Pyrex beaker and were stirred for 30 min. Subsequently, 200 mL of methylene blue and AO7 aqueous solution were added. The beaker was then wrapped with aluminum foil to completely block the incident light, and the mixture was stirred for 2 h. A photocatalytic degradation test of each mixture was conducted in a darkroom using UV (6W, 365 nm) and Vis (500 W, Xenon lamp) light sources for 3 h. During degradation, the catalyst filtered solution was sampled by using a syringe and a polyvinylidene fluoride syringe filter (PVDF filter, 0.2 μm, Whatman, Marlborough, MA, USA) every 30 min and was stored in a cuvette wrapped in aluminum foil. The irradiation distance between the light source and the sample was fixed at 10 cm, and the rotation speed of the stirrer was 240 rpm.

3. Results and Discussion

To determine the calcination temperature, TGA was conducted. Figure 1 shows the TGA curves of the TiO2 nanofibers and the Fe-doped TiO2 nanofibers. N2 was used as a purge gas for analysis, and the ramping speed was 5 °C/min. Both samples showed similar thermal decomposition behavior. Until the temperature in the chamber reached 120 °C, the moisture and the solvents adsorbed on the samples evaporated, and the weight decreased. Crystallization started at 210 °C, and the carbonization and the thermal decomposition of the PVP started near 350 °C, causing rapid weight loss. Since N2 was used as the purge gas, it showed thermal decomposition behavior and not combustion. The final weights of the TiO2 and the Fe-doped TiO2 nanofibers were 20.3 wt % and 22.3 wt %, respectively. The difference was due to the non-volatile components that increased with the addition of Fe nitrate in the same precursor solution.
Figure 2 shows FE-SEM images obtained from the TiO2 and Fe-doped TiO2 samples. Figure 2a,b are low and high magnification images of the TiO2 nanofibers, and c and d are images of the Fe-doped TiO2 nanofibers, respectively. It was confirmed that uniform fibrous structures were obtained, thus reflecting that the electrospinning process and calcination were conducted using appropriate conditions in which defects such as cracks or beads did not form.
The average diameters of the nanofibers were measured in the obtained FE-SEM images. Figure 3 presents the diameter histogram of the nanofibers. The average diameters of the TiO2 and Fe-doped TiO2 nanofibers were measured to be 181.5 nm and 162.5 nm, respectively. The content of non-volatile components remaining after the calcination was higher in the Fe-doped TiO2 nanofibers, but the average diameter was lower than that of the TiO2 nanofibers. We considered that the stretching process was more vigorous because the dielectric constant of the solution was increased due to the added Fe(NO3)2·9H2O.
Images of the morphology of a single nanofiber were obtained using TEM. Figure 4a,b show bright-field images (BF) and high-angle annular dark-field images (HADDF) of the TiO2 nanofibers, respectively. Figure 4c,d are TEM images of Fe-doped TiO2 nanofibers. It can be seen that the inside and surface of the TiO2 nanofiber have a uniform single phase, but there are many particles of another phase on the Fe-doped TiO2 nanofibers. The diameters of the particles formed on the Fe-doped TiO2 nanofibers are distributed in the range of 23–29 nm. The reason for this morphological difference was confirmed in other analysis results using TEM accessories.
Figure 5 shows the EDS mapping results of a single nanofiber sample. In both samples, titanium and oxygen are uniformly distributed throughout the whole nanofiber, but it can be seen that Fe was mainly located in another phase site that was discontinuously distributed on the Fe-doped TiO2 nanofiber. This means that the Fe dopant did not diffuse into the TiO2 lattice as an interstitial or substitutional atom during crystal growth and did not form a secondary phase. In order to quantify the ratio of each element, an additional EDS spectrum analysis using FE-SEM was conducted for the Fe-doped TiO2 nanofibers. The atomic ratios of Ti, O, and Fe were 29.18 at%, 63.45 at%, and 7.37 at%, respectively, which means that the TiO2 and gamma-ferrite phases were well separated and heterogeneous, as confirmed in the TEM image.
Selected area electron diffraction results for each fiber are shown in Figure 6a,b. Both Figure 6a,b show a ring-type diffraction pattern rather than a circle. This means that both samples were well crystallized. In the case of the amorphous phase, the pattern is diffused and shows a circular pattern. Figure 6a shows the diffraction pattern of the TiO2 nanofiber, and the (101) plane, which has a significant peak of the anatase phase, was identified. On the other hand, Figure 6b shows the diffraction pattern of the Fe-doped TiO2 nanofiber, and it was indexed to the rutile phase. In general, when the heat treatment temperature increased, the anatase phase transitions to rutile and a high-temperature stable phase, but the calcination temperature of the two samples was the same at 350 °C. This result is the same as in a previous study where Fe doping reduced the high-temperature stability of TiO2 and prompted the transition to the rutile phase [64].
Figure 7 shows the high-resolution transmission electron microscopy (HRTEM) images and the FFT pattern of the secondary phase particles on the Fe-doped TiO2 nanofibers. The analysis results reveal that the phase of the doped particles is γ-ferrite (austenite) and that it has a face-centered cubic structure.
A photodegradation test was conducted to compare the photocatalytic activity of the TiO2 nanofibers and the Fe-doped TiO2 nanofibers. Figure 8, Figure 9, Figure 10 and Figure 11 show the UV–Vis absorbance of various aqueous solutions sampled every 30 min. Figure 7a plots the absorption spectra of the UV exposed pure methylene blue solution without a photocatalyst, and b, c, and d plot the spectra of the mixture containing P25, TiO2 nanofibers, and Fe-doped TiO2 nanofibers, respectively. Figure 9 shows that AO7 is used as a dye instead of methylene blue, and Figure 10 and Figure 11 show the samples where a Xenon lamp was used as a light source instead of UV. As shown in the graphs, dye degradation was not observed in the blank solution, but it was confirmed that the absorbances of the solutions that dispersed each nanofiber and P25 significantly decreased over time. However, when comparing the degradation tendency at the wavelengths of 663 nm and 483 nm, corresponding with the significant absorption edge of methylene blue and AO7, it can be seen that the photocatalytic performance of the TiO2 nanofibers in the anatase phase is slightly superior to that of Fe-doped TiO2 nanofibers with the rutile phase. The photocatalytic degradation performance was affected by the crystal phase and metal ion doping, and the effect of the anatase phase was more dominant than the effect of metal ion doping. The photocatalytic degradation performance of P25 was also observed to be superior to that of the nanofibers since P25 has a larger surface area than the TiO2 and the Fe-doped TiO2 nanofibers.
Figure 12 shows the photodegradation rate obtained by the absorbance changes of various catalysts every 30 min at the absorption edge. As shown in Figure 8, Figure 9, Figure 10 and Figure 11, there was no change in the blank sample. In the Fe-doped TiO2 nanofibers, photodegradation rates of 38.3% and 27.9% were measured under UV irradiation and visible light, respectively. In both the acid AO7 and the methylene blue, the Fe-doped TiO2 showed lower photodegradation performance than the pure TiO2 photocatalysts, but the difference was decreased under visible light irradiation. Although other catalysts were not activated, the photodegradation rate in Fe-doped TiO2 nanofibers was 9.6% when using AO7 and visible light. We considered two reasons for this tendency. The first is the difference in photocatalytic activity due to the TiO2 crystal structure. As confirmed by the TEM analysis, the phase of the TiO2 matrix in the Fe-doped TiO2 is rutile, and previous studies proved that the rutile phase has lower photocatalytic performance compared to the anatase phase [65,66,67]. The second reason is an excessive dopant concentration. If the concentration of the dopant is too high, the photocatalytic efficiency can be suppressed because electron trapping competes with the surface transfer reaction and reduces the sites on the TiO2 surface where the holes can react with pollution. As seen in Figure 12d, for the case using visible light and acid orange 7, although other catalysts were not activated, the photodegradation rate in the Fe-doped TiO2 nanofibers was 9.6%. The band gap narrowed by Fe-doping increased the photocatalytic performance under visible light. Further research is needed to confirm the special benefits of the narrow band electron structure of Fe-doped TiO2 nanofibers in low-energy incident light and azo dyes.

4. Conclusions

TiO2 is an important material that is being discussed for the removal of organic pollutants. To solve the low photoelectric conversion efficiency issue, we considered Fe-doping among various elements. TiO2 and Fe-doped TiO2 nanofibers were fabricated by an electrospinning process. Fe-doped TiO2 nanofibers were obtained in a single step by adding a dopant element to a solution in a precursor. The average diameter of the nanofibers electrospun with the proposed precursor solution composition was measured to be 181.5 nm for TiO2 and 162.5 nm for Fe-doped TiO2. When heat treated at 350 °C, the crystal phase was anatase for the TiO2 nanofibers and rutile for the Fe-doped TiO2 nanofibers. The Fe-doped TiO2 nanofibers showed lower photocatalytic performance compared to the TiO2 nanofibers because of the rutile crystal phase and excessive Fe concentration. The photocatalytic degradation performance was mainly influenced by the crystal phase and the metal ion doping, and the effect of the anatase phase was more dominant than the effect of the metal ion doping. The photodegradation rate of 9.6% in Fe-doped TiO2 nanofibers using visible light suggests a research direction for photocatalytic materials for environmental applications.

Author Contributions

Conceptualization, K.-H.N. and W.-Y.C.; methodology, B.-S.K. and H.-S.Y.; validation, B.-S.K.; formal analysis, K.-H.N.; resources, W.-Y.C.; data curation, B.-S.K. and H.-S.Y.; writing—original draft preparation, K.-H.N.; writing—review and editing, C.-H.C. and W.-Y.C.; visualization, B.-S.K.; supervision, C.-H.C. and W.-Y.C.; project administration, T.-H.S., S.-W.K. and W.-Y.C.; funding acquisition, T.-H.S., S.-W.K. and W.-Y.C. All authors have read and agreed to the published version of the manuscript.

Funding

This research was financially supported by the Korea Agency for Infrastructure Technology Advancement under the Construction Technology R&D project (Grant No. 21SCIP-B146646-04).

Institutional Review Board Statement

Not applicable.

Informed Consent Statement

Not applicable.

Data Availability Statement

The data supporting the findings of this manuscript are available from the corresponding authors upon reasonable request.

Conflicts of Interest

The authors declare no conflict of interest.

References

  1. Fujishima, A.; Honda, K. Electrochemical photolysis of water at a semiconductor electrode. Nature 1972, 238, 37–38. [Google Scholar] [CrossRef] [PubMed]
  2. Kim, W.-T.; Choi, W.-Y. Fabrication of TiO2 photonic crystal by anodic oxidation and their optical sensing properties. Sensors Actuators A Phys. 2017, 260, 178–184. [Google Scholar] [CrossRef]
  3. Tshabalala, Z.P.; Swart, H.C.; Motaung, D.E. Fabrication of TiO2 nanofibers based sensors for enhanced CH4 performance induced by notable surface area and acid treatment. Vacuum 2021, 187, 110102. [Google Scholar] [CrossRef]
  4. Li, F.; Song, H.; Yu, W.; Ma, Q.; Dong, X.; Wang, J.; Liu, G. Electrospun TiO2//SnO2 Janus nanofibers and its application in ethanol sensing. Mater. Lett. 2020, 262, 127070. [Google Scholar] [CrossRef]
  5. Kim, W.-T.; Na, K.-H.; Lee, J.-K.; Jang, I.; Choi, D.-S.; Choi, W.-Y. Porous TiO2 Nanotube Arrays for Drug Loading and Their Elution Sensing. J. Nanosci. Nanotechnol. 2019, 19, 1743–1748. [Google Scholar] [CrossRef] [PubMed]
  6. Li, L.; Xie, C.; Xiao, X. Polydopamine modified TiO2 nanotube arrays as a local drug delivery system for ibuprofen. J. Drug Deliv. Sci. Technol. 2020, 56, 101537. [Google Scholar] [CrossRef]
  7. León, A.; Reuquen, P.; Garín, C.; Segura, R.; Vargas, P.; Zapata, P.; Orihuela, P.A. FTIR and Raman characterization of TiO2 nanoparticles coated with polyethylene glycol as carrier for 2-methoxyestradiol. Appl. Sci. 2017, 7, 49. [Google Scholar] [CrossRef]
  8. Liu, D.; Bi, Y. Controllable fabrication of hollow TiO2 spheres as sustained release drug carrier. Adv. Powder Technol. 2019, 30, 2169–2177. [Google Scholar] [CrossRef]
  9. Li, H.; Wang, P.; Yi, X.; Yu, H. Edge-selectively amidated graphene for boosting H2-evolution activity of TiO2 photocatalyst. Appl. Catal. B Environ. 2020, 264, 118504. [Google Scholar] [CrossRef]
  10. Khan, T.T.; Bari, G.A.K.M.; Kang, H.-J.; Lee, T.-G.; Park, J.-W.; Hwang, H.J.; Hossain, S.M.; Mun, J.S.; Suzuki, N.; Fujishima, A. Synthesis of N-Doped TiO2 for Efficient Photocatalytic Degradation of Atmospheric NOx. Catalysts 2021, 11, 109. [Google Scholar] [CrossRef]
  11. Sun, X.; Li, H.-J.; Ou, N.; Lyu, B.; Gui, B.; Tian, S.; Qian, D.; Wang, X.; Yang, J. Visible-light driven TiO2 photocatalyst coated with graphene quantum dots of tunable nitrogen doping. Molecules 2019, 24, 344. [Google Scholar] [CrossRef] [Green Version]
  12. Blanco, M.; Monteserín, C.; Angulo, A.; Pérez-Márquez, A.; Maudes, J.; Murillo, N.; Aranzabe, E.; Ruiz-Rubio, L.; Vilas, J.L. TiO2-doped electrospun nanofibrous membrane for photocatalytic water treatment. Polymers 2019, 11, 747. [Google Scholar] [CrossRef] [PubMed] [Green Version]
  13. Liu, D.; Wang, J.; Zhou, J.; Xi, Q.; Li, X.; Nie, E.; Piao, X.; Sun, Z. Fabricating I doped TiO2 photoelectrode for the degradation of diclofenac: Performance and mechanism study. Chem. Eng. J. 2019, 369, 968–978. [Google Scholar] [CrossRef]
  14. Kim, K.-P.; Kim, W.H.; Kwon, S.M.; Kim, J.Y.; Do, Y.S.; Woo, S. Enhanced Light Absorption by Facile Patterning of Nano-Grating on Mesoporous TiO2 Photoelectrode for Cesium Lead Halide Perovskite Solar Cells. Nanomaterials 2021, 11, 1233. [Google Scholar] [CrossRef]
  15. Tsvetkov, N.; Larina, L.; Ku Kang, J.; Shevaleevskiy, O. Sol-gel processed TiO2 nanotube photoelectrodes for dye-sensitized solar cells with enhanced photovoltaic performance. Nanomaterials 2020, 10, 296. [Google Scholar] [CrossRef] [PubMed] [Green Version]
  16. Abbas, M.M.; Rasheed, M. Solid State Reaction Synthesis and Characterization of Cu doped TiO2 Nanomaterials. In Proceedings of the 2nd International Conference on Materials, Laser science and Applied physics (ICMLAP), Orlando, FL, USA, 10–14 October; 2021; 1795, p. 12059. [Google Scholar]
  17. Ren, Y.; Han, Y.; Li, Z.; Liu, X.; Zhu, S.; Liang, Y.; Yeung, K.W.K.; Wu, S. Ce and Er Co-doped TiO2 for rapid bacteria-killing using visible light. Bioact. Mater. 2020, 5, 201–209. [Google Scholar] [CrossRef]
  18. Li, R.; Yang, J.; Xu, S.; Zhou, Y.; Wang, X.; Peng, H.; Du, J. Preparation of Gd-Doped TiO2 Nanotube Arrays by Anodization Method and Its Photocatalytic Activity for Methyl Orange Degradation. Catalysts 2020, 10, 298. [Google Scholar] [CrossRef] [Green Version]
  19. Ismail, M.A.; Hedhili, M.N.; Anjum, D.H.; Singaravelu, V.; Chung, S.H. Synthesis and Characterization of Iron-Doped TiO2 Nanoparticles Using Ferrocene from Flame Spray Pyrolysis. Catalysts 2021, 11, 438. [Google Scholar] [CrossRef]
  20. Heng, J.Z.X.; Tang, K.Y.; Regulacio, M.D.; Lin, M.; Loh, X.J.; Li, Z.; Ye, E. Solar-powered photodegradation of pollutant dyes using silver-embedded porous TiO2 nanofibers. Nanomaterials 2021, 11, 856. [Google Scholar] [CrossRef]
  21. Tang, K.Y.; Chen, J.X.; Legaspi, E.D.R.; Owh, C.; Lin, M.; Tee, I.S.Y.; Kai, D.; Loh, X.J.; Li, Z.; Regulacio, M.D.; et al. Gold-decorated TiO2 nanofibrous hybrid for improved solar-driven photocatalytic pollutant degradation. Chemosphere 2021, 265, 129114. [Google Scholar] [CrossRef] [PubMed]
  22. Valero-Romero, M.J.; Santaclara, J.G.; Oar-Arteta, L.; van Koppen, L.; Osadchii, D.Y.; Gascon, J.; Kapteijn, F. Photocatalytic properties of TiO2 and Fe-doped TiO2 prepared by metal organic framework-mediated synthesis. Chem. Eng. J. 2019, 360, 75–88. [Google Scholar] [CrossRef]
  23. Ruggieri, F.; Di Camillo, D.; Maccarone, L.; Santucci, S.; Lozzi, L. Electrospun Cu-, W- and Fe-doped TiO2 nanofibres for photocatalytic degradation of rhodamine 6G. J. Nanoparticle Res. 2013, 15. [Google Scholar] [CrossRef]
  24. Li, X.; Shi, J.-L.; Hao, H.; Lang, X. Visible light-induced selective oxidation of alcohols with air by dye-sensitized TiO2 photocatalysis. Appl. Catal. B Environ. 2018, 232, 260–267. [Google Scholar] [CrossRef]
  25. Ding, H.; Xu, M.; Zhang, S.; Yu, F.; Kong, K.; Shen, Z.; Hua, J. Organic blue-colored DA-π-A dye-sensitized TiO2 for efficient and stable photocatalytic hydrogen evolution under visible/near-infrared-light irradiation. Renew. Energy 2020, 155, 1051–1059. [Google Scholar] [CrossRef]
  26. Ahmad, I.; Kan, C. Visible-light-driven, dye-sensitized TiO2 photo-catalyst for self-cleaning cotton fabrics. Coatings 2017, 7, 192. [Google Scholar] [CrossRef] [Green Version]
  27. Li, Z.-Q.; Mo, L.-E.; Chen, W.-C.; Shi, X.-Q.; Wang, N.; Hu, L.-H.; Hayat, T.; Alsaedi, A.; Dai, S.-Y. Solvothermal synthesis of hierarchical TiO2 microstructures with high crystallinity and superior light scattering for high-performance dye-sensitized solar cells. ACS Appl. Mater. Interfaces 2017, 9, 32026–32033. [Google Scholar] [CrossRef]
  28. Zhang, G.; Zhang, S.; Wang, L.; Liu, R.; Zeng, Y.; Xia, X.; Liu, Y.; Luo, S. Facile synthesis of bird’s nest-like TiO2 microstructure with exposed (001) facets for photocatalytic degradation of methylene blue. Appl. Surf. Sci. 2017, 391, 228–235. [Google Scholar] [CrossRef]
  29. Liu, H.; Zhang, L.; Li, T. A study of controllable synthesis and formation mechanism on flower-like TiO2 with spherical structure. Crystals 2018, 8, 466. [Google Scholar] [CrossRef] [Green Version]
  30. Akshay, V.R.; Arun, B.; Mandal, G.; Mutta, G.R.; Chanda, A.; Vasundhara, M. Observation of optical band-gap narrowing and enhanced magnetic moment in co-doped sol–gel-derived anatase TiO2 nanocrystals. J. Phys. Chem. C 2018, 122, 26592–26604. [Google Scholar] [CrossRef]
  31. Singh, J.; Sharma, S.; Sharma, S.; Singh, R.C. Effect of tungsten doping on structural and optical properties of rutile TiO2 and band gap narrowing. Optik 2019, 182, 538–547. [Google Scholar] [CrossRef]
  32. Hsu, J.-C.; Lin, Y.-H.; Wang, P.W. X-ray Photoelectron Spectroscopy Analysis of Nitrogen-Doped TiO2 Films Prepared by Reactive-Ion-Beam Sputtering with Various NH3/O2 Gas Mixture Ratios. Coatings 2020, 10, 47. [Google Scholar] [CrossRef] [Green Version]
  33. Mathew, S.; Ganguly, P.; Rhatigan, S.; Kumaravel, V.; Byrne, C.; Hinder, S.J.; Bartlett, J.; Nolan, M.; Pillai, S.C. Cu-doped TiO2: Visible light assisted photocatalytic antimicrobial activity. Appl. Sci. 2018, 8, 2067. [Google Scholar] [CrossRef] [Green Version]
  34. Moradi, V.; Jun, M.B.G.; Blackburn, A.; Herring, R.A. Significant improvement in visible light photocatalytic activity of Fe doped TiO2 using an acid treatment process. Appl. Surf. Sci. 2018, 427, 791–799. [Google Scholar] [CrossRef]
  35. Kumaravel, V.; Rhatigan, S.; Mathew, S.; Michel, M.C.; Bartlett, J.; Nolan, M.; Hinder, S.J.; Gascó, A.; Ruiz-Palomar, C.; Hermosilla, D. Mo doped TiO2: Impact on oxygen vacancies, anatase phase stability and photocatalytic activity. J. Phys. Mater. 2020, 3, 25008. [Google Scholar] [CrossRef]
  36. Dong, Z.; Ding, D.; Li, T.; Ning, C. Ni-doped TiO2 nanotubes photoanode for enhanced photoelectrochemical water splitting. Appl. Surf. Sci. 2018, 443, 321–328. [Google Scholar] [CrossRef]
  37. Gogoi, D.; Namdeo, A.; Golder, A.K.; Peela, N.R. Ag-doped TiO2 photocatalysts with effective charge transfer for highly efficient hydrogen production through water splitting. Int. J. Hydrogen Energy 2020, 45, 2729–2744. [Google Scholar] [CrossRef]
  38. Begum, T.; Gogoi, P.K.; Bora, U. Photocatalytic degradation of crystal violet dye on the surface of Au doped TiO2 nanoparticle. Indian J. Chem. Technol. 2017, 24, 97–101. [Google Scholar]
  39. Nguyen, C.H.; Fu, C.-C.; Juang, R.-S. Degradation of methylene blue and methyl orange by palladium-doped TiO2 photocatalysis for water reuse: Efficiency and degradation pathways. J. Clean. Prod. 2018, 202, 413–427. [Google Scholar] [CrossRef]
  40. Mahy, J.G.; Cerfontaine, V.; Poelman, D.; Devred, F.; Gaigneaux, E.M.; Heinrichs, B.; Lambert, S.D. Highly efficient low-temperature N-doped TiO2 catalysts for visible light photocatalytic applications. Materials. 2018, 11, 584. [Google Scholar] [CrossRef] [Green Version]
  41. Shao, J.; Sheng, W.; Wang, M.; Li, S.; Chen, J.; Zhang, Y.; Cao, S. In situ synthesis of carbon-doped TiO2 single-crystal nanorods with a remarkably photocatalytic efficiency. Appl. Catal. B Environ. 2017, 209, 311–319. [Google Scholar] [CrossRef]
  42. Simsek, E.B. Solvothermal synthesized boron doped TiO2 catalysts: Photocatalytic degradation of endocrine disrupting compounds and pharmaceuticals under visible light irradiation. Appl. Catal. B Environ. 2017, 200, 309–322. [Google Scholar] [CrossRef]
  43. Qin, D.-D.; Wang, Q.-H.; Chen, J.; He, C.-H.; Li, Y.; Wang, C.-H.; Quan, J.-J.; Tao, C.-L.; Lu, X.-Q. Phosphorus-doped TiO2 nanotube arrays for visible-light-driven photoelectrochemical water oxidation. Sustain. Energy Fuels 2017, 1, 248–253. [Google Scholar] [CrossRef]
  44. Yang, C.; Shang, S.; Li, X. Fabrication of sulfur-doped TiO2 nanotube array as a conductive interlayer of PbO2 anode for efficient electrochemical oxidation of organic pollutants. Sep. Purif. Technol. 2021, 258, 118035. [Google Scholar] [CrossRef]
  45. Cheng, H.-H.; Chen, S.-S.; Yang, S.-Y.; Liu, H.-M.; Lin, K.-S. Sol-Gel hydrothermal synthesis and visible light photocatalytic degradation performance of Fe/N codoped TiO2 catalysts. Materials. 2018, 11, 939. [Google Scholar] [CrossRef] [PubMed] [Green Version]
  46. Liang, Y.; Sun, S.; Deng, T.; Ding, H.; Chen, W.; Chen, Y. The preparation of TiO2 film by the sol-gel method and evaluation of its self-cleaning property. Materials 2018, 11, 450. [Google Scholar] [CrossRef] [PubMed] [Green Version]
  47. Çırak, B.B.; Karadeniz, S.M.; Kılınç, T.; Caglar, B.; Ekinci, A.E.; Yelgin, H.; Kürekçi, M.; Çırak, Ç. Synthesis, surface properties, crystal structure and dye sensitized solar cell performance of TiO2 nanotube arrays anodized under different voltages. Vacuum 2017, 144, 183–189. [Google Scholar] [CrossRef]
  48. Kim, W.-T.; Na, K.-H.; Park, D.-C.; Yang, W.-H.; Choi, W.-Y. Photocatalytic Methylene Blue Degradation of Electrospun Ti–Zn Complex Oxide Nanofibers. Nanomaterials 2020, 10, 1311. [Google Scholar] [CrossRef]
  49. Lee, C.-G.; Na, K.-H.; Kim, W.-T.; Park, D.-C.; Yang, W.-H.; Choi, W.-Y. TiO2/ZnO Nanofibers Prepared by Electrospinning and Their Photocatalytic Degradation of Methylene Blue Compared with TiO2 Nanofibers. Appl. Sci. 2019, 9, 3404. [Google Scholar] [CrossRef] [Green Version]
  50. Wang, Y.; Tian, L.; Zhu, T.; Mei, J.; Chen, Z.; Yu, D.-G. Electrospun aspirin/Eudragit/lipid hybrid nanofibers for colon-targeted delivery using an energy-saving process. Chem. Res. Chinese Univ. 2021, 1–7. [Google Scholar]
  51. Ding, Y.; Dou, C.; Chang, S.; Xie, Z.; Yu, D.-G.; Liu, Y.; Shao, J. Core–shell eudragit s100 nanofibers prepared via triaxial electrospinning to provide a colon-targeted extended drug release. Polymers. 2020, 12, 2034. [Google Scholar] [CrossRef]
  52. Wang, M.; Li, D.; Li, J.; Li, S.; Chen, Z.; Yu, D.-G.; Liu, Z.; Guo, J.Z. Electrospun Janus zein–PVP nanofibers provide a two-stage controlled release of poorly water-soluble drugs. Mater. Des. 2020, 196, 109075. [Google Scholar] [CrossRef]
  53. Wang, M.; Hou, J.; Yu, D.-G.; Li, S.; Zhu, J.; Chen, Z. Electrospun tri-layer nanodepots for sustained release of acyclovir. J. Alloys Compd. 2020, 846, 156471. [Google Scholar] [CrossRef]
  54. Aidana, Y.; Wang, Y.; Li, J.; Chang, S.; Wang, K.; Yu, D.-G. Fast Dissolution Electrospun Medicated Nanofibers for Effective Delivery of Poorly Water-Soluble Drugs. Curr. Drug Deliv. 2021. [Google Scholar] [CrossRef]
  55. El-Newehy, M.H.; El-Naggar, M.E.; Alotaiby, S.; El-Hamshary, H.; Moydeen, M.; Al-Deyab, S. Green electrospining of hydroxypropyl cellulose nanofibres for drug delivery applications. J. Nanosci. Nanotechnol. 2018, 18, 805–814. [Google Scholar] [CrossRef]
  56. Sharaf, S.; El-Naggar, M.E. Eco-friendly technology for preparation, characterization and promotion of honey bee propolis extract loaded cellulose acetate nanofibers in medical domains. Cellulose 2018, 25, 5195–5204. [Google Scholar] [CrossRef]
  57. Abdelgawad, A.M.; El-Naggar, M.E.; Hudson, S.M.; Rojas, O.J. Fabrication and characterization of bactericidal thiol-chitosan and chitosan iodoacetamide nanofibres. Int. J. Biol. Macromol. 2017, 94, 96–105. [Google Scholar] [CrossRef] [PubMed]
  58. El-Naggar, M.E.; Abdelgawad, A.M.; Salas, C.; Rojas, O.J. Curdlan in fibers as carriers of tetracycline hydrochloride: Controlled release and antibacterial activity. Carbohydr. Polym. 2016, 154, 194–203. [Google Scholar] [CrossRef]
  59. El-Newehy, M.H.; El-Naggar, M.E.; Alotaiby, S.; El-Hamshary, H.; Moydeen, M.; Al-Deyab, S. Preparation of biocompatible system based on electrospun CMC/PVA nanofibers as controlled release carrier of diclofenac sodium. J. Macromol. Sci. Part A 2016, 53, 566–573. [Google Scholar] [CrossRef]
  60. Rubin Pedrazzo, A.; Cecone, C.; Morandi, S.; Manzoli, M.; Bracco, P.; Zanetti, M. Nanosized SnO2 Prepared by Electrospinning: Influence of the Polymer on Both Morphology and Microstructure. Polymers 2021, 13, 977. [Google Scholar] [CrossRef]
  61. Ehrmann, A. Non-Toxic Crosslinking of Electrospun Gelatin Nanofibers for Tissue Engineering and Biomedicine—A Review. Polymers 2021, 13, 1973. [Google Scholar] [CrossRef]
  62. Dodero, A.; Scarfi, S.; Mirata, S.; Sionkowska, A.; Vicini, S.; Alloisio, M.; Castellano, M. Effect of crosslinking type on the physical-chemical properties and biocompatibility of chitosan-based electrospun membranes. Polymers 2021, 13, 831. [Google Scholar] [CrossRef]
  63. Chiaradia, V.; Hanay, S.B.; Kimmins, S.D.; de Oliveira, D.; Araújo, P.H.H.; Sayer, C.; Heise, A. Crosslinking of electrospun fibres from unsaturated polyesters by bis-triazolinediones (TAD). Polymers 2019, 11, 1808. [Google Scholar] [CrossRef] [PubMed] [Green Version]
  64. Park, J.-Y.; Lee, J.-H.; Choi, D.-Y.; Hwang, C.-H.; Lee, J.-W. Influence of Fe doping on phase transformation and crystallite growth of electrospun TiO2 nanofibers for photocatalytic reaction. Mater. Lett. 2012, 88, 156–159. [Google Scholar] [CrossRef]
  65. Luttrell, T.; Halpegamage, S.; Tao, J.; Kramer, A.; Sutter, E.; Batzill, M. Why is anatase a better photocatalyst than rutile - Model studies on epitaxial TiO2 films. Sci. Rep. 2014, 4, 4043. [Google Scholar] [CrossRef] [PubMed] [Green Version]
  66. Günnemann, C.; Haisch, C.; Fleisch, M.; Schneider, J.; Emeline, A.V.; Bahnemann, D.W. Insights into Different Photocatalytic Oxidation Activities of Anatase, Brookite, and Rutile Single-Crystal Facets. ACS Catal. 2019, 9, 1001–1012. [Google Scholar] [CrossRef]
  67. Tayade, R.J.; Surolia, P.K.; Kulkarni, R.G.; Jasra, R. V Photocatalytic degradation of dyes and organic contaminants in water using nanocrystalline anatase and rutile TiO2. Sci. Technol. Adv. Mater. 2007, 8, 455–462. [Google Scholar] [CrossRef] [Green Version]
Figure 1. TGA curves of Fe-doped TiO2 nanofibers and TiO2 nanofibers.
Polymers 13 02634 g001
Figure 2. Field-emission scanning electron microscope images of nanofibers: (a) low-magnification images of the TiO2 nanofiber, (b) high-magnification images of the TiO2 nanofiber, (c) low-magnification images of the Fe-doped TiO2 nanofiber, and (d) high-magnification images of the Fe-doped TiO2 nanofiber.
Polymers 13 02634 g002
Figure 3. Diameter distribution histogram of nanofibers: (a) TiO2 nanofibers and (b) Fe-doped TiO2 nanofibers.
Polymers 13 02634 g003
Figure 4. TEM images of nanofibers obtained from each precursor solution: (a) bright-field images (BF) of the TiO2 nanofiber, (b) high-angle annular dark-field images (HAADF) of the TiO2 nanofiber, (c) BF images of the Fe-doped TiO2 nanofiber, and (d) HAADF images of the Fe-doped TiO2 nanofiber.
Polymers 13 02634 g004
Figure 5. EDS map data of each nanofiber: (a) TiO2 nanofibers and (b) Fe-TiO2 nanofibers.
Polymers 13 02634 g005
Figure 6. Selected area electron diffraction patterns obtained from nanofibers: (a) TiO2 nanofibers and (b) Fe-doped TiO2 nanofibers.
Polymers 13 02634 g006
Figure 7. High-resolution transmission electron microscopy (HRTEM) analysis of particles on the surface of Fe-doped TiO2 nanofibers: (a) BF image of the particle, (b) HRTEM image of the particle, and (c) FFT patterns of the particle.
Polymers 13 02634 g007
Figure 8. UV–Vis absorption spectra of the ultraviolet photocatalytic degradation of an aqueous methylene blue solution by nanofibers: (a) blank, (b) P25, (c) TiO2 nanofibers, (d) Fe-doped TiO2 nanofibers.
Polymers 13 02634 g008
Figure 9. UV–Vis absorption spectra of the ultraviolet photocatalytic degradation of an aqueous acid orange 7 solution by nanofibers: (a) blank, (b) P25, (c) TiO2 nanofibers, (d) Fe-doped TiO2 nanofibers.
Polymers 13 02634 g009
Figure 10. UV–Vis absorption spectra of the visible light photocatalytic degradation of an aqueous methylene blue solution by nanofibers: (a) blank, (b) P25, (c) TiO2 nanofibers, (d) Fe-doped TiO2 nanofibers.
Polymers 13 02634 g010
Figure 11. UV–Vis absorption spectra of the visible light photocatalytic degradation of an aqueous acid orange 7 solution by nanofibers: (a) blank, (b) P25, (c) TiO2 nanofibers, (d) Fe-doped TiO2 nanofibers.
Polymers 13 02634 g011
Figure 12. Photodegradation rate of methylene blue and acid orange 7 by various photocatalysts and light sources: (a) ultraviolet and methylene blue, (b) ultraviolet and acid orange 7, (c) visible light and methylene blue, (d) visible light and acid orange 7.
Polymers 13 02634 g012
Publisher’s Note: MDPI stays neutral with regard to jurisdictional claims in published maps and institutional affiliations.

